Sample Category Title
XAUUSD Now Bullish
Technical analysis
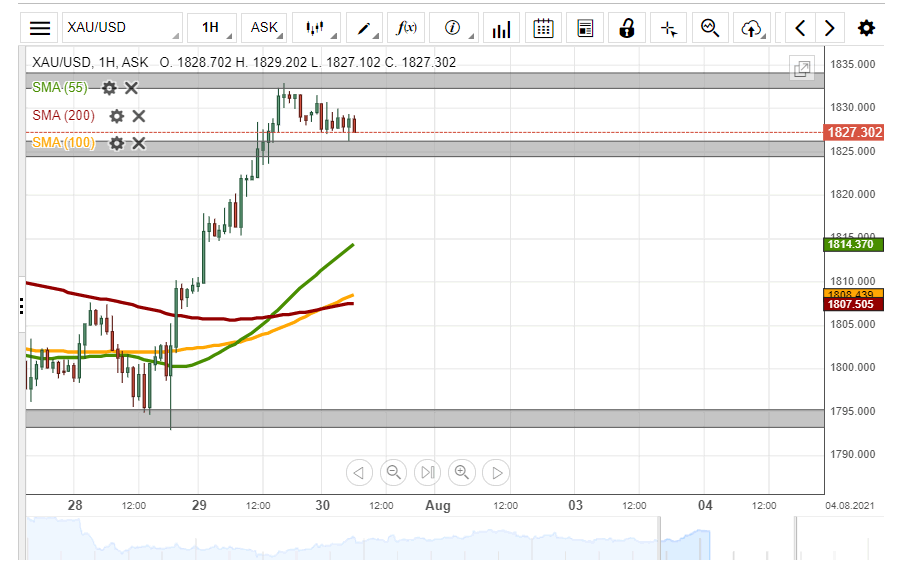
XAUUSD has turned bullish on the four-hour time fram as a large inverted head and shoulders pattern has finally been ignited to the upside.
The four-hour time frame also shows that the MACD indicator has turned bullish, with the MACD histogram and signal line starting to trend higher.
What the possible outcomes are
In our most likely scenario, XAUSUD advances towards the $1,860 level as a large inverted head and shoulders pattern plays out to the upside.
Alternatively, XAUSUD may test towards the $1,810 level on final time before starting to advance towards the mentioned upside target of $1,860.
Key levels
Support $1,810 $1,800
Resistance $1,845 $1,860
USDJPY Bearish Bias
Technical analysis
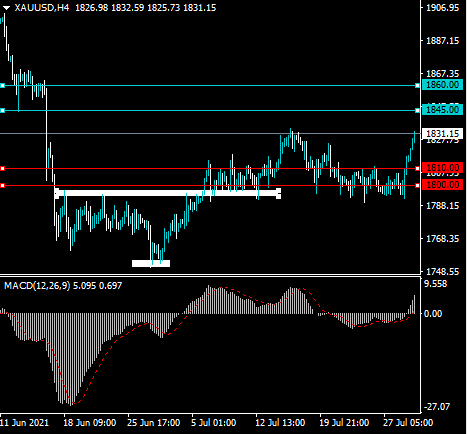
The daily time frame shows that the USDJPY pair is trading under the neckline of a large head and shoulders pattern, which is pointing to more heavy losses.
The Momentum indicator on the daily time frame shows that substantial amount of bearish divergence has formed, and extends down to the 106.50 level.
What the possible outcomes are
In our most likely scenario, the USDJPY pair will continue to head lower over the mid-term as the bearish head and shoulders pattern continues to play out on the daily time frame.
Alternatively, the USDJPY pair may start to consolidate between the 109.00 and 110.00 levels and then test back towards the yearly high, around the 111.50 resistance area.
Key levels
Support 108.50 106.50
Resistance 110.20 111.50
USDCAD Still Bearish
Technical analysis
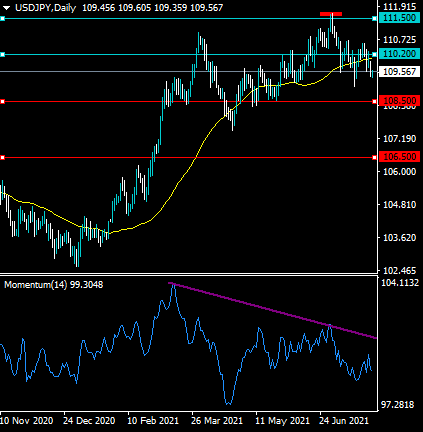
The USDCAD pair is still sliding lower after suffering multiple heavy technical rejections from its trend defining 200-day moving average.
The daily time frame shows that a bearish head and shoulders pattern has also formed and is close to being activated. The size of the pattern is warning that the pair could drop to the 1.2000 level.
What the possible outcomes are
In our most likely scenario, the bearish price trend continues and the USDCAD pair will fall back towards the 1.2000 support level over the medium-term horizon.
Alternatively, the USDCAD pair will stage a minor recovery back towards the 1.2500 resistance level and then stage a downside move towards the 1.2250 price area.
Key levels
Support 1.2250 1.2000
Resistance 1.2500 1.2600
US Futures Lower After Disappointing Robinhood Debut
The US dollar rose slightly after relatively weak GDP data. The numbers showed that the American economy grew at a lower pace than expected. It rose by 6.5% in the second quarter, lower than the expected 8.5%. It was just a modest improvement from the 6.3% in the first quarter. Still, this growth propelled the US economy above pre-pandemic levels for the first time since the pandemic started. The main lagged was residential investments and inventories, which were caused by labour shortages and supply chain disruptions. The currency will react to the latest US purchaser consumption expenditure (PCE), which is the Fed’s favourite inflation tool.
US stocks retreated slightly even after strong results from tech giants like Apple, Facebook, and Amazon. The main topic was Robinhood, whose shares became publicly traded for the first time yesterday. The firm’s stock declined by more than 8% as investors questioned the company’s valuation. The company ended the day being valued at more than $29 billion, which was still higher than the $11 billion that private investors had valued the firm. The weakness was also likely because of the regulatory concerns about the company and the fact that it allocated its stock to traders in its platform.
The Japanese yen tilted upwards after the latest industrial and jobs data from the country. According to the Ministry of Finance, the country’s unemployment rate improved from 3.0% in May to 2.9% in June. At the same time, its jobs to applications ratio rose from 1.09 to 1.13. Meanwhile, its industrial production rose by 6.2% in June while retail sales rose by 0.1%. These numbers show that the Japanese economy is doing relatively well. Later today, the top numbers to watch will be the flash Eurozone inflation data, Canada GDP numbers, and Norwegian employment figures.
USDJPY
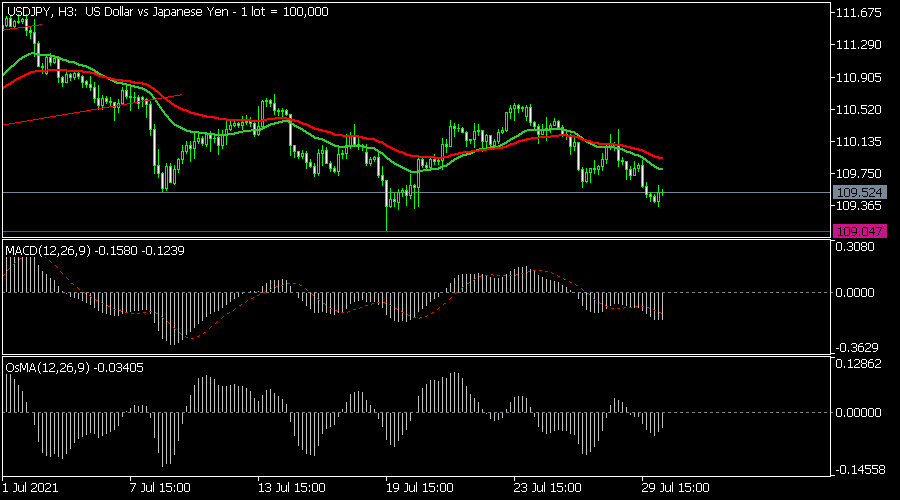
The USDJPY rose slightly to 109.52, which was slightly higher than this week’s low of 109.34. On the three-hour chart, the pair was still below this week’s high of 110.55. It is slightly below the 25-day and 150-day moving averages while the MACD and the Moving Average of Oscillator have moved below the neutral line. Therefore, the pair will likely maintain a bearish momentum as bears target the next key support at 109.05.
EURUSD
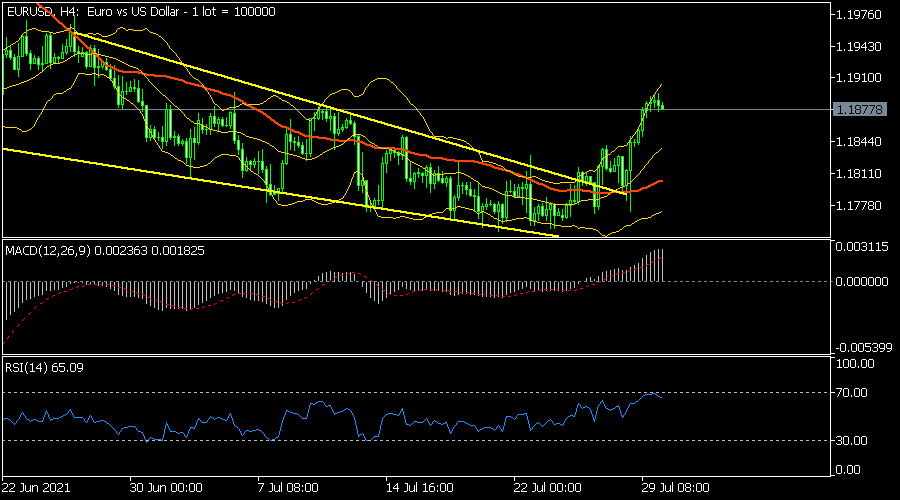
The EURUSD pair rose to an intraday high of 1.1890, which was the highest level since July 13. On the 4 hour chart, the pair moved above the upper side of the falling wedge pattern. It is also along the upper side of the Bollinger Bands while the Relative Strength Index (RSI) kept rising. The MACD is also above the neutral level. Therefore, the pair will likely maintain the bullish momentum.
USDCAD
The USD/CAD pair declined to 1.2430, which was the lowest level since July 16. On the four-hour chart, the pair moved below the 15-day and 25-day moving averages. It is also approaching the 50% Fibonacci retracement level while the RSI has moved to the oversold level. Therefore, the pair will likely continue as bears target the next key level at 1.2350.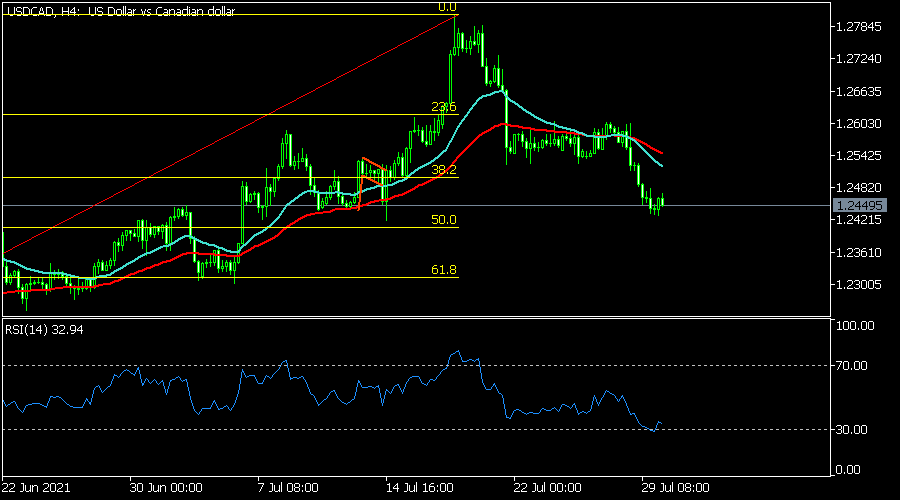
The First Estimate Of The EMU GDP
Markets
Yesterday, global markets enjoined a rather calm, constructive trading session. Uncertainty on the China regulatory overhaul moved a bit to the background. The Fed's ongoing accommodative policy stance also contributed to a benign trading environment. Investors had to cope with an avalanche of data both the Europe and the US. Especially European data almost unequivocally printed stronger than expected. EC economic sentiment for EMU hit record high. German unemployment declined much faster than expected. At the same time, German HCPI inflation jumped to the highest level since August 2008 (3.1% Y/Y). Still, the combination of strong activity data and higher inflation was no game-changer for European interest rate markets. German yields hardly changed. At 0.45%, the German 10-y yield continues to feel the forces of gravity. The headline figure of the US Q2 GDP at 6.5% Q/Qa printed softer than expected, but amongst other this was due to lower inventories. Private consumption remains strong. The core PCE deflator jumped sharply to 6.1%, but this was expected. The US yield curve succeeded a modest post-Fed steepening, with yields rising between 0.2 bp and 3.9 bp (30-y). However, this didn't change the broader picture after recent flattening trend. A better risk sentiment and steeper US curve also caused further USD profit taking. EUR/USD tested the 1.1881/95 resistance (close at 1.1887). US and European equites mostly gained up to 0.5%.
This morning, Asian equities can't maintain yesterday's more constructive bias. Uncertainty on China regulation still lingers. Disappointing Q2 revenue and outlook of Amazon published after the close in the US, are causing a setback in US futures. US Treasury yields are declining (2.5 bp 10-y). The risk off also slows the decline of the dollar. (EUR/USD 1.1880, DXY 91.95).
Today, the US June spending and income data are probably less important after yesterday's GDP release. The Chicago PMI (expected to ease further to 64.1) might be a pointer for next week's key US early month data. In EMU, several countries will report Q2 GDP data. The first estimate of the EMU GDP is expected at 1.5% Q/Q and 13.2% Y/Y. The Flash EMU CPI is seen at -0.3% M/M and 2.0%. Yesterday's German CPI data suggest upside risks, but did little to lift European yields. This might be even more difficult in a risk-off context. The -0.47% support for the 10-y German yields remains at risk. The US 10-y yield (1.2450%) also fails to move higher in the 1.20%/1.30% ST consolidation pattern. EUR/USD left a ST downtrend channel. However, the 1.1881/95 resistance (previous intermediate top) already might be a first roadblock in case of a less positive risk sentiment. EUR/USD regaining 1.1975 would call off the setback that started end May. Sterling had a good run of late. The focus is turning to next week's BOE policy meeting. With already some good news for sterling discounted, a sustained break below the 0.85/0.8472 support might be difficult ahead of Thursday's BoE announcement.
News headlines
The economic recovery in Japan was gaining traction in June, according to several data series published this morning. Industrial production jumped a stronger than expected 6.2% M/M after declining 6.5% in May. Output was 22.6% higher compared to the same period last year. The rebound in June production was mainly driven by auto production and machinery. Labour market conditions in Japan remain tight. The Unemployment rate declined from 3.0% to 2.9%. The Job-to-applicant ration jumped from 1.09 to 1.13, indicating ample job availability. Retails sales data were more mixed with sales gaining 3.1% M/M to be up 0.1% Y/Y. A new jumped in infections currently suggests that the rebound in domestically oriented sectors of the economy might slow in current quarter.
South Korea June production data showed a similar pattern as was the case in Japan. Production rebounded in 2.2% in June after a 1.0% decline in May. June production was 11.9% higher compared to last year. An rise in semi-conductors and auto production supported the rise in production.
Note: There will be no KBC Markets-Economics reports from Monday August 2. We resume our publications Tuesday August 10.
US 30 Breaks To New Highs
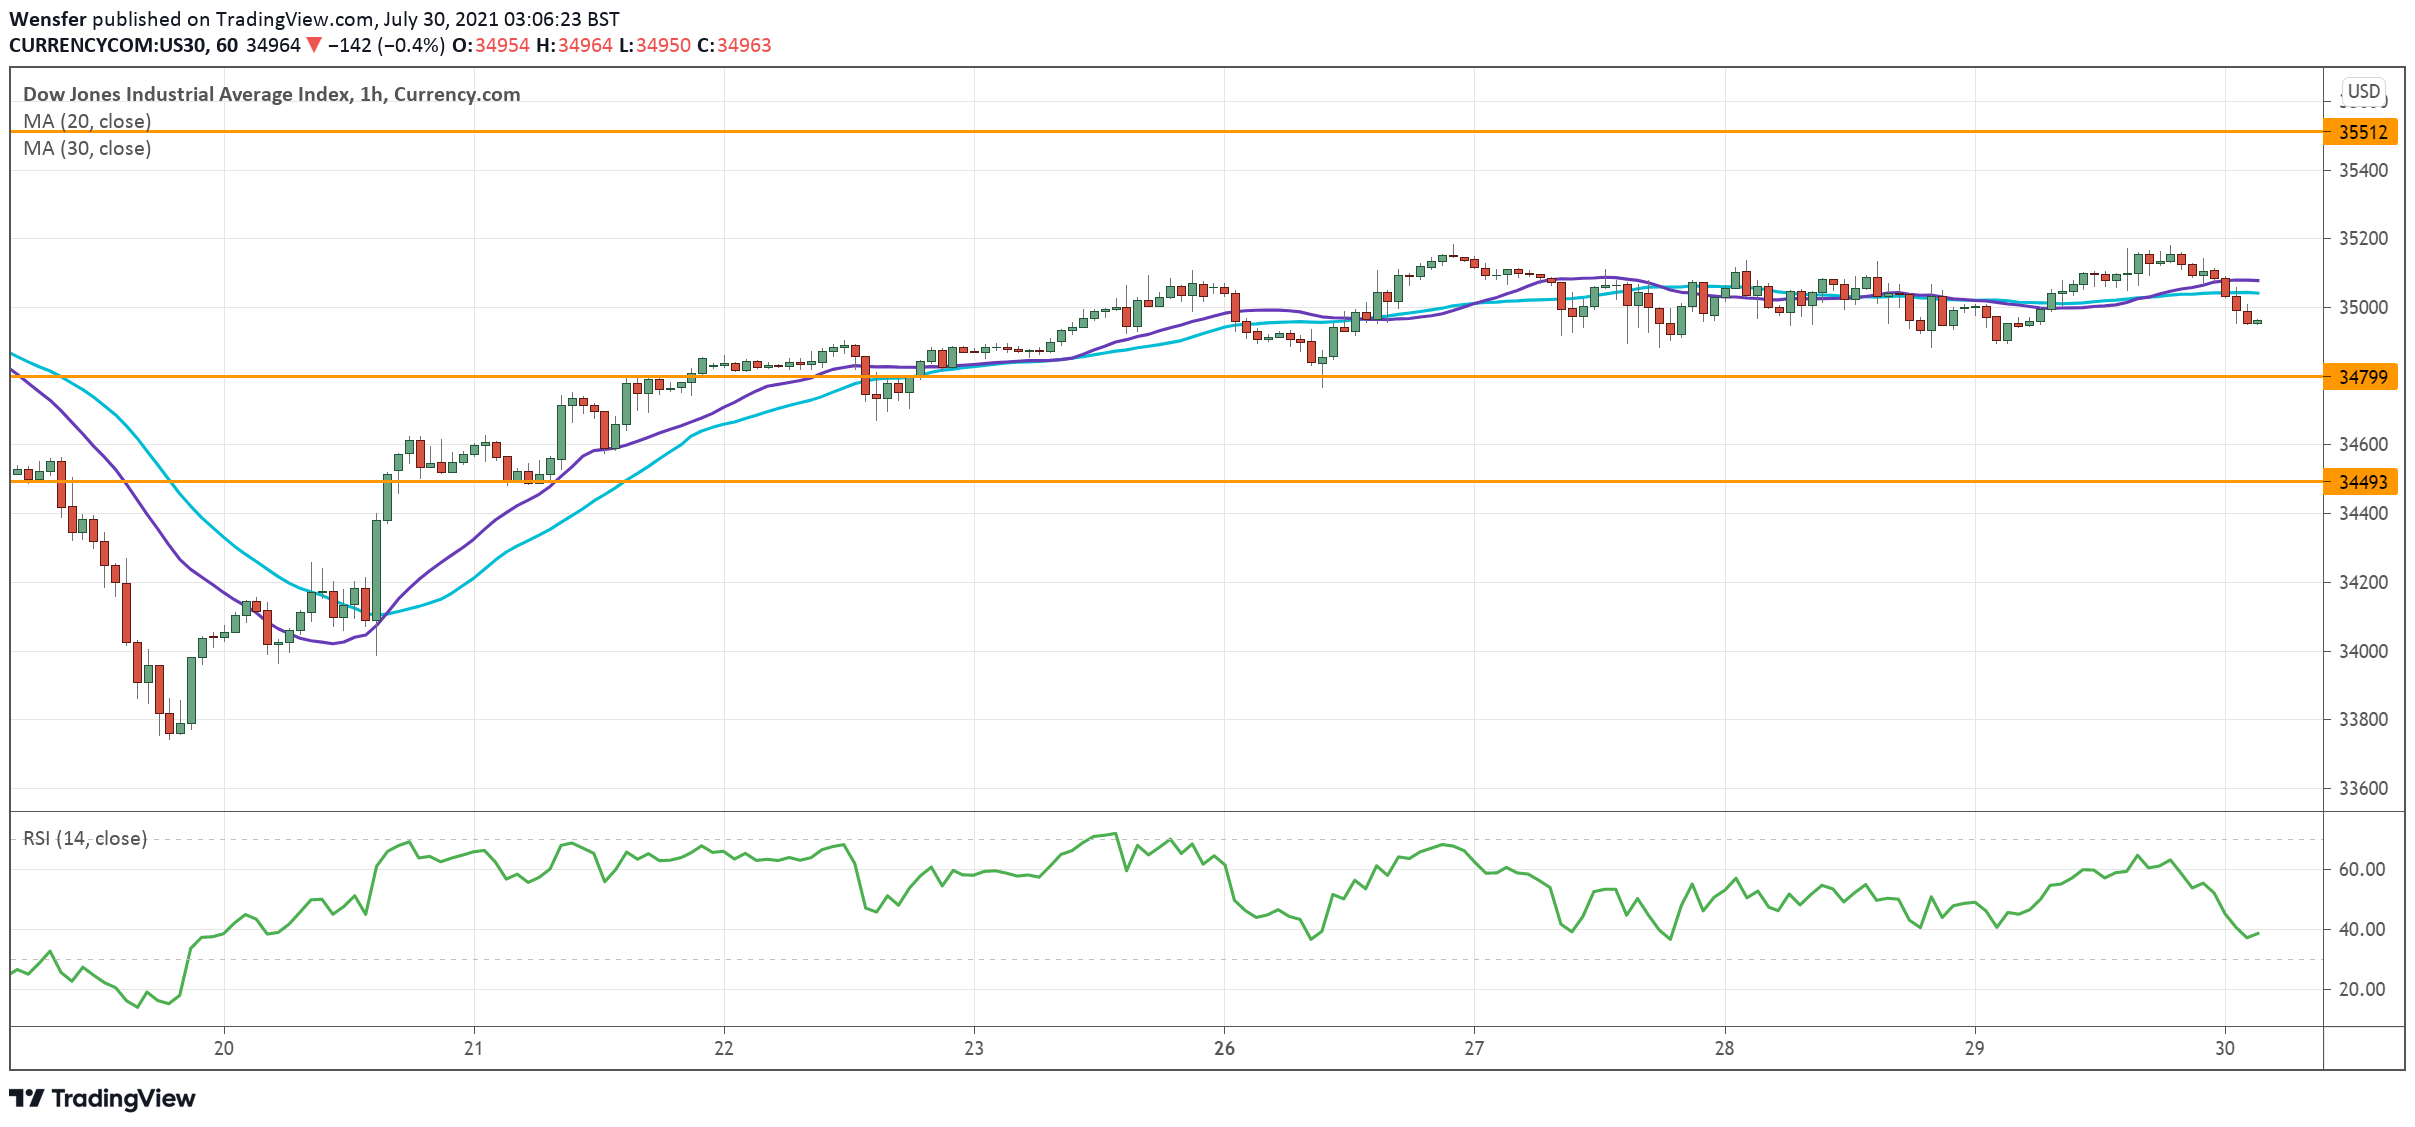
The Dow Jones index found support from the prospect of continuous stimulus in the US.
The index consolidated its gains after it rallied above the peak at 35100. 34800 is a fresh support as buyers have a stake in after the breakout confirmation.
US indices lately have been exhibiting a volatility pattern in which a sharp drop is followed by strong bidding.
While sentiment remains generally positive, a deeper pullback here may test 34500. As the rally resumes, 35500 would be the next target.
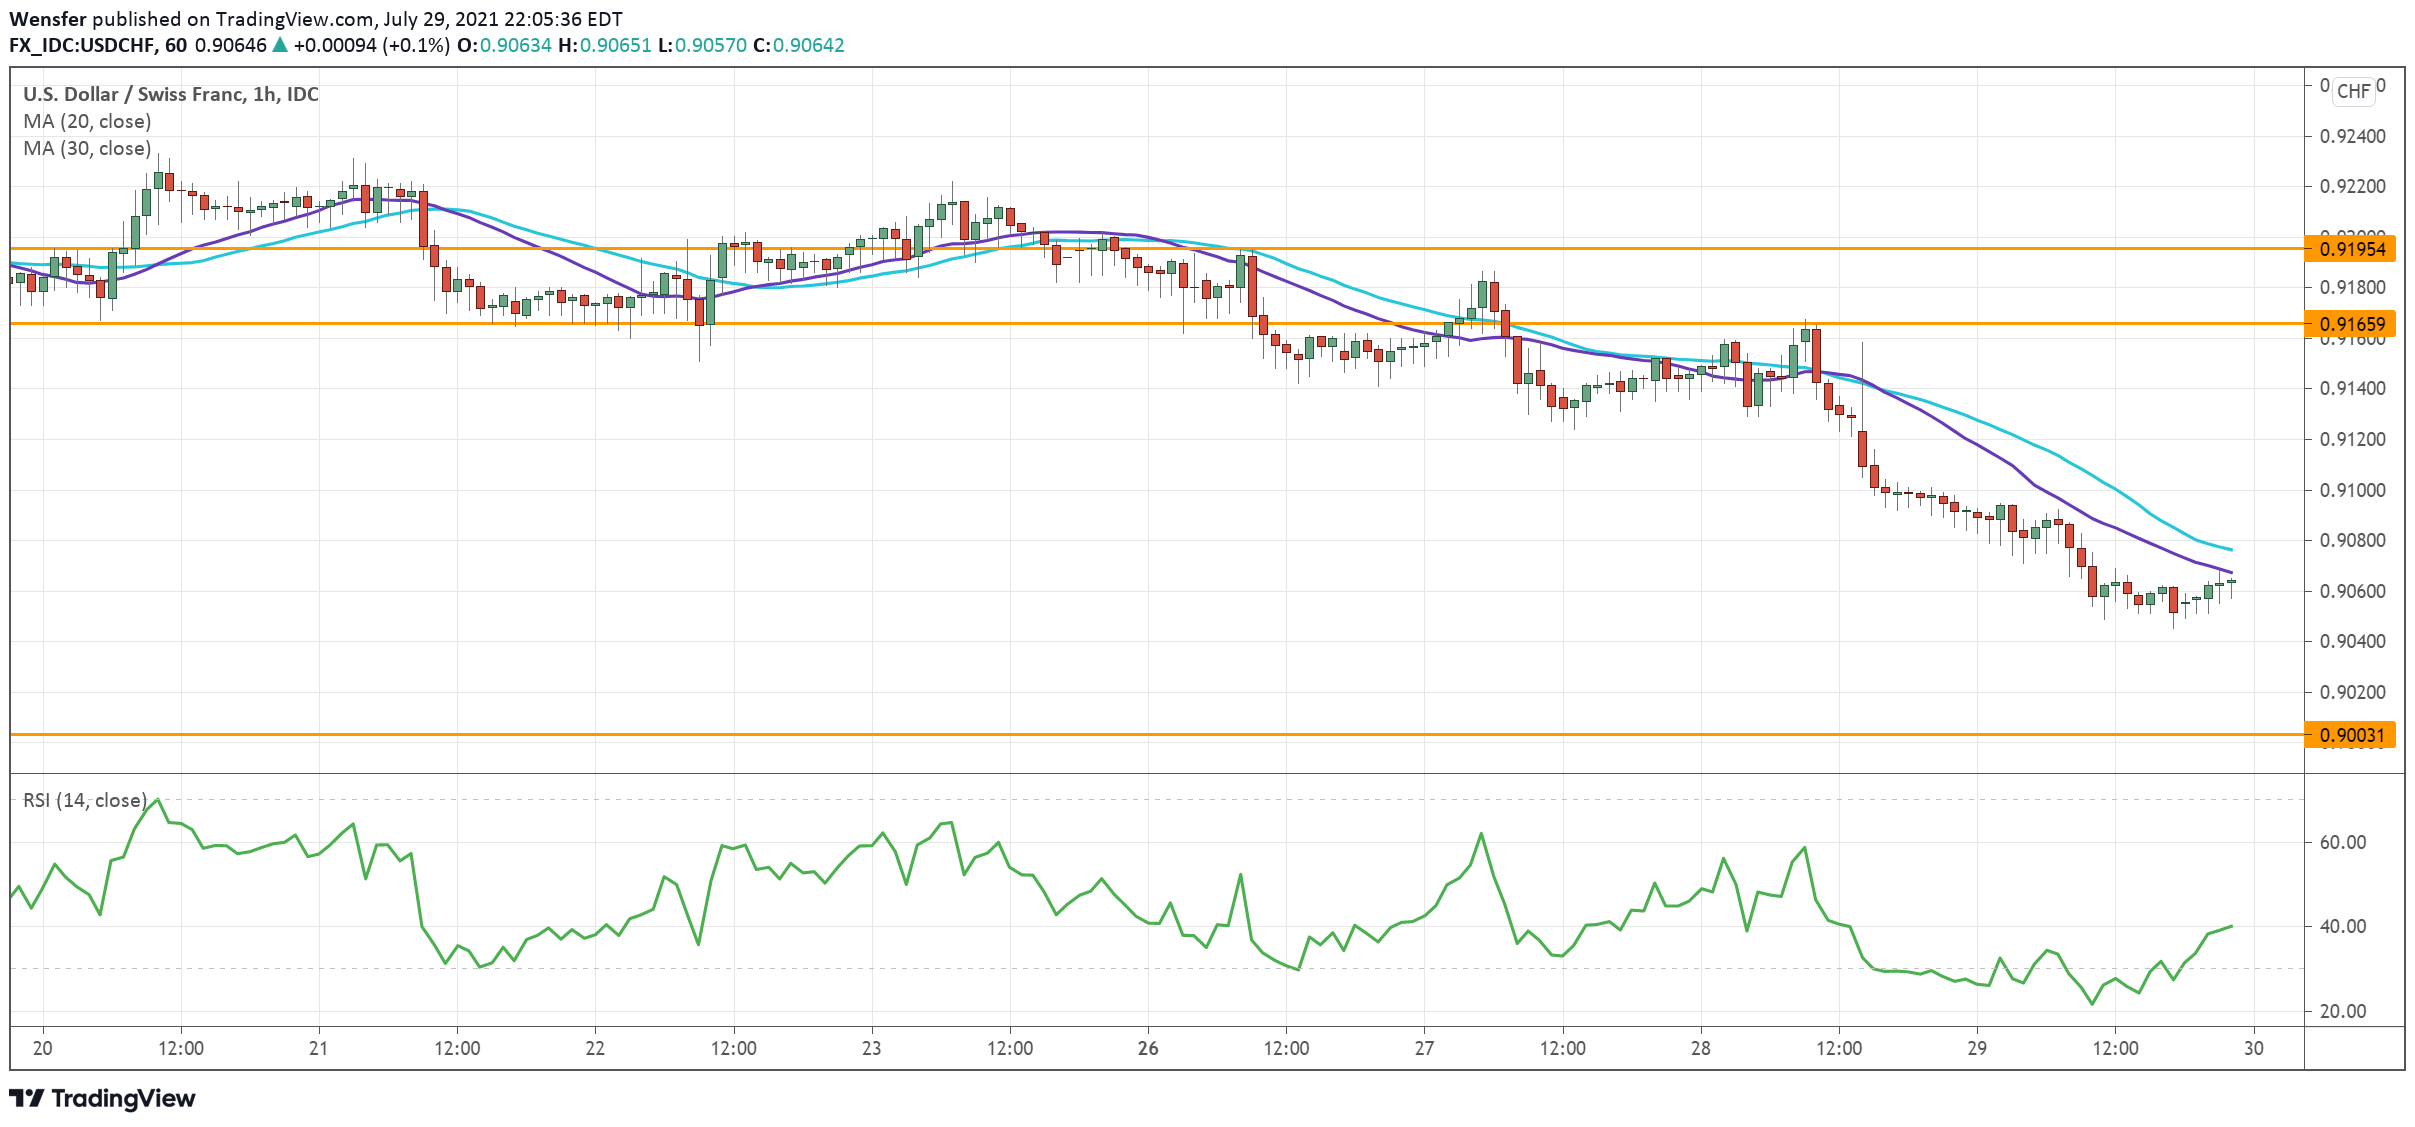
USD/CHF In A Deeper Correction
The US dollar tumbled as US GDP growth in Q2 came out below market expectation.
The breakout below 0.9120 was a confirmation that the bears have gained the upper hand following a three-week-long consolidation. Bearish sentiment accrued as momentum traders jumped in aggressively.
The price is heading towards the psychological level of 0.9000, right above the critical support (0.8930) on the daily chart.
An oversold RSI may cause a limited rebound which is likely to be capped by 0.9165.
USD/JPY Tests Key Support
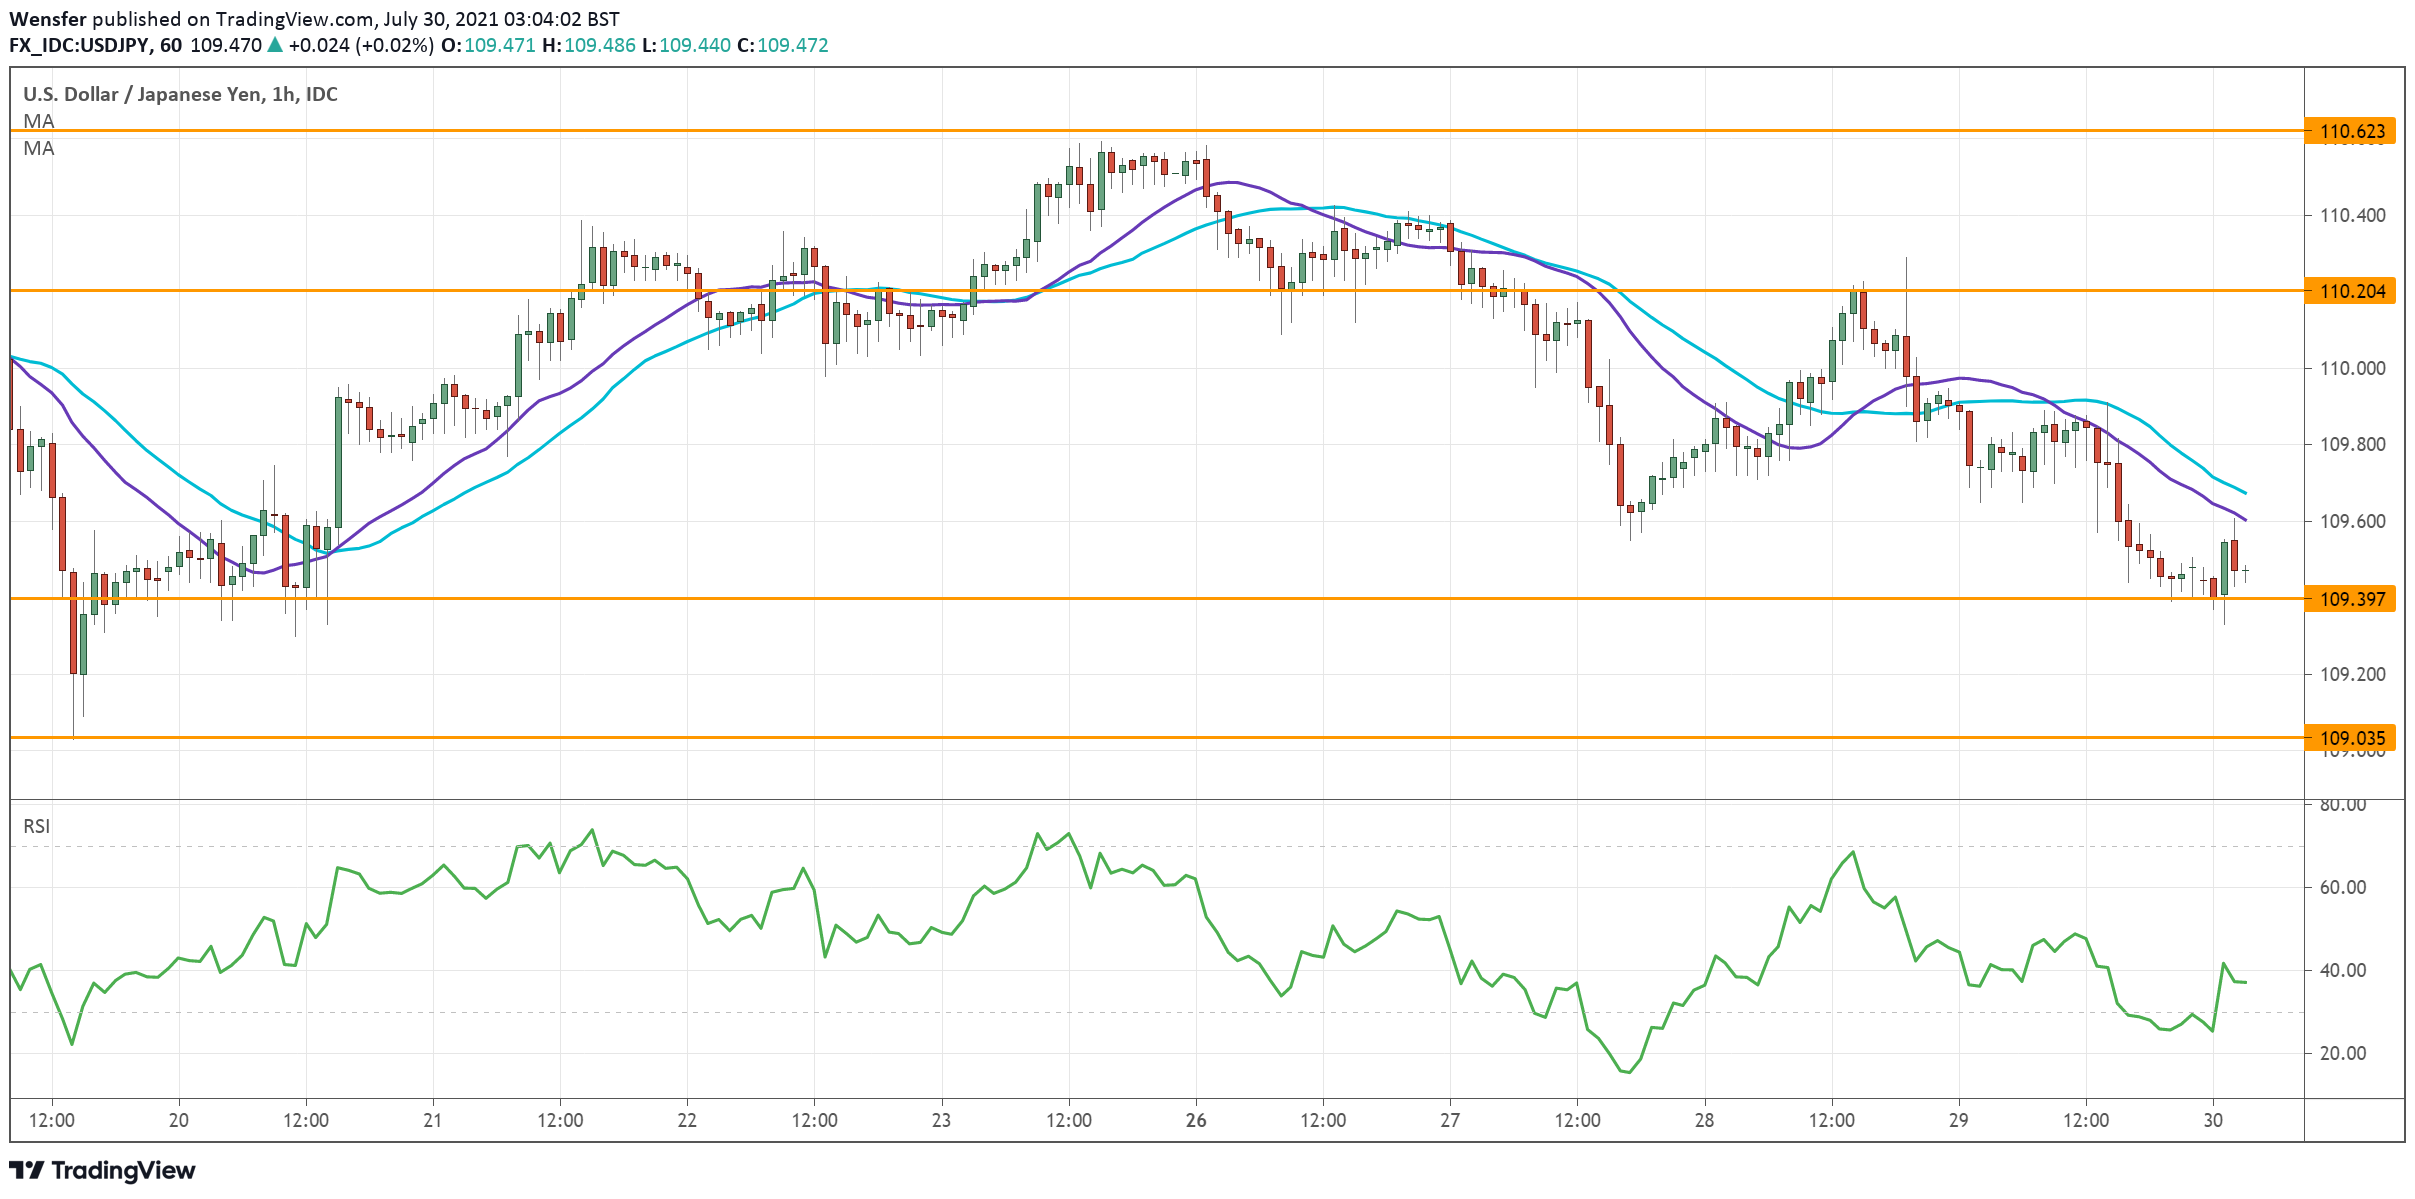
The Japanese yen finds support as June’s unemployment rate fell below 3%.
A bearish MA cross on the daily chart is likely to cloud buyers’ moods. The pair has met stiff selling pressure near 110.60.
The FOMC whipsaw was a sign that sellers still retain control since the downturn started earlier this month. 109.40 is key support and its breach would invalidate last week’s rebound. Sellers would then be eager to push below 109.00.
On the upside, a bounce will need to clear 110.20 to make the mood turn around.
Daily Tecnical Analysis
EUR/USD
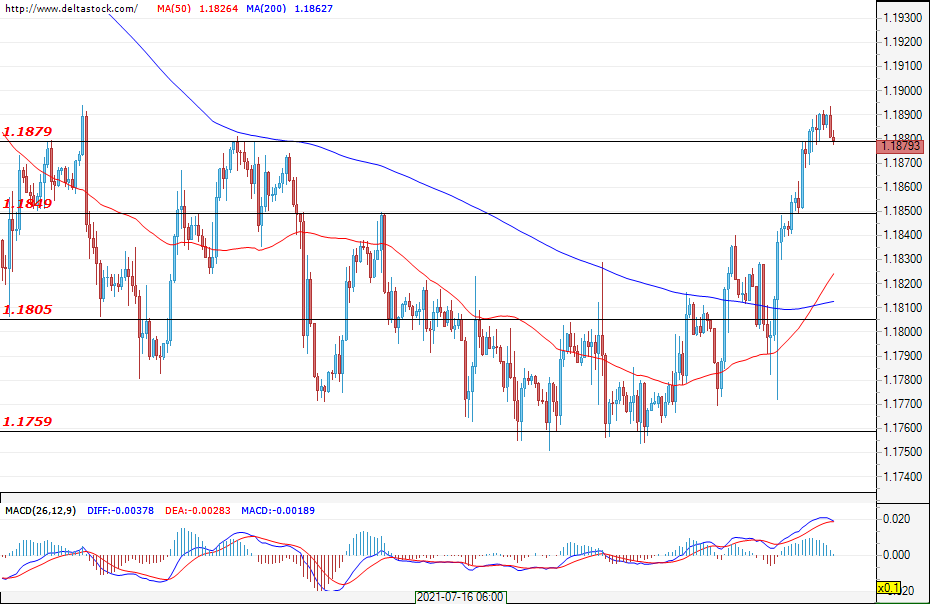
Current level - 1.1879
The market seems to be on an uptrend and higher consecutive highs and lows are already observed. We can expect a phase of consolidation around the current levels or a slight retracement in order to test the support in the area 1.1850-1.1830. The first support around 1.1879 has not yet been confirmed and may not be very reliable. The pair can form resistance in the zone around 1.1890-1.1900, and if the rally continues, we can expect an attack on the next zone around 1.1945. Today, the most significant news in the calendar that can increase the activity is the data on German GDP (08:00 GMT) and the preliminary consumer price index for the euro zone (09:00 GMT).
| Resistance | Support | ||
| intraday | intraweek | intraday | intraweek |
| 1.1890 | 1.1970 | 1.1879 | 1.1805 |
| 1.1945 | 1.2070 | 1.1849 | 1.1759 |
USD/JPY
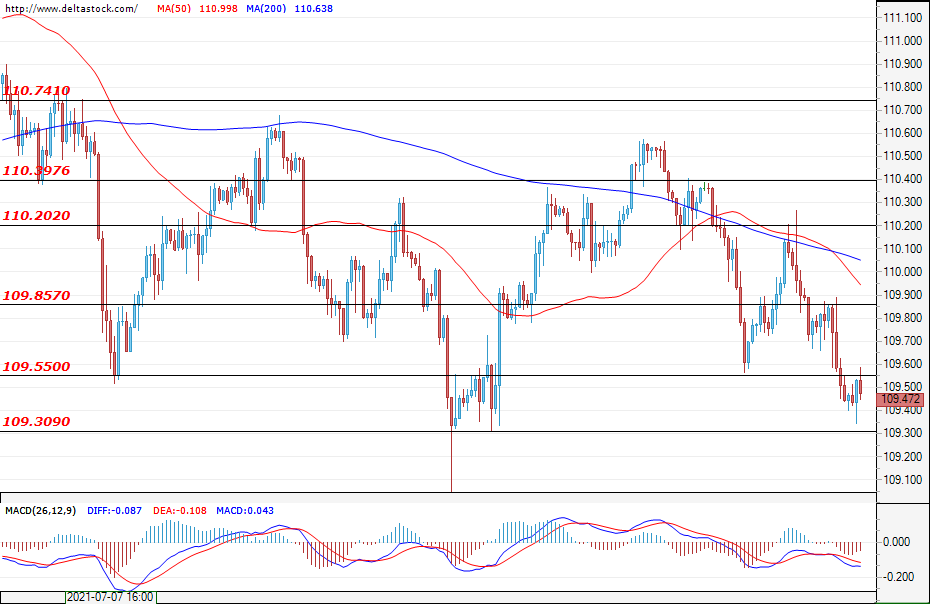
Current level - 109.47
The US dollar is losing ground against most major currencies, with prices on track to test the support around 109.30. Expectations are for the continuation of the downtrend and a potential attack of 108.50. First resistances for the bulls are 109.55 and 109.85. Given that 109.30 manages to withstand the bears’ attacks, it is possible to continue trading in the range of 109.30 and 110.60.
| Resistance | Support | ||
| intraday | intraweek | intraday | intraweek |
| 109.55 | 110.20 | 109.30 | 108.55 |
| 109.85 | 110.39 | 109.30 | 108.10 |
GBP/USD
Current level - 1.3950
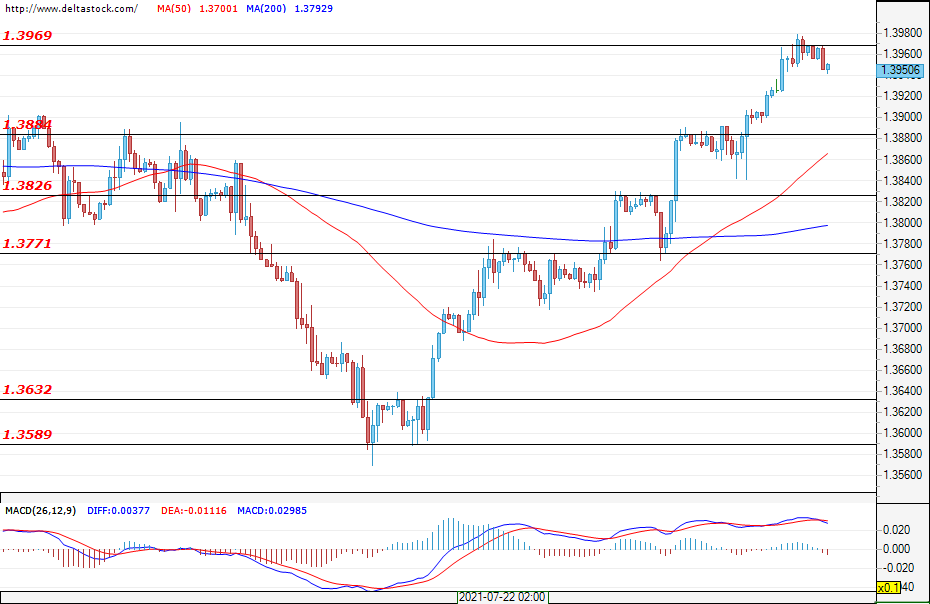
Observing the GBP/USD, we see a clear uptrend with strong momentum. It is possible for the market to test support at 1.3884 or for prices to consolidate around current levels, before the uptrend continues again. The first resistance is 1.3969, and if it is broken, the next target for the bulls will be the zone at 1.4000 or 1.4050.
| Resistance | Support | ||
| intraday | intraweek | intraday | intraweek |
| 1.3970 | 1.4060 | 1.3884 | 1.3771 |
| 1.4000 | 1.4115 | 1.3826 | 1.3630 |
GOLD Breaks 1,825.00 Resistance
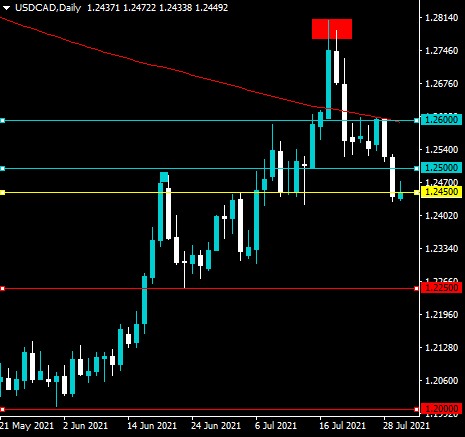
On Thursday, the yellow metal's price managed to pass the resistance of the zone that is located near the 1,825.00 mark. On Friday morning, the price confirmed the zone as support.
Meanwhile, the July high level zone has been marked on the chart. The zone provided resistance on Thursday and caused the most recent retracement back down.
If the price passes the resistance zone of the July high levels, eventually the metal could aim at the 1,850.00 mark. However, round price levels could slow down the surge.
However, a decline below the support zone near 1,825.00 could look for additional support in the 55, 100 and 200-hour simple moving averages at 1,815.00 and near 1,808.00.