Sample Category Title
Market Focus On US Inflation Data
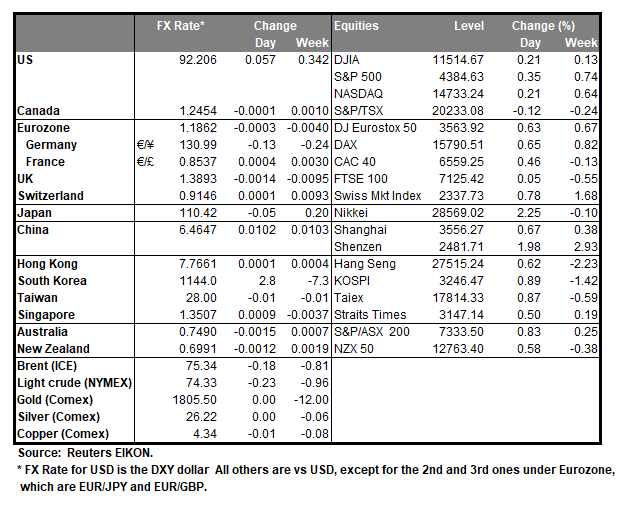
The greenback tended to edge higher against some of its counterparts yesterday amidst low volatility as market attention today turns to the release of the US inflation rates for July, as the headline rate is expected to slow down after reaching an almost 13 year high on a year on year level in May. Overall, should the actual rates differ from market expectations we may see the market reacting in an effort to reposition itself. Another earnings seasons for the US stockmarkets is upon us, hence we may see some of the market’s attention turning in that direction, lowering volatility for the forex market, and today we note the earnings releases of Goldman Sachs, JP Morgan as well as PepsiCo. On the monetary front we have a number of Fed officials which are scheduled to speak, while attention turns to Powel’s testimony tomorrow.
Despite an outbreak to the upside, the USD Index remained below the 92.30 (R1) resistance line yesterday and during today’s Asian session. We tend to maintain a bias for a sideways motion, yet we note that the RSI indicator below our 4-hour chart, is lower than the reading of 50 which may imply a slight advantage for the bears. Should the bears actually take over we may see the index breaking the 91.75 (S1) support line and aim for the 91.30 (S2) level. Should the bulls prevail, we may see index breaking the 92.30 (R1) resistance line and start aiming for the 92.75 (R2) level, which also notes the highest level in our chart which was reached on the 6th of July.
Is RBNZ hawkish enough?
During Wednesday’s Asian session we get from New Zealand RBNZ’s interest rate decision. The bank is widely expected to remain on hold at 0.25% and currently NZD OIS imply a probability of 95% for such a scenario to materialize. The bank is expected to express some confidence in its accompanying letter may even foreshadow the tapering of its QE program. Also, another scenario which is heavily being discussed among analysts is whether the bank will be proceeding with its first post pandemic rate hike in November this year.
Overall, we tend to see the risks related to the release as tilted to upside for the Kiwi, unless the bank fails to meet the market’s rather hawkish expectations, in which case we may see the Kiwi asymmetrically weakening.
NZD/USD seems to have stabilised around the 0.6985 (S1) support line, after correcting higher and given that the pair’s price action has broken the downward trendline guiding it. We tend to maintain a bias for a sideways motion currently yet RBNZ’s interest rate decision as well as the release if the US inflation rates for June, could affect the pair’s direction. Should buyers be in control of the pair’s direction, we may see it breaking the 0.7040 (R1) resistance line and aim for the 0.7095 (R2) level. Should the market display a selling interest for the pair, we may see it breaking the 0.6985 (S1) support line and aim for the 0.6935 (S2) level which was able to reverse the pair’s downward motion twice since mid-June.
Other economic highlights today and the following Asian session:
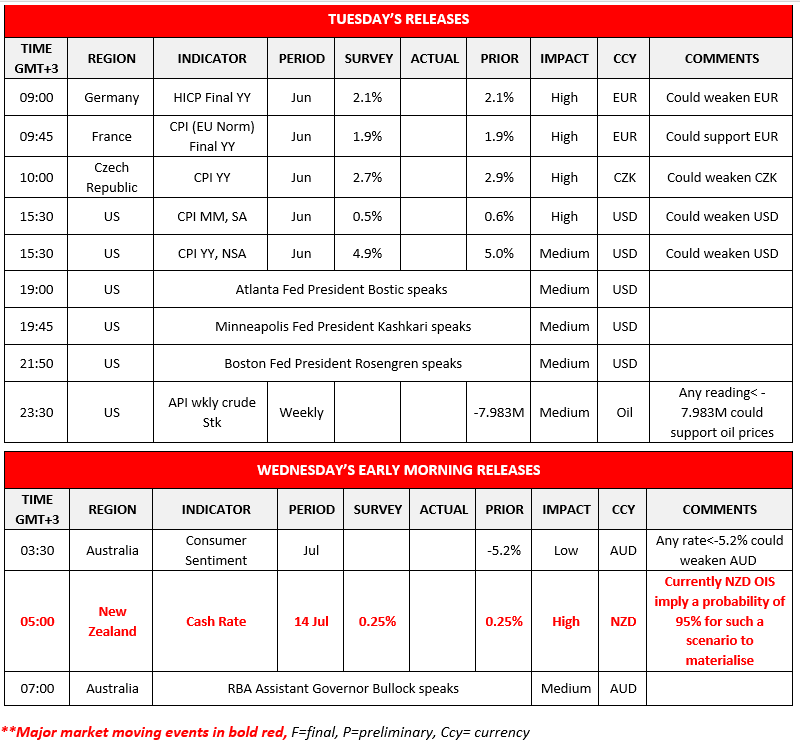
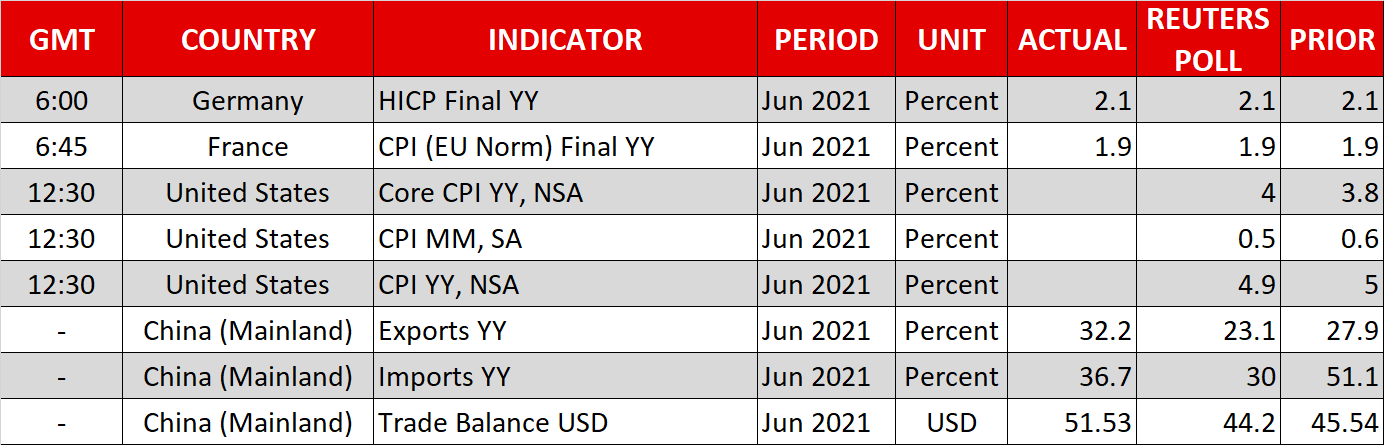
Today we note the release of Germany’s and France’s final HICP rates for June as well as the Czech Republic’s CPI rate for June. In the American session we get from the US the CPI rates for June and just before the Asian session starts we get the API weekly crude oil inventories figure. During Wednesday’s Asian session, before RBNZ’s interest rate decision, we get from Australia the consumer sentiment for July. As for speakers we note in today’s American session, Atlanta Fed President Bostic, Minneapolis Fed President Kashkari, Boston Fed President Rosengren which are scheduled to speak, while during Wednesday’s Asian session we get RBA Assistant Governor Bullock is also scheduled to speak.
USD Index H4 Chart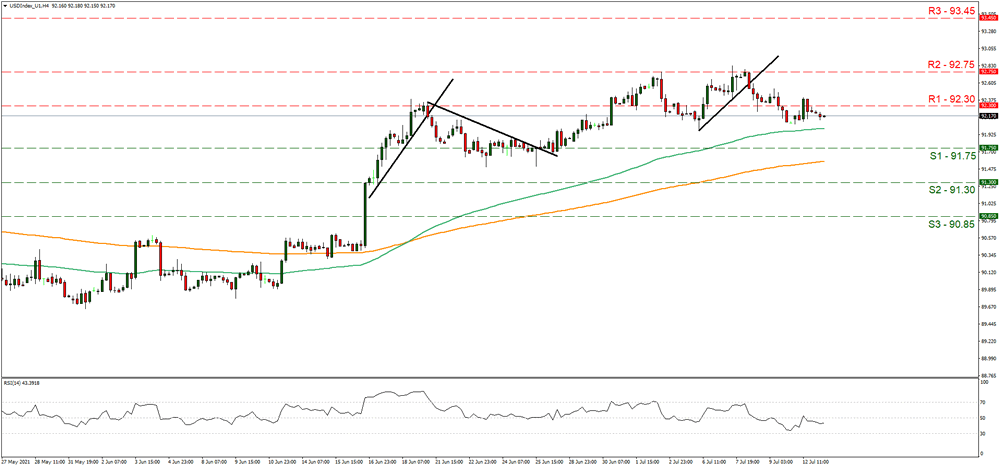
Support: 90.75 (S1), 91.30 (S2), 90.85 (S3)
Resistance: 92.30 (R1), 92.75 (R2), 93.45 (R3)
NZD/USD H4 Chart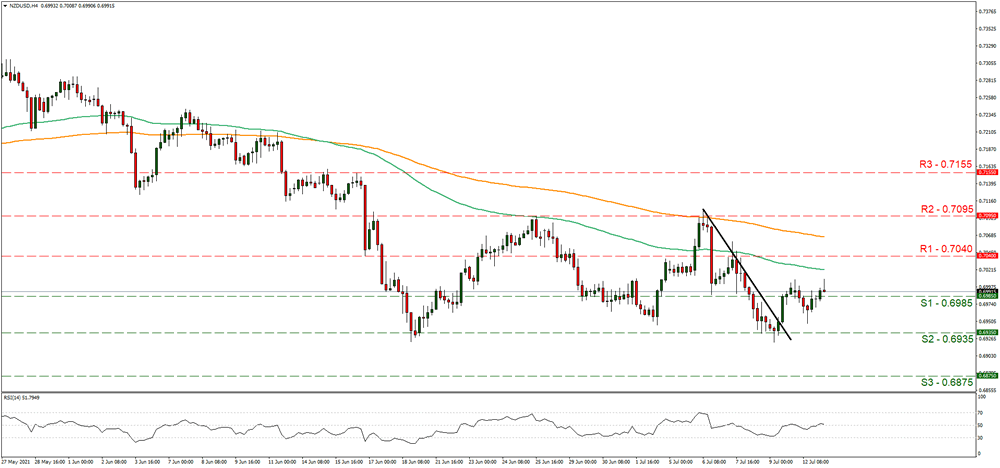
Support: 0.6985 (S1), 0.6935 (S2), 0.6875 (S3)
Resistance: 0.7040 (R1), 0.7095 (R2), 0.7155 (R3)
Wall Street Hits Record Before Earnings Kickoff, Dollar Holds Firm
- Earnings optimism drives US equities to fresh record highs ahead of bank results
- Risk appetite still shaky in FX markets, dollar and yen resist deeper selloff
- US inflation data and Powell testimony will be key in directing sentiment
Wall Street rallies as reopening boost eyed
It's the start of the second quarter earnings season and optimism is running high that the reopening of the US economy will power corporate earnings to new peaks. The new season will properly kick off today when JPMorgan Chase and Goldman Sachs report their results before the market open. More big bank earnings will follow in the coming days.
But there's already plenty of buzz on Wall Street that Q2 earnings will beat the consensus estimates on expectations that the vaccine-led recovery boosted companies' bottom lines as the reopening of the world's largest economy gathered pace. The three leading indices – S&P 500, Dow Jones Industrial Average and Nasdaq Composite – all closed at new all-time highs for a second consecutive day on Monday.
Tesla stocks (+4.4%) led the charge as the company rolled out a software update, adding full self-driving capabilities to paid subscribers.
E-mini futures tracking the three indices were trading slightly lower as European shares opened mixed on Tuesday. But Asian stocks had another strong session, lifted by better-than-expected trade figures out of China, which eased concerns about slowing growth.
Dollar, yields brace for US CPI and Powell
Reports that progress is being made in the US Congress on both the partisan and bipartisan bills of Biden's infrastructure plan may also be supporting sentiment in equity markets. But in the currency sphere, traders are mainly focused on this week's US data releases and Fed Chair Powell's congressional hearing on Wednesday.
Powell is unlikely to say anything that would rattle investors but nevertheless markets will be hypersensitive to any remarks that suggest tapering could begin soon. Ahead of Powell's appearance tomorrow, all eyes will be on the June consumer price index due today at 12:30 GMT.
Expectations for the headline CPI rate are for a reading of 4.9% y/y. However, there's probably a slightly greater risk of a weaker number this time, which could spark another spending spree into US Treasury bonds, sending yields tumbling again.
The 10-year Treasury yield stabilized late last week and has recovered to around 1.36%, holding steady during yesterday's auctions. But if yields were to dip again, it's unclear which way the US dollar would go following the recent breakdown of their positive correlation.
Kiwi crawls higher ahead of RBNZ
What is evident, however, is that riskier currencies have been struggling to make much headway against the greenback lately during both risk-on and risk-off days. Even the New Zealand dollar has been unable to capitalize on growing expectations that the RBNZ will raise rates as early as November this year.
The RBNZ is due to announce its latest monetary policy decision early on Wednesday and the kiwi could come under pressure if policymakers hint that they disagree with the markets' timetable for rate hikes.
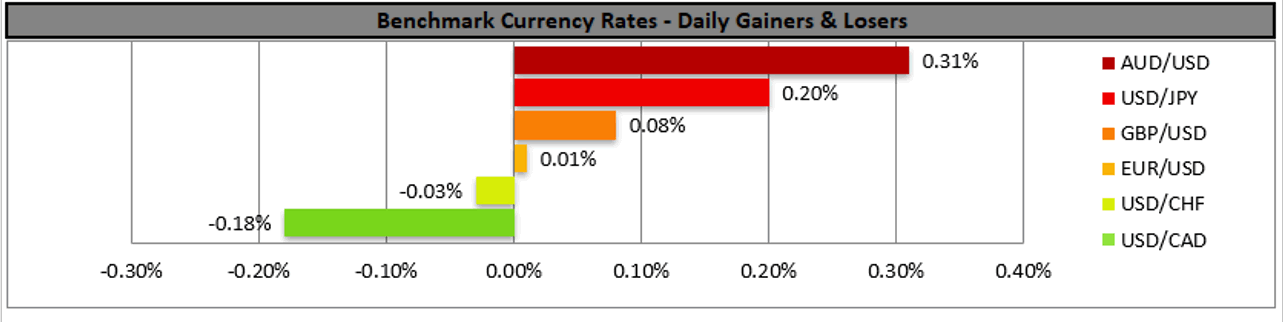
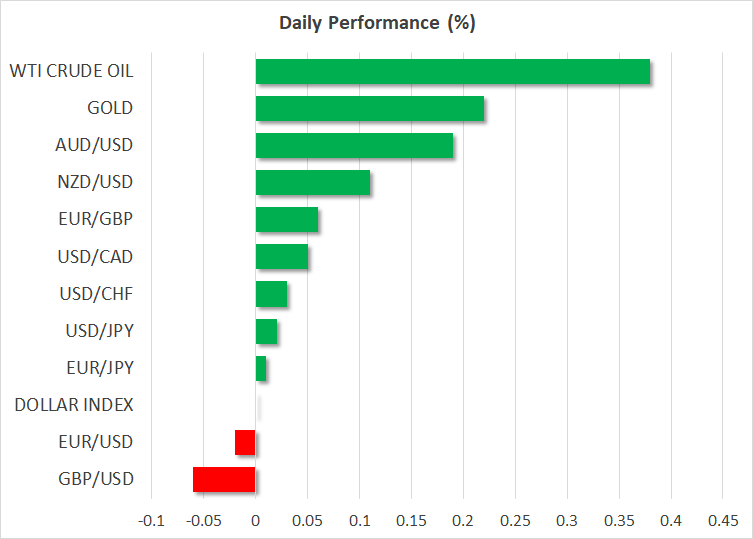
The US dollar was last trading slightly firmer against a basket of currencies but flat versus the safe-haven yen. The aussie and kiwi inched up against both the greenback and yen, while the euro and pound were weaker across the board.
In commodities, oil futures were trading about 0.8% higher despite no sign yet that Saudi Arabia and UAE are close to resolving their differences over how to ease the output restrictions. Gold, meanwhile, held within its recent range, hovering just above $1,800/oz.
NZ Dollar Breaks 70 But Retreats
New Zealand posted positive data on Tuesday, which lifted the New Zealand dollar, albeit briefly. NZD/USD crossed above the symbolic 70 line but was unable to consolidate these gains. Currently, NZD/USD is trading at 0.6987, up 0.15% on the day.
NZ dollar quiet ahead of RBNZ meeting
The New Zealand dollar received a brief boost from the Food Price index for June, which showed a strong gain of 1.4%. This was up sharply from the May reading of 0.4% and marked the strongest gain since February 2020. NZD/USD briefly pushed past the 70 level, which has been relevant throughout July.
The RBNZ holds its policy meeting early on Wednesday (2:00 GMT), and the New Zealand dollar is unlikely to show any significant movement ahead of the meeting. The bank is widely expected to maintain interest rates at 0.25%. At the May meeting, policymakers surprised the markets with a projection of raising rates to 0.49% in September 2022 and at least 1.78% in June 2024. The minutes of the May meeting emphasised that this forecast was conditional on the economy improving as expected, but the stance of the bank has clearly become more hawkish. Some analysts have gone even further, predicting a rate hike this November.
It will be interesting to see if the RBNZ rate statement refers to the resurgence of Covid. New Zealand’s Covid Response Minister Chris Hipkins has expressed his concern over the particularly in Australia, with New South Wales under lockdown due to an increase in Covid cases. The rise in cases of the Delta variant worldwide has hurt risk sentiment and could curb demand for the New Zealand dollar.
Attention will shift from the RBNZ to inflation, with New Zealand releasing Q2 CPI on Thursday. The consensus is a gain of 1.4% YoY, little changed from the first-quarter reading of 1.4%.
NZD/USD Technical
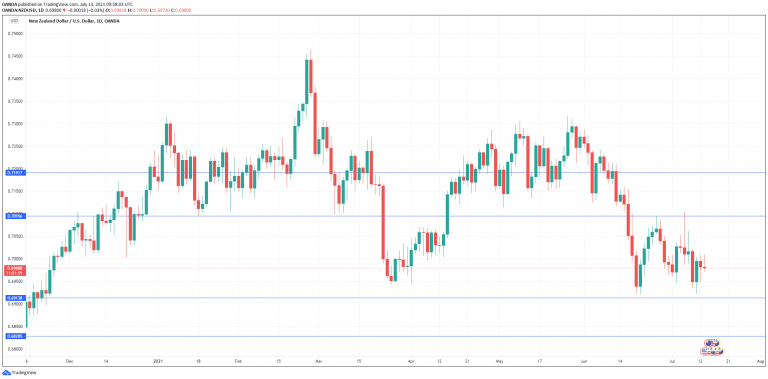
- There is resistance at 0.7095 earlier in the day. Above, we find resistance at 0.7191
- On the downside, the pair has support at 0.6913 which is protecting the round number of 0.6900. Below there is support at 0.6827
GBP/AUD 4H Chart: Bulls Could Prevail
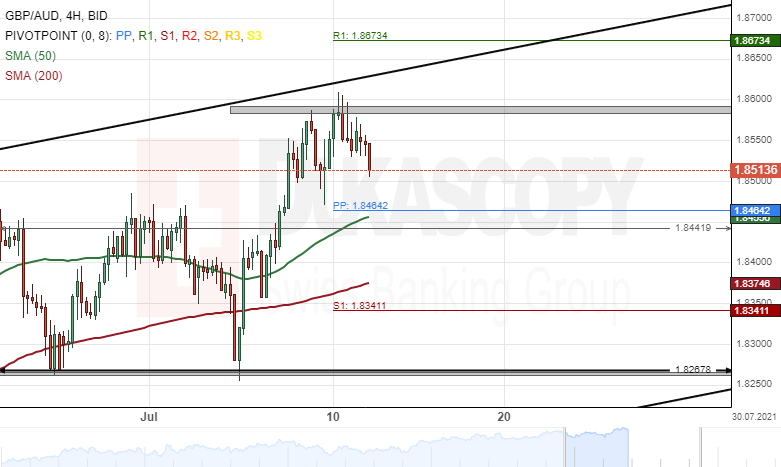
The British Pound has edged higher by 1.67% against the Australian Dollar since last week's trading sessions. The currency pair tested the 1.8600 mark on Monday, July 12.
Technical indicators suggest buying signals on the 4H, daily and weekly time-frame charts. Most likely, long traders could continue to drive the exchange rate higher during the following trading sessions.
However, the upper boundary of an ascending channel pattern could provide resistance for the GBP/AUD currency exchange rate within this week's trading sessions.
GBP/CAD 4H Chart: Breakout Occurs
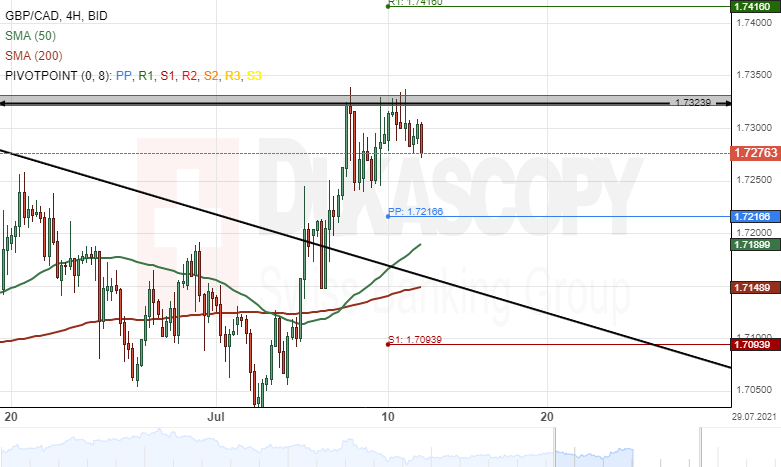
The Pound Sterling has surged by 1.70% against the Canadian Dollar since July 5. A breakout occurred through the upper boundary of a descending channel pattern during last week's trading sessions.
Given that a breakout has occurred, buyers are likely to continue to pressure the exchange rate higher during the following trading sessions. The potential target for the exchange rate will be near the 1.7550 area.
However, the resistance level at 1.7323 could still provide a barrier for the GBP/CAD currency exchange rate during this week's trading sessions.
Gold Analysis: Found Support Below 1,800.00
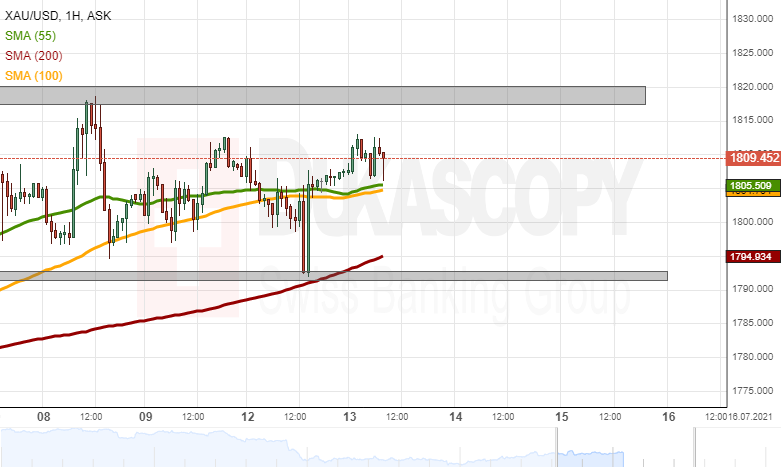
The yellow metal found support in the zone above the 1,790.00 level. Meanwhile, as the price was being approached by the 200-hour simple moving average, a recovery began. By the middle of Tuesday's European trading hours, the bullion had reached above 1,810.00.
A continuation of the surge of the yellow metal's price could encounter resistance in the zone below the 1,820.00 marks. A passing of the resistance zone could result in the price reaching the 1,850.00 marks.
On the other hand, a decline would find support in the 55 and 100-hour simple moving averages near the 1,805.00 level before looking for support in the 1,800.00 level and the 200-hour SMA near 1,795.00.
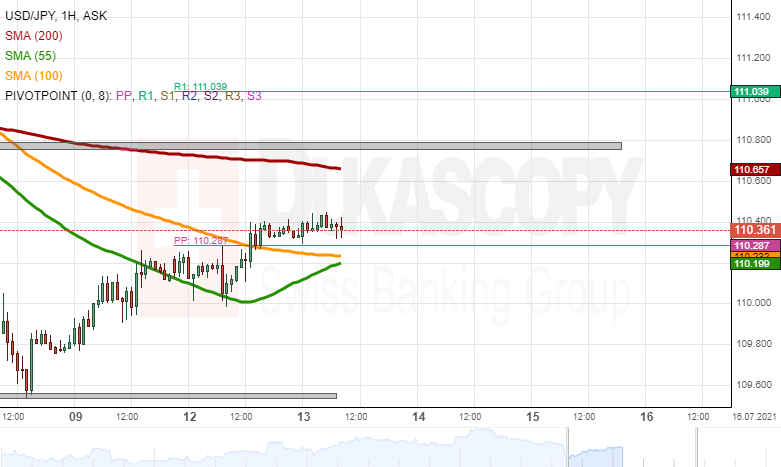
USD/JPY Analysis: Passes Resistance Levels
During Monday's trading, the USD/JPY broke the resistance of the 100-hour simple moving average and the weekly simple pivot point near 110.30. However, it did not result in an extended surge, as the currency exchange rate began to fluctuate sideways in the 110.30/110.50 range.
If the rate ends the sideways trading by surging, it would encounter resistance near 110.65 where the 200-hour simple moving average was located at. Above it, a zone below the 110.80 mark could provide resistance, as it had done previously in July.
On the other hand, a potential decline would find immediate support in the weekly simple pivot point at 110.29 and the 55 and 100-hour simple moving averages near 110.20. Below them, the rate could find support in the 110.00 mark.
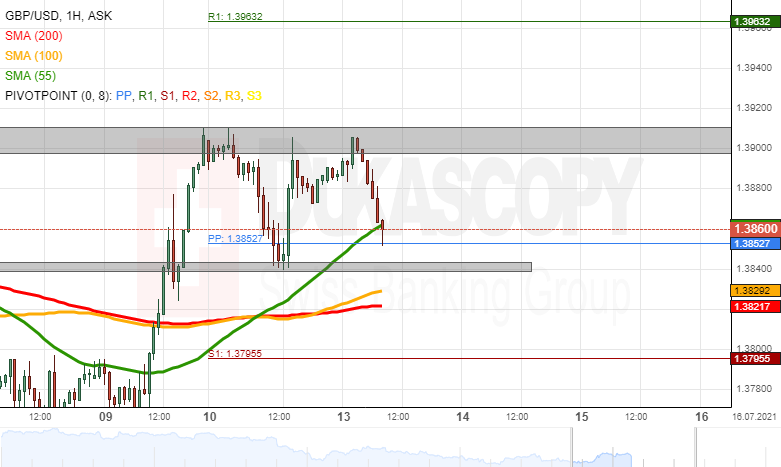
GBP/USD Analysis: Fails At Surging
On Tuesday, the GBP/USD made another attempt to pass the zone above the 1.3900 marks. In the meantime, the rate revealed on Monday that the zone near 1.3840 manages to provide support.
In the near term future, the pair could be pushed up by the support of the 55, 100, and 200-hour simple moving averages. A potential surge could once again test the resistance of the 1.3900 zones. A passing of the zone could result in the rate reaching the weekly R1 simple pivot point at 1.3963.
Meanwhile, a decline would look for support in the 1.3840 level, which reversed the pair's Monday decline. A decline below the 1.3840 marks could look first for support in the 100 and 200-hour SMAs. Afterward, the weekly S1 at 1.3796 could provide support.
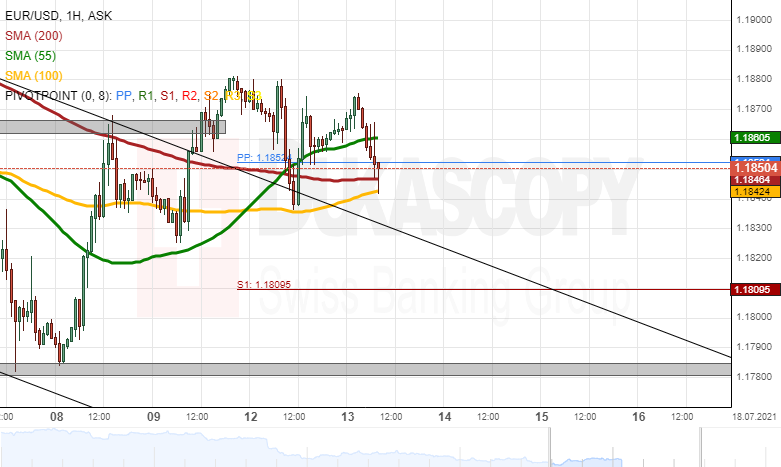
EUR/USD Analysis: Remains Below 1.1900
Despite not facing any technical resistance on Monday, the EUR/USD currency exchange rate did not surge. The pair's attempt at moving higher on the chart was stopped by the 1.1880 level. The rate made two attempts to reach above the 1.1880 level before declining and finding support in the 100-hour simple moving average.
On Tuesday, the currency exchange rate fluctuated below the resistance of the 1.1880 level and the support of the weekly simple pivot point at 1.1852.
In the case that the rate passes the resistance of the 1.1880 level, the EUR/USD could reach for the 1.1900 marks and afterward the weekly R1 simple pivot point at 1.1923.
On the other hand, a potential decline would look for support in the weekly simple pivot point at 1.1852 and the 100- and 200-hour simple moving averages.
EURJPY Price Bounce Struggles, Downward Correction Still In Command
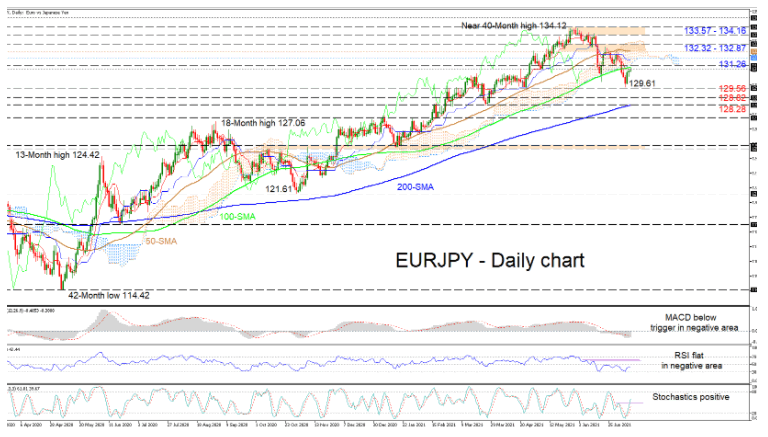
EURJPY is trading in the vicinity of the 131.00 handle and the 100-day simple moving average (SMA) but buyers’ traction off the 129.56 level seems to have run out of steam. The advancing 100- and 200-day SMAs are endorsing the broader positive structure, while the slight dwindling in the 50-day SMA’s incline is signalling that the retraction from the near 40-month high of 134.12 may be securing an edge.
The Ichimoku lines are hinting that negative momentum may soon pick up again, while the short-term oscillators are suggesting bullish forces could attempt to take the lead. The MACD, in the negative region, is improving and is looking set to push above its red trigger line, while the RSI is currently static in the bearish zone after rebounding off the 30 level. Moreover, the stochastic oscillator’s %K line is promoting additional price gains in the pair.
To the upside, buyers may face immediate resistance from the 131.00 hurdle until the 131.26 inside swing low. Prodding over this band of resistance that contains the 100-day SMA, buyers would then need to navigate above the Ichimoku cloud’s lower surface at 131.85 to tackle the resistance section of 132.32-132.87. Recapturing the area above this tough barricade is critical to reinforce positive belief and a test of the 133.57-134.16 limiting zone.
If the 131.00 border together with the 100-day SMA cap an extension of the recent bounce, sellers could encounter preliminary support around the 129.56 low. Should the 1½-month decline from the multi-year peak of 134.12 resume below the aforementioned low, the 128.82 obstacle may come into play before sellers target the 200-day SMA, residing at the March 24 trough of 128.28.
Summarizing, EURJPY’s broader outlook still holds a positive demeanour above the 129.61 low and the 200-day SMA. However, its near-term picture of lower highs and lows is strengthening a negative skewness below the 132.67 high and the cloud.