

Sample Category Title
CADJPY 86.00 Target
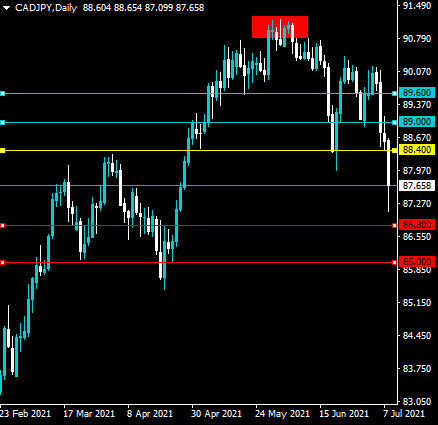
The Canadian dollar is still on the slide lower against the Japanese yen as the pair falls to levels not seen since late April this year. A bearish head and shoulders pattern has been activated and is currently suggesting further heavy losses in the short-term. According to the overall size of the bearish price pattern the CADJPY pair could drop towards the 86.00 support zone.
The CADJPY pair is only bullish while trading above the 88.40 level, key resistance is found at the 89.00 and the 89.60 levels.
If the CADJPY pair trades below the 88.40, sellers may test the 86.80 and 86.00 support levels.
XRPUSD Full Retest
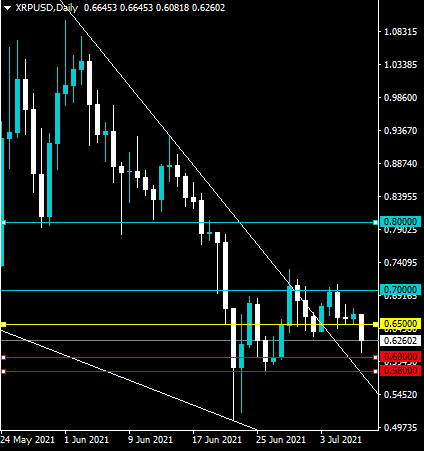
Ripple is on the slide again as Bitcoin and other altcoins come under wide spread selling pressure on the cryptocurrency market. The XRPUSD pair has recentyl broken above a falling wedge pattern and could be preapring to do a full retest of the former breakout area. Because the trendline from the wedge is declining the XRPUSD pair could even fall as low as the 0.5800 support zone.
The XRPUSD pair is only bullish while trading above the 0.6500 level, key resistance is found at the 0.7000 and the 0.8000 levels.
If the XRPUSD pair trades below the 0.6500 level, sellers may test the 0.6000 and 0.5800 levels.
USDCAD 200-Day Test
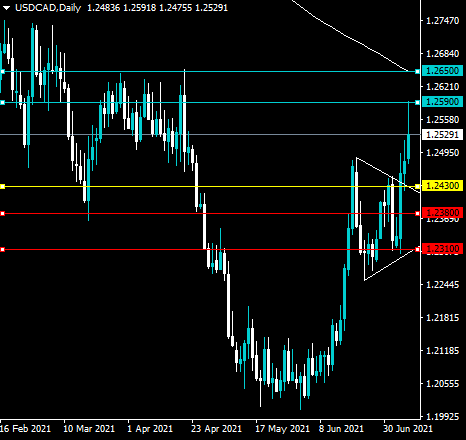
The US dollar is testing towards levels not seen since April this year against the Canadian dollar currency as the fall in oil prices continues to harm the Loonie. The USDCAD pair has recently broken above a symmetrical triangle pattern and could be preparing to test towards its 200-day moving average. According to the size of the triangle pattern an upside breakout of 200 points is possible.
The USDCAD pair is only bullish while trading above the 1.2430 level, key resistance is found at the 1.2590 and the 1.2650 levels.
If the USDCAD pair trades below the 1.2430 level, sellers may test the 1.2380 and 1.2300 levels.
Daily Tecnical Analysis
EUR/USD
Current level - 1.1835
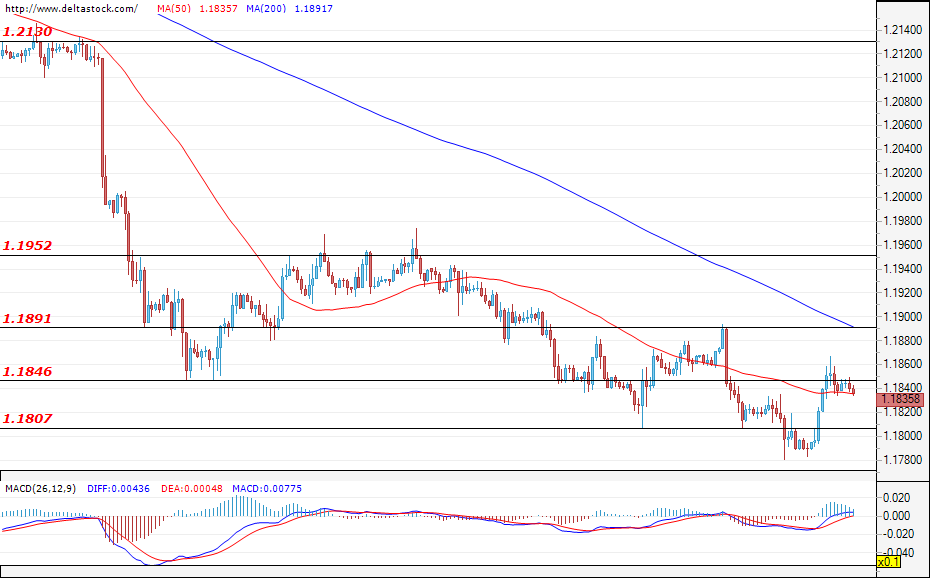
After the euro’s depreciation against the dollar during the previous sessions and the fleeting breach of the support at 1.1800, the bulls managed to limit the sell-off, which led to a correction. The consolidation around the level of 1.1846 could continue and a test of the resistance zone at 1.1891 is not excluded. Judging by the higher time frames, the negative expectations for a deeper sell-off are still intact and a move towards the support area at 1.1700 is still probable. There is no economic news foreseen today that could affect the currency pair's volatility, with the exception of the OPEC and G20 meetings.
| Resistance | Support | ||
| intraday | intraweek | intraday | intraweek |
| 1.1850 | 1.1950 | 1.1800 | 1.1750 |
| 1.1890 | 1.2130 | 1.1750 | 1.1716 |
USD/JPY
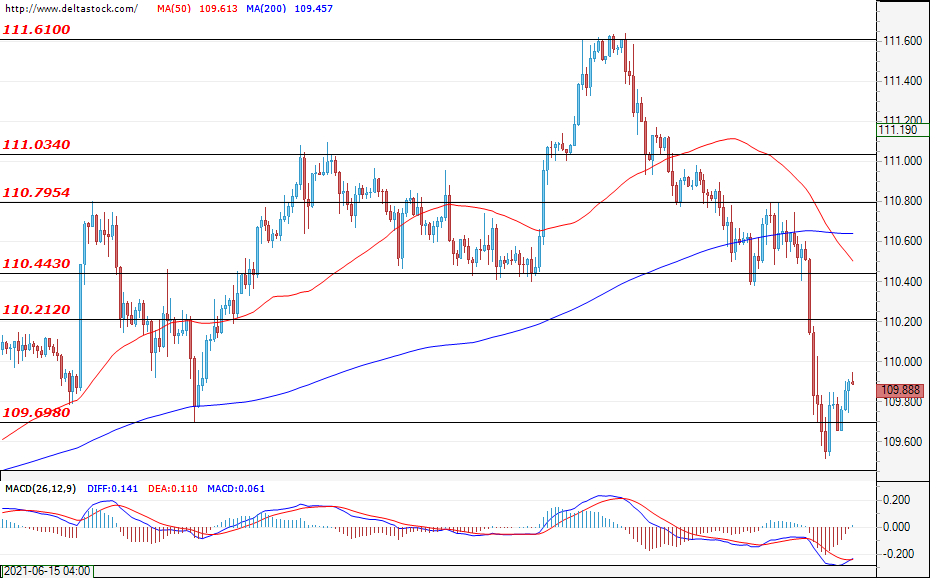
Current level - 109.88
After the euro’s depreciation against the dollar during the previous sessions and the fleeting breach of the support at 1.1800, the bulls managed to limit the sell-off, which led to a correction. The consolidation around the level of 1.1846 could continue and a test of the resistance zone at 1.1891 is not excluded. Judging by the higher time frames, the negative expectations for a deeper sell-off are still intact and a move towards the support area at 1.1700 is still probable. There is no economic news foreseen today that could affect the currency pair's volatility, with the exception of the OPEC and G20 meetings.
| Resistance | Support | ||
| intraday | intraweek | intraday | intraweek |
| 110.21 | 110.79 | 109.70 | 108.50 |
| 110.44 | 111.03 | 109.00 | 107.50 |
GBP/USD
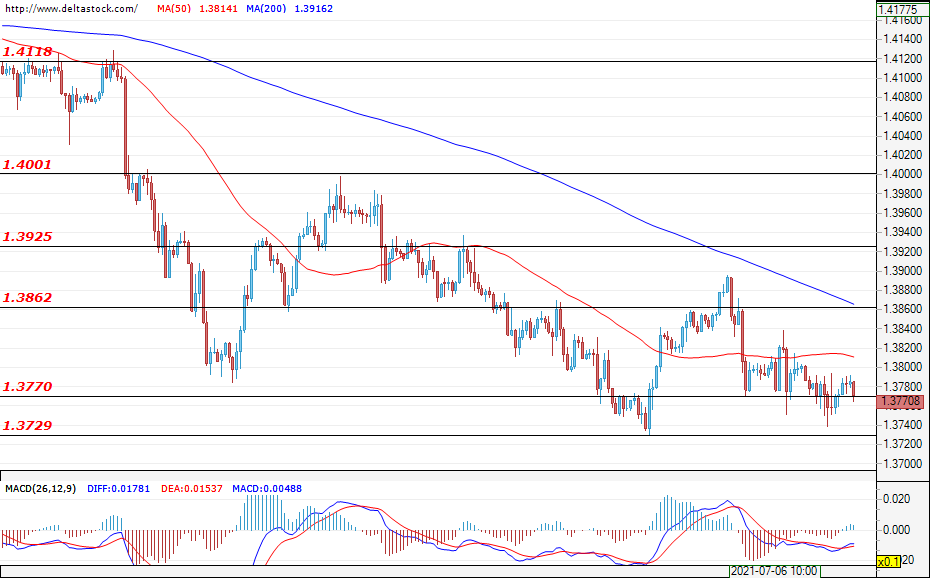
Current level - 1.3770
The consolidation around the support zone at 1.3770 continues and this might be the beginning of a range phase within the channel between 1.3729 - 1.3862. At the moment, neither the bulls nor the bears are able to gain enough momentum to establish themselves on the market and set a clearer direction. With the possible superiority of the bears and a successful breach of the support zone at 1.3670, it is possible to witness an additional sell-off and a reversal of the positive trend. Today, the data on manufacturing production in the UK (06:00 GMT) could affect the volatility of the currency pair.
| Resistance | Support | ||
| intraday | intraweek | intraday | intraweek |
| 1.3862 | 1.4000 | 1.3770 | 1.3660 |
| 1.3925 | 1.4118 | 1.3730 | 1.3610 |
Forbidden Fruit
The three major US indices closed Thursday’s session in the red, and most Asian indices traded south on Friday on rising Covid concerns after Japan released a state of emergency just two weeks before the start of the Olympic Games. There will be no spectator, but the games will happen according to the latest news. Here in Europe, it’s hard to believe that the cases are rising again, as the Euro2020 spectators are by thousands in the stadiums with no masks or visible distancing measures. So, it naturally raises some questions about the possibility of a Delta variant crisis knocking at the Europeans’ door as well.
EuroStoxx slid more than 2% on Thursday, closing the session below the 4000 mark for the first time in three weeks, while German industrial orders showed an unexpected slump in May, the worst recorded since the beginning of the pandemic due to weaker demand outside the Eurozone, hinting that the vaccine rollout may not help the European economies keeping their head above water in case of a renewed global contagion.
But activity on European and UK futures hint at a slightly positive start on Friday. Rebound in oil prices and weaker British pound could keep the FTSE 100 above the 7000p mark before the weekly closing bell. Yet the waning reflation winds will likely pressure the bank and energy-heavy blue-chip index to lag behind its US and European peers in the coming weeks.
Chinese tech stocks, on the other hand, continue feeling the pinch of the Chinese government crackdown. Alibaba dived below the $200 mark for the first time in more than a year, Didi lost another 5%. Chinese tech stocks are like the forbidden fruit. Foreign investors are dying to take a bite, but China commands them not to eat it.
But despite the discouraging Covid developments, there is no apparent reason for the US equity prices to come down significantly, or the bubble to burst, as the US yields remain comfortably on a fading path. The 10-year yield slumped below 1.30% this week, hinting that the Fed’s dot plot showing a steeper rate hike path, or the warnings of higher and longer inflation are no cause for concern with regards to the Fed policy. The market rhetoric is clearly shifting from transitory inflation to transitory recovery, and that’s probably what keeps the inflows in US treasuries elevated, combined with a seasonally low issuance of treasuries in July and Fed coming back to the market after the July 4 break. As such, falling treasury yields and rising equity prices is the most reasonable market reaction, although it’s worth noting that this time, the rising Covid concerns are also accompanied by rising Covid cases.
But you would agree that no analyst would dare giving a bearish call on the market right now, as the excess liquidity is what runs the show.
In commodities, gold has a solid rebound since the price dipped at $1750 end of June, and the price of an ounce tested the $1820 level yesterday. The plunging US yields explain a major part of the latest return to gold, as lower yields decrease the opportunity cost of holding the non-interest-bearing gold. Technical indicators hint that there is potential for a further positive push in gold prices at the current levels. The trend and momentum indicators turned positive at the beginning of this week and the relative strength index is still below the 50% mark, pointing that we are not close to a saturation on the buy side, yet. However, knowing how profitable the risk trades are, how long would investors remain seated on not-so-exciting gold is yet to be seen. The upside potential will likely remain capped into the 200-day moving average, near the $1830per oz, if there isn’t a significant bearish reversal in the US equity markets.
US crude, on the other hand, dipped below $71 mark this week, yet rapidly rebounded past $73 after the EIA data showed a further and a more severe-than-expected decline in US inventories last week. Comparing these numbers with the amount that OPEC+ is willing to unwind its production cuts by, meaning by less than half-a-million barrels, we have a clearer idea on what direction the price is headed. However, the chaotic situation at the heart of OPEC, the rising tensions between Saudi and the United Arab Emirates, the possibility of a nuclear deal between the US and Iran - which would throw an extra 4-to-6-million-barrel supply per day to the global mix, and the rising Covid cases will likely limit the upside potential in US crude near the $75-78 per barrel area. The downside potential depends on what happens on the OPEC front. The base case scenario is that OPEC countries will work out a solution and prevent oil prices from falling free. Therefore, oil bulls will likely remain in charge above the $70 mark, but we will hardly see the barrel of US crude surpassing the $80 mark until there is more certainty on the Covid news front.
Volatile Day In Financial Markets
Market movers today
- This morning, UK monthly GDP data for May are due out. We are looking for fairly strong growth due to the easing of restrictions.
- Today, the ECB minutes from the June meeting are due out. Besides that, BoE Governor Bailey and ECB President Lagarde appear on a panel discussion but the subject is digitalisation.
- G20 finance ministers and central bankers are meeting this weekend in Venice.
The 60 second overview
Markets. It has been a mixed picture in the financial markets as the new variants of the Covid-19 virus are seen to pose a threat to the economic recovery. Hence, we have seen a decline in global equity prices, but bond yields stabilised yesterday after having rallied for several days. Yesterday, 10Y Treasuries fell to 1.25% before bouncing back above 1.30%, the rally in the US Treasury market is driven by the long end and yesterday the 30Y US Treasury yield was below 1.90%, which is the lowest level since February.
Oil prices: The oil price continues to decline on the back of the feud within OPEC+ and the impact from Covid-19 variants and despite solid demand for oil as well as a decline in US stockpiles of oil. OPEC+ has still not made a deal on how to raise production, and there is no indication of when a deal is reached.
ECB update: ECB yesterday announced the outcomes of its long-awaited monetary strategy review. Going forward the ECB will define its price stability objective as a simple symmetric 2% inflation target over the medium term defined by HICP. This implies a more flexible and less aggressive inflation targeting regime than the Fed's average inflation targeting, by tolerating, rather than targeting an inflation overshoot. We do not expect the new symmetric inflation target formulation to have much implication for monetary policy in the short- to medium-term, explaining the muted market reaction to the announcement. As the ECB strategic review resulted neither in the development of new monetary policy tools that could foster the achievement of the inflation target, nor changed its explicit target variable of HICP inflation at 2%, we do not see the probability of ECB meeting its inflation objective altered by the strategic review (read more in Flash: ECB Research - Strategic Review: Striving for symmetry, 8 July).
Equities: What looked like a muted trading dag evolved to complete risk off in Thursday markets, albeit easing slightly in the late hours of trading. Bottom line - equities lower and volatility exploding (up 25% before returning below 20 again). The initial sell-off was broad based between value vs growth, with defensives the relative outperformer (although everything lower). The US session turned out to be more of a rates play, with consumer discretionary, real estate and utilities holding up best. Banks were the worst performer, down 2-3% across markets. This morning things seems to have calmed down with US futures indicating only small declines. Asian markets are broadly lower though, especially in Japan caught in a double whammy of new restrictions and growth rotation.
FI: It was a bit of a volatile day yesterday as bond yields initially declined, but later in the afternoon began to rise again. Hence, 10Y Treasuries was down to 1.25% before moving back up above 1.30%. The flattening pressure continues on the US curve and it is bullish flattening as 2Y-10Y has flattened more than 40bp since late March.
FX: For FX, the focus yesterday was naturally on the sell-off in equities. Commodity currencies and Scandies alike weakened on the back of this.
Nordic macro
Norway: In Norway we still anticipate a gradual decline in inflation as a result of base effects and a stronger krone. We forecast unchanged core inflation of 1.5% y/y in June, but with some upside risk if there is a correction after the surprisingly large drop in prices for furniture and household items in May.
Equities Trade Generally Lower After Weaker US Session
General trend
- US equity FUTs have remained modestly lower.
- Financials trade generally lower amid decline in 10-year gov’t bond yields.
- Nikkei 225 is off of the session lows, index had declined by over 2.4% [Export sensitive cos. decline after recent drop in USD/JPY; Softbank weighs on the Topix Information and Communication index; Marine Transportation index drops >4%].
- Shanghai Composite declined during the morning session [Consumer Staples and Liquor names underperform; Other decliners included Financials, Industrials and IT; Materials index supported by guidance from Wanhua Chemical].
- Hang Seng has moved between gains and losses [TECH index has remained volatile].
- S&P ASX 200 has dropped over 1.4% [Financials decline; Consumer indices drop amid more strict virus measures in Sydney].
- Nanya Technology may report earnings later today.
- UST yields rise in Asia after prior decline.
- AUD and NZD extend declines amid lower yields and drop in equities.
- Companies due to report during the NY morning include Greenbrier.
Headlines/Economic data
Australia/New Zealand
- ASX 200 opened flat.
- (AU) New South Wales Premier: Sydney has imposed stricter coronavirus measures in already locked down areas.
- (AU) Reserve Bank of Australia (RBA): Excess cash at exchange settlement (ES) accounts at A$329.7B v A$328.1B prior (record high).
- (NZ) New Zealand Jun ANZ Truckometer Heavy M/M: +1.2% v -6.2% prior.
- (NZ) Reserve Bank of New Zealand (RBNZ) offers to buy a total of NZ$200M in government bonds next week under QE program v NZ$200M prior.
China/Hong Kong
- Hang Seng opened -0.1%, Shanghai Composite -0.4%.
- (CN) CHINA JUN CPI M/M: -0.4% V 0.0%E; Y/Y: 1.1% V 1.3%E; PPI Y/Y: 8.8% v 8.8%e.
- (CN) Said that the US is set to add additional China companies to Blacklist due to human rights issues in Xinjiang and use of surveillance, could make announcement on July 9th (Fri); at least 10 additional cos. could be added to the list [no specific cos. were mentioned] - financial press.
- (CN) China Ministry of Commerce (MOFCOM): Expects retail sales during 5-year plan to increase ~5.0% per year; Trade and goods ~2.0%/year; To explore setting up trade friction comprehensive pilot zone; To improve unreliable entity list system.
- (CN) China's Cyberspace Administration which reports directly to Chinese President Xi Jinping, will be in charge of policing overseas listings going forward – WSJ.
- (CN) China Banking Regulator (CBIRC) says internet fees are leading to higher financing costs - Chinese press.
- (CN) China PBOC Open Market Operation (OMO): Injects CNY10B in 7-day reverse repos v CNY10B in 7-day reverse repos prior; Net CNY0B v Net CNY0B prior.
- (CN) China PBOC sets Yuan reference rate: 6.4755 v 6.4705 prior.
- (CN) China Ministry of Finance (MOF) Sells 3-month bills and 30-year bonds: Sells 30-year bonds: avg yield 3.5736% v 3.55%e.
Japan
- Nikkei 225 opened -1.4%.
- (JP) Nikkei 225 Jul Options to settle at 27,726.
- (JP) Japan Jun M2 Money Supply Y/Y: 5.9% v 6.0%e; M3 Money Supply Y/Y: 5.2% v 6.8% prior.
- (JP) BOJ seen cutting its FY21/22 (current year) GDP growth forecast at its upcoming quarterly update [due on Fri Jul 16th] - financial press.
- (JP) Japan PM Suga confirms new State of Emergency for Tokyo area; effective from July 12th thru Aug 22nd; always have economic stimulus in mind [from Jul 8th].
Korea
- Kospi opened -0.2%.
- (KR) South Korea reports 1,316 additional coronvirus cases (record high).
- (KR) South Korea said to be increasing social distancing in Capital Seoul to highest level [level 4] starting July 12th; the measures will be effective for 2 weeks - Press (In line).
- (KR) South Korea sells 50-year bonds: Avg yield 2.060% v 2.165% prior.
North America
- (US) NY Fed: Announces termination of commercial paper funding facility (CPFF).
Europe
- (UK) UK Treasury said to have insisted that Brexit settlement has remained within previous range of £35-39B - FT.
Levels as of 01:20 ET
- Nikkei 225, -0.7%, ASX 200 -1.4% , Hang Seng +1%; Shanghai Composite -0.3% ; Kospi -1.3%.
- Equity S&P500 Futures: -0.1%; Nasdaq100 -0.1%, Dax +0.3%; FTSE100 +0.2%.
- EUR 1.1850-1.1834 ; JPY 109.96-110.08 ; AUD 0.7444-0.7409 ;NZD 0.6975-0.6922.
- Gold +0.2% at $1,802/oz; Crude Oil +0.1% at $73.00/brl; Copper +0.5% at $4.2893/lb.
Fed Daly: We’re not through the pandemic, just getting through
San Francisco Fed President Mary Daly said in an FT interview, "I think one of the biggest risks to our global growth going forward is that we prematurely declare victory on Covid." She emphasized, "we are not through the pandemic, we are getting through the pandemic."
"If the global economy . . . can't get . . . higher rates of vaccination, really get Covid behind, then that's a headwind on US growth," Daly said. "Good numbers on the vaccinations are terrific, but look at all the pockets where that isn't yet happening."
On stimulus withdrawal, she said, "we're ready to taper at the appropriate time." But she added, "then I'd like to see, how is that going? How does the economy respond to that? Because we can forecast, we can project, but we need to know in order to actually say, 'oh, OK, now it's time to move on to the next phase', which is discussing policy normalization and the fed funds rate coming up a bit."
Cliff Notes: Diverging Policy Expectations
Key insights from the week that was.
In a week where first-tier data was largely absent, the focus remained on policy makers, particularly the RBA.
At their July meeting, as widely anticipated, the RBA confirmed that the April 2024 bond would remain the target for Yield Curve Control instead of extending it to the November 2024 bond. The Board also met our expectations for QE by announcing that a weekly purchase target will replace the 5-month $100bn program which is set to end in September. What surprised however was that the RBA decided to taper purchases as the change in program takes effect, with purchases to occur at a $4bn per week pace instead of $5bn, the effective weekly pace of the current program. The scale of purchases will be next assessed in November 2021. We believe that purchases will continue beyond this date to mid-2022, albeit with repeated reductions in scale.
Our forecast that RBA rate hikes will come in 2023 rather than 2024 is supported by the above developments as well as the slight change in language in the Governor’s decision statement on the conditions for rate hikes being met, with June’s “This is unlikely to be until 2024 at the earliest” replaced by “The Bank's central scenario for the economy is that this condition will not be met before 2024”. This change highlights both the greater momentum seen to date as well as upside risks to the RBA’s central scenario.
Still, in the subsequent press conference and Thursday’s speech on the labour market, Governor Lowe made clear the bar to raise rates is high. As discussed by Westpac Chief Economist Bill Evans, in the press conference the RBA Governor highlighted that, to raise rates, inflation must be sustainably in the 2-3%yr target range. To achieve this, the RBA see wage growth above 3.0%yr as necessary. And, for that to occur, full employment needs to be achieved and held – this equates to an unemployment rate in the “low 4’s”.
Westpac expects an unemployment rate of 4% by mid-2022 and inflation in the target range from that point on. To us then, the conditions for rate increases will be met by 2023.
Our New Zealand team was also focused on the monetary policy outlook this week, revising their expectations for the RBNZ to include rate hikes from November this year. The cost and labour pressures faced by NZ because of global supply disruptions and closed borders are well known; but there is now growing evidence of strong demand coming through, increasing the risk of more enduring price pressures.
Further afield, we also received guidance this week from the US FOMC and Europe’s ECB Governing Council.
In the minutes of the June FOMC meeting was clear evidence of growing confidence in the immediate outlook for growth and the labour market. That perceived strength has also clearly fostered a belief that underlying inflation will strengthen sustainably to target, justifying lift-off for rates, albeit not until 2023 on the Committee’s median expectation.
Westpac expects FOMC rate hikes to come earlier, beginning in December 2022. However, unlike prior cycles, we believe this cycle will end with the fed funds rate more-or-less at its neutral level, which we hold to be 1.625%.
This comparatively low endpoint coupled with the length of the cycle will keep term interest rates in check. As outlined by Chief Economist Bill Evans, we now see both the US and Australian 10-year yields peaking at 2.3% halfway through the FOMC/ RBA tightening cycles. A positive spread to cash will be seen thereafter for the 10-year yield in each jurisdiction, with both the US and Australian economies comfortably growing at trend and inflation at target from 2024.
This week also saw the release of the ECB's long-awaited policy review. The Governing Council did not quite go as far as the market had hoped with their inflation target, moving to a symmetric 2.0%yr target rather than a FOMC-inspired ‘average 2.0%yr’ benchmark. But this is still more accommodative than the current ‘close to, but below, 2.0%yr’ threshold.
While subtle, these differences in policy objectives amongst key central banks are likely to materially impact their decision making and hence FX markets as rate hike cycles begin from 2023. This is a topic we take up in the Global FX page of our July Market Outlook, to be released later today.
Market Morning Briefing: Dollar-Yen Has Immediate Support Near 109.50
STOCKS
Strong sell-off in equities following the sharp fall in the US yields over the last couple of days. The indices have room to fall further to test their crucial supports. Dow has declined below 34500 and can test 34000-33500. DAX looks vulnerable to break 15400 and extend the fall to 15200-15000. Nikkei has broken below the crucial support level of 28000 and is now bearish to test 27000-26000. Shanghai can break the 35000-3625 range on the downside and fall to 3450-3400. Sensex and Nifty can test the lower end of their 52000-53000 and 15600-15900 range. A downside break of this range will then bring the broader 51000-53000 (Sensex) and 15400-15900 (Nifty) range into play.
Dow (34421.93, −259.86, -0.75%) recovered well after falling sharply from the low of 34154.59 but had closed below 34500. The chances of seeing an immediate break above 35000-35100 is getting reduced. While below 34500, a further fall to 34000 and even 33500 cannot be ruled out in the coming days.
DAX (15420.64, −272.07, -1.73%) has declined sharply below 15600 and looks vulnerable to break 15400 and fall to 15200. A break below 15200 can drag it to 15000 and even 14800 thereafter. The price action at 15200 will need a close watch in the coming sessions.
Nikkei (27473.21, −644.82, -2.29%) has tumbled below the crucial support level of 28000. A test of 27000 can be seen now and a break below it can see the fall extending to 26000 in the coming days. Nikkei will now have to bounce back above 28000 to ease the downside pressure.
Shanghai (3503.41, −22.10, -0.63%) broke below3500 and has bounced from the low of 3485. However, the bias is bearish to see a further fall towards 3450 and even 3400. As mentioned earlier, 3450 and 3400 are strong long-term supports from where a fresh rise is possible to keep the broader uptrend intact.
Sensex (52568.94, −485.82, -0.92%) and Nifty (15727.90, −151.75, -0.96%) have declined sharply and can test the lower end of their 52000-53000 and 15600-15900 range respectively. A downside break of this range will bring the broader 51000-53000 (Sensex) and 15400-15900 (Nifty) range into the picture and drag the indices further lower. The price action at 52000 (Sensex) and 15600 (Nifty) will need a close watch today.
COMMODITIES
Crude prices have risen slightly but look bearish to ranged while below crucial resistance levels. Gold trades above 1800 and could head towards 1820-1840 while Silver looks stable and could trade within 25.80-26.50-27.00 region for the medium term. Copper is ranged within 4.20-4.40 and may continue so for a few more sessions.
Brent (73.89) and WTI (72.81) have risen slightly after a sharp decline seen over the last 2-sessions. While below 74, Brent has lesser scope to bounce back towards $80 and instead we can expect a dip down towards $70-68 in the coming sessions.WTI on the other hand could also fall towards $71/70 in the near term.
Gold (1805.40) has risen above 1800 and is heading towards 1820.A strong rise above 1820 can take Gold eventually higher towards 1840 in the coming 1-2 weeks. View is bullish in the near term while above 1800. Watch price action near 1810-1820 in the near term. .
Silver (25.96) looks stable but continues to trade above 25.80. We may expect 25.80-26.50-27.00 region to hold for the near term.
Copper (4.2770) tested 4.2535 before rising a bit. We may expect near term range of 4.20-4.40 to hold for sometime before it breaks on either side of the range.
FOREX
Dollar Index has dipped a bit taking Euro higher but we need to see if the movement sustains. A range of 92-93 could hold for the Dollar Index while Euro can trade within 1.1770-1.1870. EURJPY tested 129.62 before bouncing higher and a revised trade range of 129-131 could hold for the near term. Pound and Aussie looks bearish for the near term. USDCNY may dip while below 6.49. USDINR may dip towards 74.50 or lower while upside could be capped at 75.0-75.10.
Dollar Index (92.46) fell sharply from 92.85 on Wednesday bu has bounced back from an intra-day low of 92.24 seen yesterday. We may expect some ranged movement between 93 and 92 before a break on either side is seen.
Euro (1.1835) has risen above 1.18 but needs to sustain a rise above 1.1850 to negate another dip towards 1.18-1.1780/70 again. We would wait and watch to see if Euro can remain sideways for sometime within 1.1770-1.1870 before seeing a breakout on either side of the range.
EURJPY (130.08) has bounced from 129.62 and while the momentum holds good, we may expect a test of 130.90-131 before another dip takes place towards 129.60-129.00
Dollar-Yen (109.92) has immediate support near 109.50 which if holds may produce a bounce back towards 110-111, else the fall could continue towards 108.50.
Aussie (0.7418) has dipped further and looks bearish towards 0.74-0.73 in the near term.
Pound (1.3774) looks bearish too and can test 1.3730. Whether it will fall further from there or not will have to be seen. A fall below 1.3730 can take it lower towards 1.37.
USDCNY (6.4849) may dip towards 6.45 as immediate resistance at 6.49 may hold for now. A break above 6.49 is needed for the pair to rise further in the longer run.
USDINR (74.71) came off sharply from 74.84 but while above 74.50, we may continue to look for a possible test of 75-75.10 before a decline is seen. On the downside, a fall below 74.50 is needed for the pair to fall towards 74.40.
INTEREST RATES
The US Treasury yields fell sharply to test their crucial supports in the US sessions yesterday. The price action in the coming days will need a close watch to see if the yields are bouncing back from their crucial supports at 1.9%-1.85% (30Yr) and 1.25%-1.2% (10Yr) and avoid a much deeper fall. The German yields remain under pressure and are bearish to see further fall from current levels. The 10Yr GoI has come down further and can test 6.1%. A range of 6.1%-6.2% is a possibility for some time.
The US 2Yr (0.20%), 5Yr (0.78%), 10Yr (1.31%) and 30Yr (1.93%) Treasury yields fell sharply in the US session yesterday and had bounced-back to the levels seen in the early Asian session yesterday. 1.25% on the 10Yr has been tested and is holding as of now. While above the 1.25%-1.2% support zone, a corrective bounce to 1.4%-1.5% is a possibility. Similarly, the 30Yr is just above its 1.9%-1.85% support zone and while this holds a corrective bounce to 2.1%-2.2% is possible in the coming weeks.
The German 2Yr (-0.69%), 5Yr (-0.61%), 10Yr (-0.31%), 30Yr (0.18%) yields remain lower and stable. Our bearish view remains intact. The 30Yr can test 0.10% on the downside. The 10Yr on the other hand has dipped below -0.30% as expected and can fall to -0.40%- and -0.45% going forward.
The 10Yr GoI (6.1365%)has declined further yesterday. A test of 6.1% is likely from where a bounce is possible. As mentioned yesterday, the 10Yr GoI can consolidate between 6.1% and 6.2% for some time. A breakout on either side of this range will then give a cue on whether the yield can move up to 6.3% or fall back to 6% again.