Sample Category Title
Elliott Wave View: Nifty Approaching Support Area
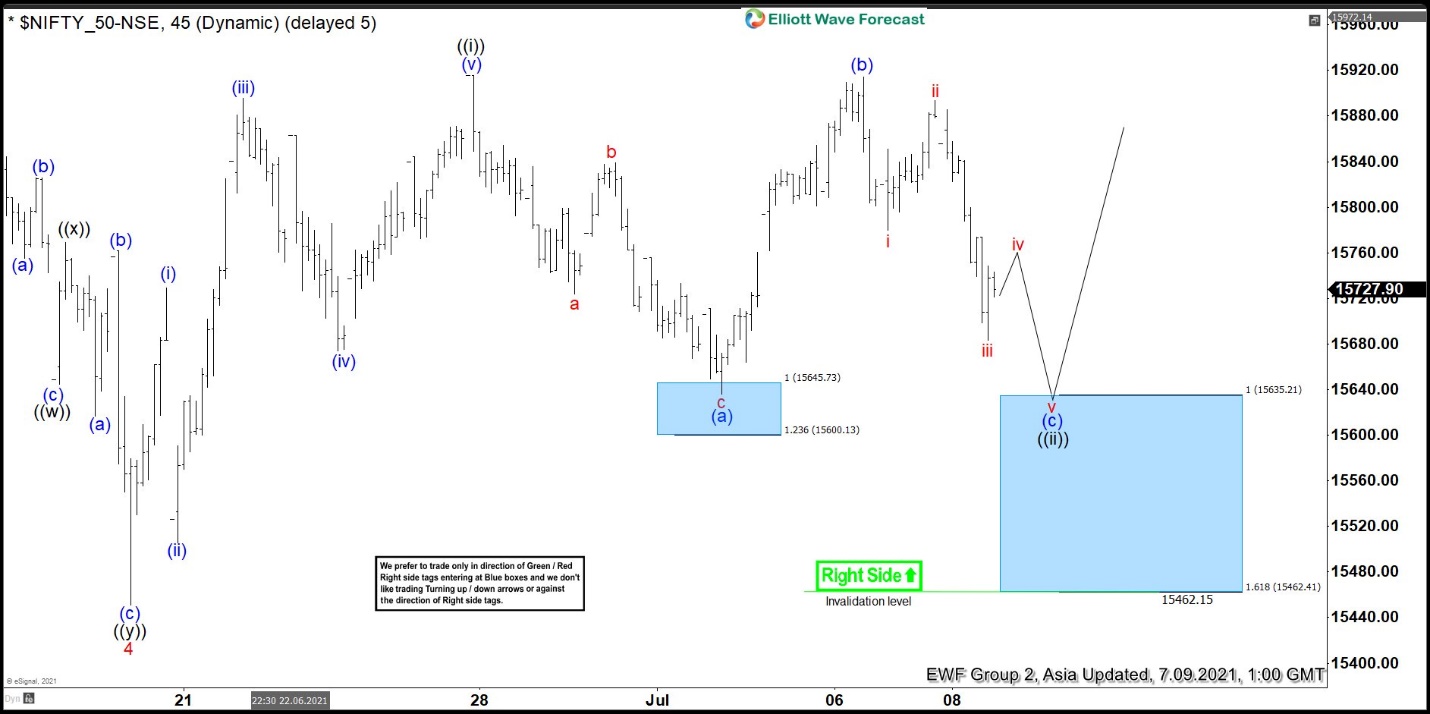
Elliott Wave View in Nifty suggests the rally from January 29, 2021 low is unfolding as a 5 waves impulsive Elliott Wave structure. Up from January 29 low, wave 1 ended at 15431.75 and pullback in wave 2 ended at 14151.40. Index resumes higher in wave 3 towards 15901.60 and dips in wave 4 ended at 15450.90. Index has resumed higher in wave 5 with internal subdivision as another 5 waves in lesser degree.
Up from wave 4, wave (i) ended at 15729.20 and pullback in wave (ii) ended at 15505.65. Index resumes higher in wave (iii) to 15895.75 and dips in wave (iv) ends at 15673.95. Final leg higher wave (v) ended at 15915.65. This completed wave ((i)) in higher degree. Wave ((ii)) pullback is unfolding as a Flat Elliott Wave structure. Down from wave ((i)), wave (a) ended at 15635.95, and rally in wave (b) ended at 15914.20. Wave (c) is expected to complete at 100% – 161.8% Fibonacci extension of wave (a) at 15462.15 – 15635.21 blue box area. From this area, buyers should appear for the next leg higher or at least 3 waves rally.
Nifty 45 Minutes Elliott Wave Chart
USD/JPY Starts Fresh Decline, Key Support Nearby
Key Highlights
- USD/JPY started a major decline below the 111.00 and 110.00 levels.
- It traded below a crucial bullish trend line with support at 110.35 on the 4-hours chart.
- EUR/USD and GBP/USD recovery could face resistance near 1.1900 and 1.3850 respectively.
- Crude oil price is stable above the $70.00 support zone.
USD/JPY Technical Analysis
The US Dollar topped near the 111.65 level against the Japanese Yen. USD/JPY started a major decline, and it traded below the 111.00 and 110.50 support levels.
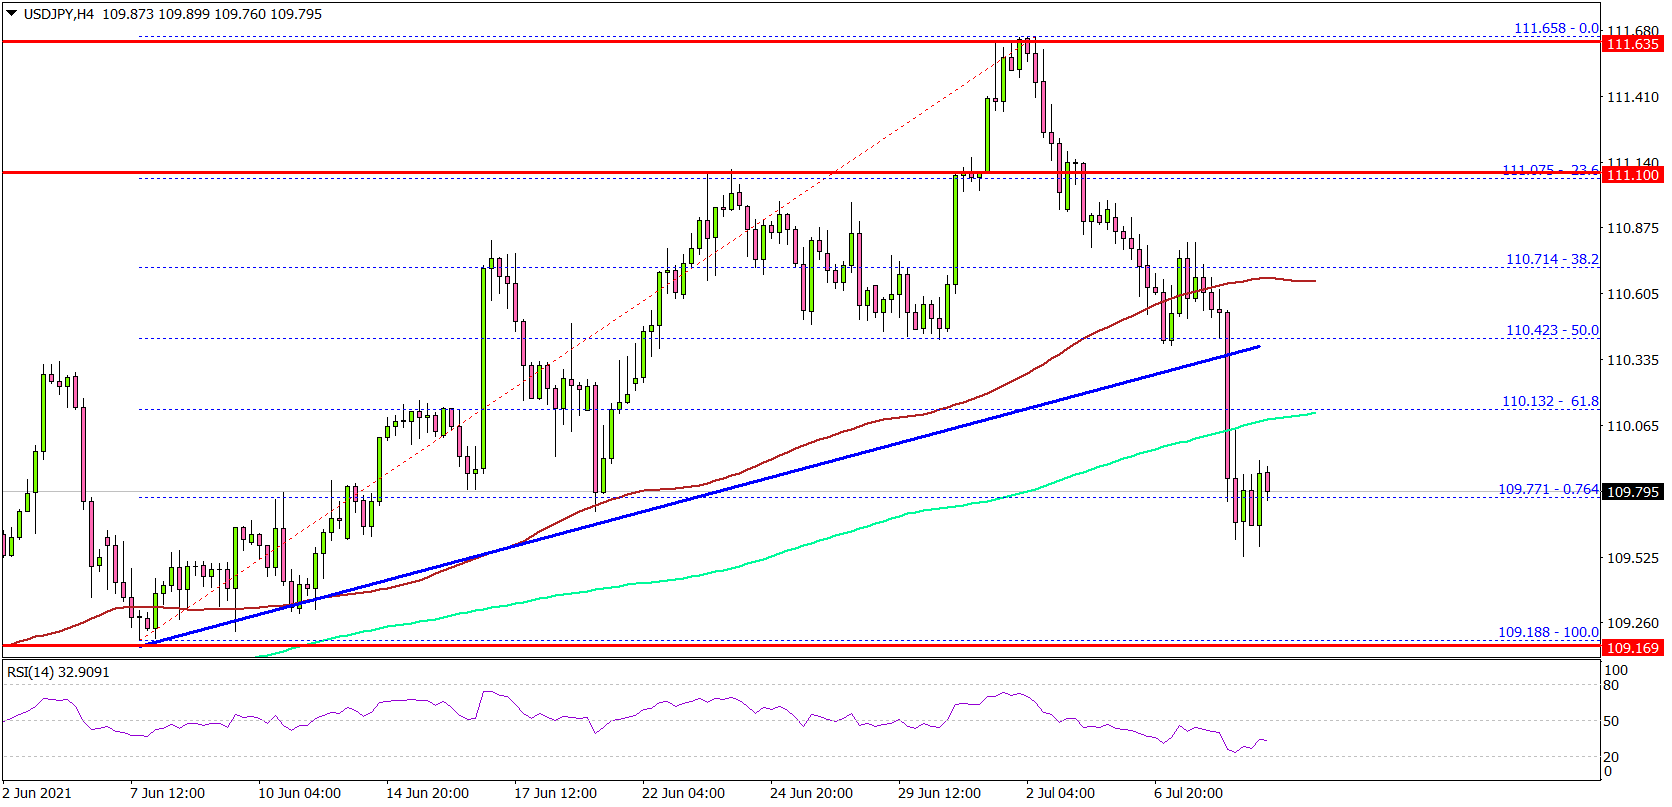
Looking at the 4-hours chart, the pair gained bearish momentum below the 111.00 level. There was also a break below a crucial bullish trend line with support at 110.35.
The pair even traded below the 50% Fib retracement level of the upward move from the 109.18 swing low to 111.65 high. It is now trading well below 110.20 and the 100 simple moving average (red, 4-hours).
There was also a spike below the 76.4% Fib retracement level of the upward move from the 109.18 swing low to 111.65 high. It seems like USD/JPY might continue to move down towards the 110.20 support level.
The next major support is near the 110.00 level. Any more losses may possibly call for a drop towards the 109.40 level.
Looking at EUR/USD, the pair is attempting a recovery, but it could face resistance near 1.1900. Similarly, GBP/USD is likely to struggle near 1.3850 and 1.3900.
Economic Releases
- UK Industrial Production for May 2021 (MoM) - Forecast +1.5%, versus -1.3% previous.
- UK Manufacturing Production for May 2021 (MoM) - Forecast +1.0%, versus -0.3% previous.
- UK GDP for May 2021 (MoM) - Forecast +1.7%, versus +2.3% previous.
- Canada’s Employment Change for June 2021 – Forecast 195K, versus -68K previous.
- Canada’s Unemployment Rate for June 2021 - Forecast 7.7%, versus 8.2% previous.
Eco Data 7/9/21
[php_everywhere instance="1"]
Pound Edges Lower, GDP Next
The British pound is in negative territory on Thursday. In the North American session, GBP/USD is trading at 1.3760, down 0.29% on the day.
There are no British events on today’s schedule, and predictably, the pound is having a quiet day. The week will end on a busy note, with a data dump out of the UK early on Friday. GDP for May is expected to slow to 1.7% MoM, down from 2.3% in April. The forecast for Manufacturing Production for May is more positive, with a consensus of 1.0%, compared to -0.3% beforehand.
The UK recovery continues to gain traction, and the June PMIs were another indication that the economy is headed in the right direction. The PMIs were all above the 60-level, pointing to strong growth in the manufacturing, services and construction sectors.
The government is keen to completely open up the economy and remove all health restrictions on July 19. The original ‘Freedom Day’, set for June 21, had to be postponed. Prime Minister Boris Johnson says that the move will go ahead, despite a jump in Covid cases, which have jumped to 30,000, the highest level since January. Health officials have warned that scrapping all restrictions could lead to spike in infections, so the government is clearly taking a big risk in moving ahead.
Fed in no rush to taper
There was an air of anticipation ahead of the release of the FOMC minutes on Wednesday, with investors hoping that the minutes would provide some clues as to when the Fed might begin scaling back its bond purchases. In the end, however, the release turned out to be a sleeper, and market reaction was muted. The Fed failed to give any clues as to a timeline for a taper, and most members did not support a tightening of policy. Still, the fact that the Fed is “talking about talking about a taper” can be viewed as a small step towards a tighter policy down the road.
GBP/USD Technical Analysis
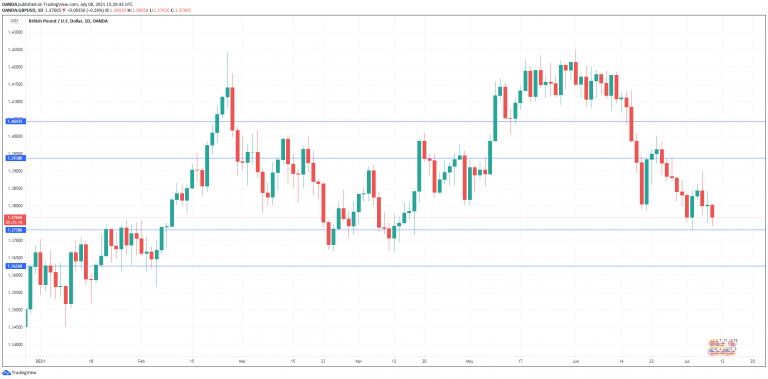
- There is resistance at 1.3938. Above, there is resistance at 1.4043
- On the downside, 1.3730 has weakened in support. This is followed by support at 1.3627
EURUSD Remains Heavy as Rebound Curbed by 50-MA
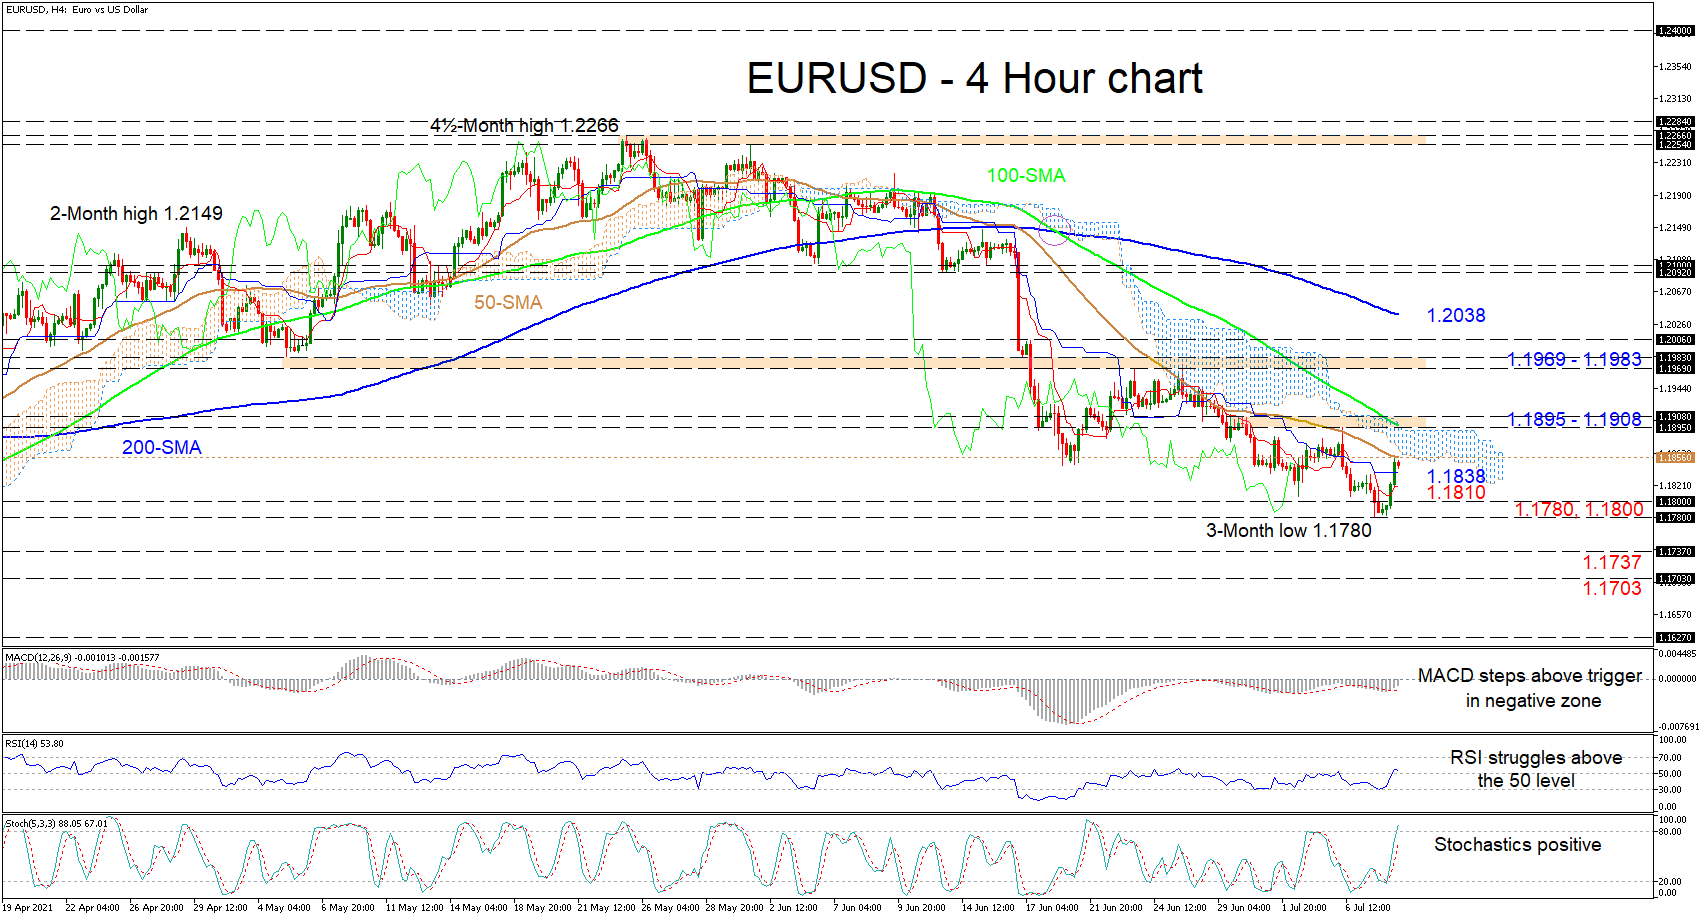
EURUSD has been logging green candles after finding its footing around a three-month low of 1.1780 and is pushing up against the 50-period simple moving average (SMA) at 1.1856, which has dismissed previous bounces ever since it adopted a downwards trajectory around June 11. Currently, the bearish SMAs are attempting to subdue growing buying interest.
The short-term oscillators are signalling growing positive momentum, while the Ichimoku lines are not indicating a convincing pickup in bullish impetus. The MACD has improved above its red trigger line and towards the zero mark, while the RSI is labouring to maintain a positive bearing. Moreover, the stochastic oscillator is promoting a strong bullish tone.
If the 50-period SMA at 1.1856 and the adjoining Ichimoku cloud manage to keep buyers at bay, early downside deterrence could occur from the Ichimoku lines at 1.1838 and 1.1810 respectively. If sellers start to dictate the price, next in line is the 1.1800 handle and the 3-month low of 1.1780. If the 1.1780 obstacle breaks down, the bearish outlook may power on, aligning its course with the 1.1737 barrier and the March 31 trough of 1.1703.
If together the 50-period SMA and the cloud fail to silence additional gains, buyers could quickly encounter another resistance belt of 1.1895-1.1908, which is fortified by the 100-period SMA. Should upside momentum accelerate, the 1.1969-1.1983 resistance border could be the catalyst to significantly bolster buyers confidence.
Summarizing, EURUSD is flashing green beneath the capping 50-period SMA and for its bullish labours to evolve the price would need to steer above the cloud around 1.1900.
CAD Extends Losses Despite Solid PMI
The Canadian dollar continues to lose ground this week. In the North American session, USD/CAD is trading at 1.2552, up 0.57% on the day.
It has been a dismal week for the Canadian dollar, with USD/CAD jumping 1.88%. Earlier in the day, the pair climbed to 1.2590, its highest level since June 21. The Canadian dollar, which is sensitive to commodity prices, has been hurt by oil prices tumbling by some 6% in just three days. With the collapse of the OPEC+ talks, there are growing concerns that the current production agreement will expire and producers will sharply increase production in order to gain market share.
Canada Ivey PMI jumps
There was positive news from Canada’s Ivey PMI, which was much stronger than expected. The PMI, which covers all sections of the Canadian economy, accelerated to 71.9 in June, up from 64.7 beforehand. The PMI is well into expansionary territory, with a reading above 50 pointing to growth. Attention will now shift to Canada’s June employment report, with the economy projected to have created 195 thousand jobs in June, compared to a loss of 68 thousand in May.
The FOMC minutes turned out to be a non-event, as Fed policymakers “talked the talk” about tapering but failed to provide any timelines for a tightening in policy. Some members called for a taper, arguing that the economic recovery was moving more quickly than expected and inflation was on the rise. Still, the majority view was that currently there was no need for any shift in policy, as the economy still needed to make “substantial further progress”. There were no clues as to the timing of a taper, but one takeaway from the minutes is that there is only limited support for any reduction in QE.
USD/CAD Technical
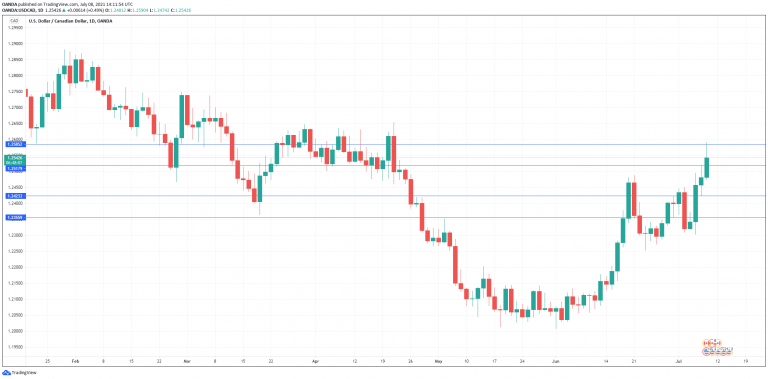
- USD/CAD is testing resistance at 1.2517. Above, there is resistance at 1.2585
- On the downside, there is support at 1.2423. Below, there is support at 1.2355
ECB Strategic Review: Striving for Symmetry
ECB today announced the outcomes of its long-awaited monetary strategy review, see here. The results were originally only expected to be unveiled by the end of the summer, however, after intensive discussions the Governing Council (GC) members reached unanimous agreement on the review results sooner than expected.
Below we summarize the key outcomes:
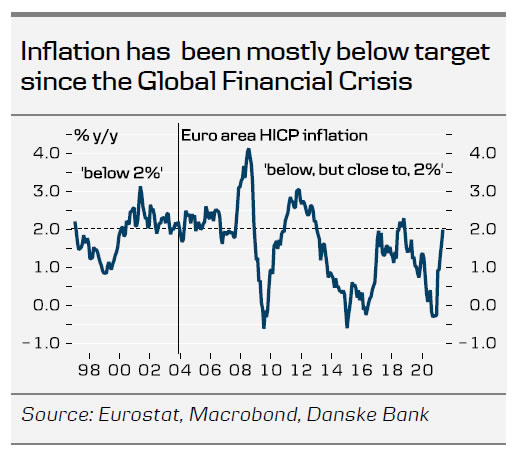
- Price stability objective: The primary objective of the ECB remains price stability, as established in the Treaty on the Functioning of the European Union. In recent years, ECB has faced growing criticism of an asymmetric understanding of its 'inflation rates below, but close to, 2%' formulation of price stability that was adopted in 2003. Going forward the ECB will therefore define its price stability objective as a simple symmetric 2% inflation target over the medium term. This also includes a flexible understanding that inflation will not always be on target, but fluctuate around the 2% level. This should provide the ECB with sufficient flexibility and leeway to calibrate its monetary policy in a holistic way, still focussing on inflation, but without being 'locked' due to a specific rule. This also implies a more flexible inflation targeting regime than the Fed's average inflation targeting (AIT), which explicitly requires making up for any past inflation misses. In that sense, the new symmetric ECB target is somewhat less aggressive than the Fed's AIT, by tolerating, rather than targeting an inflation overshoot. We do not expect the new symmetric inflation target formulation to have much implication for monetary policy in the short- to medium-term, explaining the muted market reaction to the announcement. Despite an accelerating recovery and growing cost-push pressures in manufacturing, the outlook for underlying inflation is still muted in the euro area and we remain sceptic that core inflation is about to return to the highs preceding the Global Financial Crisis on a sustained basis (read more in Research Euro Area - Mind the inflation gap, 8 June). Over the long-term, the new price stability target could on balance imply a more patient stance with regard to any future monetary tightening, with inflation overshoots more explicitly allowed.
- Inflation target measure: Despite the symmetric price stability target, the inflation target will continue to be formally defined by the Harmonised Index of Consumer Prices (HICP) or headline inflation. That said, we expect ECB to continue to effectively base its monetary policy decisions on the developments in underlying inflation, i.e. 'core' inflation with excludes volatile items such as food and energy prices.
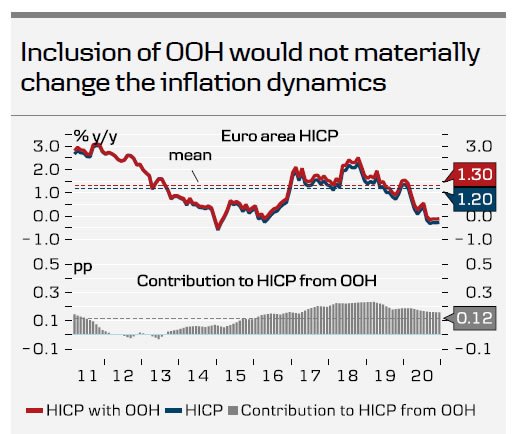
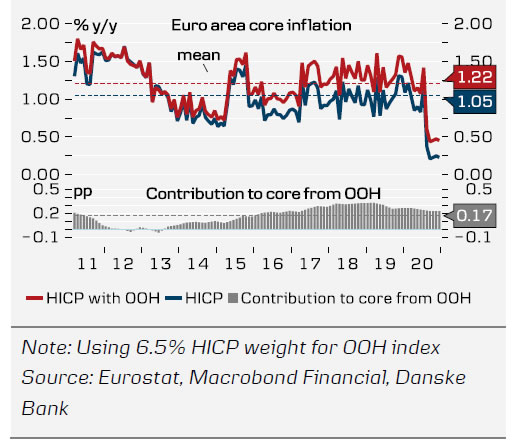
- HICP composition: Sharp increases in house prices and rents in recent years have reinforced the gap between official inflation measures such as HICP and the cost of living perceived by consumers. In light of this there has been a growing debate to include the cost of owner-occupied housing (OOH) in the HICP basket. While the decision on the exact computation of HICP ultimately rests with Eurostat, the ECB has now explicitly recommended the inclusion of OOH in HICP over time. However, even if Eurostat follows the ECB's recommendation, the actual implementation into HICP will likely take a few years to materialize, not least due to data quality issues. Until this is achieved, estimates of costs of OOH will play a supplementary role in the ECB's inflation assessment. Overall, the inclusion of OOH would however not dramatically change the inflation picture, lifting HICP inflation by ca. 0.1pp and core inflation by ca. 0.2pp on average (read more in Euro Area Research - Housing inflation: Opening Pandora's Box, 6 February 2020). In that sense, the inclusion of OOH costs alone will not solve the problem of reaching the inflation target. Indeed, it could turn out to be a Pandora's box: With housing being more responsive to cyclical swings, its inclusion could well introduce an added element of volatility in HICP. This could make the ECB's task even harder, not only with regard to containing deflation risks during downturns, but also in terms of accurately deciphering and predicating the medium-term inflation outlook.
- Climate: Since Lagarde took office, the climate change agenda has seen increasing focus by the ECB and markets. To further incorporate climate change considerations into its policy framework, ECB has now adopted a climate change action plan. This involves expanding analytical capacities in macroeconomic modelling, statistics and monetary policy with regard to climate change and including climate change considerations in monetary policy operations in the areas of disclosure, risk assessment, collateral framework and corporate sector asset purchases. The ECB will introduce disclosure requirements for private sector assets as a new eligibility criterion or as a basis for a differentiated treatment for collateral and asset purchases, with a detailed plan announced during 2022. ECB will also start conducting climate stress tests of the Eurosystem balance sheet in 2022. With regard to corporate sector asset purchases, the ECB will adjust the framework guiding the allocation of corporate bond purchases to incorporate climate change criteria.
Will ECB now meet its inflation mandate?
As the ECB strategic review resulted neither in the development of new monetary policy tools that could foster the achievement of the inflation target, nor changed its explicit target variable of HICP inflation at 2%, we do not see the probability of ECB meeting its inflation objective altered by the strategic review. For ECB the conundrum remains that underlying inflation pressures remain anchored at a too low level and without the support from other policy areas (namely fiscal policy), ECB will continue to face challenges in living up to its inflation target in our view, be it defined as below, but close to, 2% or just 2%.
Sunset Market Commentary
Markets
In ‘normal times’, the ECB publishing the results of its policy review would be the dominant headline on markets (cf infra). Evidently, there was plenty of analysis on this topic on the newswires, but it was no factor of significance for trading. Investors had to cope with other issues. Growing doubts on the post-pandemic recovery continue to unsettle the hoped for calm during the summer holidays. This morning’s ‘call’ of the Chinese government for the PBOC to consider a further cut in the Reserve Requirement Ratio (RRR) only reinforced investors’ nervousness. Markets switched to outright risk-off modus. Over the previous days, especially US equities weathered uncertainty on FI and FX markets, but that has changed today. Spill-overs from Asia/China triggered a self-off on European equity markets with most indices losing 2%/3%. In US, the S&P and the Nasdaq yesterday still touched new historic record levels intraday, but indices are ceding up to 1.6%. The Nasdaq (tech) outperforming cyclicals due to lower long term yields today also doesn’t work anymore. The curve flattening in core bond markets simply continues, even as the pace of the decline eased as US traders joined the action. German yields currently decline between 0.7 bp and 3 bp. This looks modest maybe, but after recent decline, the technical picture is severely damaged with the German 10-y yield below -0.30%. The 10-y EMU swap dropped (temporarily) below zero! Until yesterday, peripheral EMU bond yields followed the decline in core yields, but also this pattern didn’t survive the risk-off move anymore. 10-y spreads of the likes of Spain, Portugal, Greece and Italy are widening 3-4 bp. Similar picture in the US, with yields declining between 1.5 bp (2-y) and 4.25 bp (30-y). The move was driven by a decline in inflation expectations, illustrating the unravelling of the reflation trade. Cyclical commodities (copper, oil) are also falling prey to further profit taking.
The risk-off today evidently also affected FX trading. The yen remains the preferred save haven with USD/JPY drifting further below the 110 mark (109.70). Smaller, less liquid currencies (HUF, CZK, PLN) and commodity related currencies (CAD, AUD, NOK) also suffered as one expects in this kind of risk-off world. Highly remarkable, the euro today outperformed the dollar. EUR/USD jumped from sub-1.18 levels this morning and currently trades near 1.1855. The explanation is not that evident. The new ECB policy framework (higher inflation), if anything, is euro negative rather than euro supportive. Profit taking on recent euro shorts and/or unwinding of carry trades funded in the low-yielding euro are possible explanations. Even so, EUR/USD still trades within a ST downtrend channel. The technical picture hasn’t profoundly changed yet. In a similar move, EUR/GBP rebounds north of 0.86.
News Headlines
Hungarian inflation unexpectedly accelerated 0.6% m/m to hit 5.1% y/y in June vs. 5.1% the month before. Core inflation rose as well from 3.4% to 3.8% amid broad-based price gains, including in the services sector. It means inflation remains well north of the central bank’s 3% target with a +/-1ppt tolerance band. The MNB signaled it would raise rates as much as necessary to cool down inflation towards target and until inflation risks, now tilted to the upside, are balanced again. It did so in June (+ 30bps) and is likely to do so again in July and August. The Hungarian forint is under heavy selling pressure for a third day straight with EUR/HUF jumping to 358.45. Even if markets believe the MNB’s inflation pledge, it’s not enough to counter the general sharp sell-off in risky assets today.
The ECB presented its new policy framework today. It changes its inflation target from “close to but below 2%” to just 2% over the medium term. It will allow for temporary fluctuations. More persistent deviations will be viewed as equally undesirable on either side of the 2% and will prompt action, meaning the target is symmetrical. The ECB will also add the cost of owner-occupied housing to the inflation measure to more accurately reflect the actual cost of living. (The impact of) climate change will be incorporated in risk modelling as well as serve as a new criterium in both the collateral framework and (corporate) bond buying programmes.
EUR/USD Mid-Day Outlook
Daily Pivots: (S1) 1.1771; (P) 1.1803; (R1) 1.1825; More...
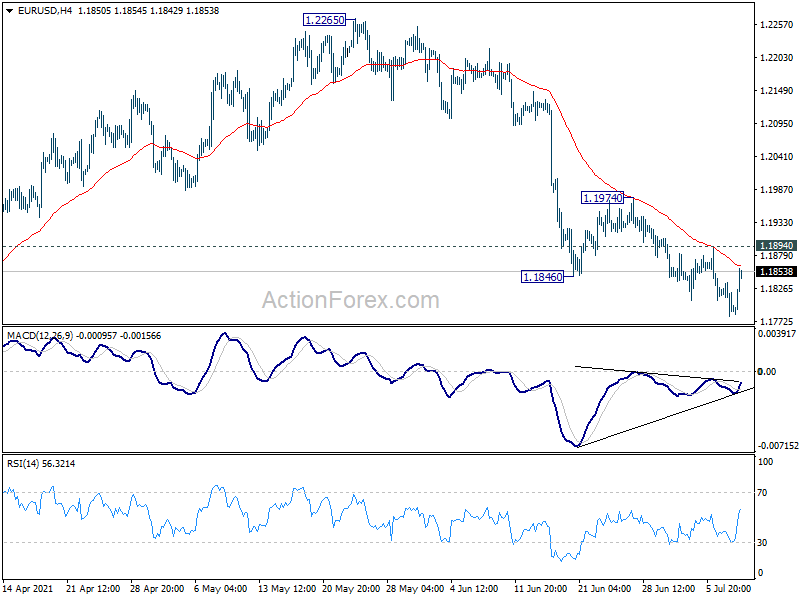
Fall from 1.2265, as the third leg of the consolidation pattern from 1.2348, is still in progress. Deeper decline would be seen to 1.1703 key support next. On the upside, break of 1.1894 resistance will suggest short term bottoming, on bullish convergence condition in 4 hour MACD. Stronger rebound should then be seen to 1.1974 resistance and above.
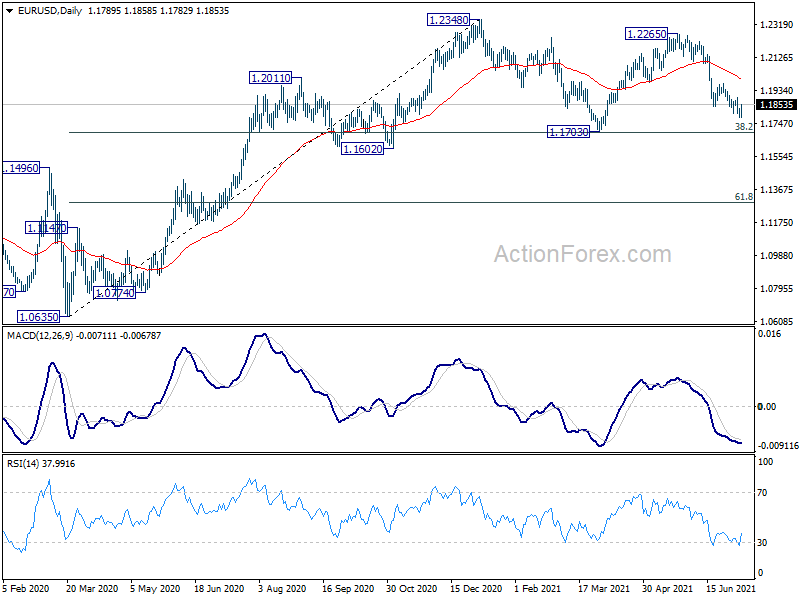
In the bigger picture, rise from 1.0635 is seen as the third leg of the pattern from 1.0339 (2017 low). Further rally could be seen to cluster resistance at 1.2555 next, (38.2% retracement of 1.6039 to 1.0339 at 1.2516). This will remain the favored case as long as 1.1602 support holds. Reaction from 1.2555 should reveal underlying long term momentum in the pair. However sustained break of 1.1602 will argue that the rise from 1.0635 is over, and turn medium term outlook bearish again.
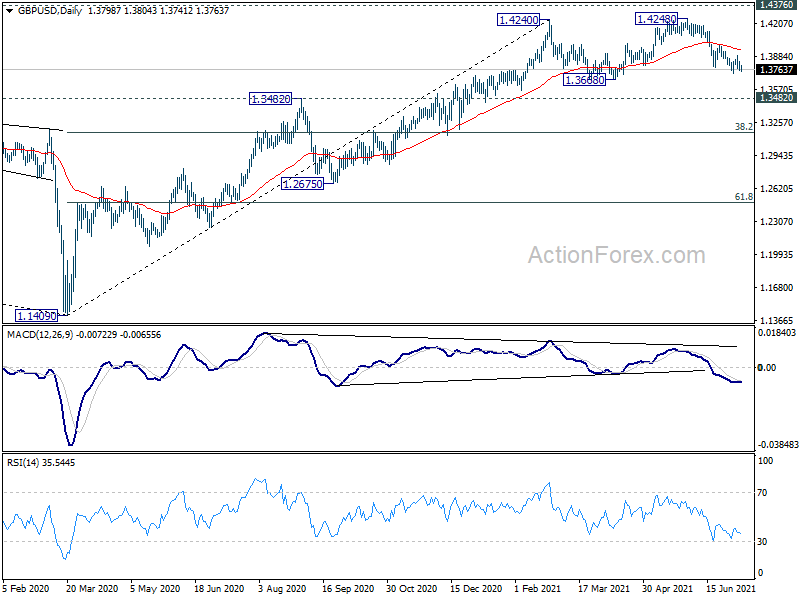
GBP/USD Mid-Day Outlook
Daily Pivots: (S1) 1.3755; (P) 1.3799; (R1) 1.3843; More....
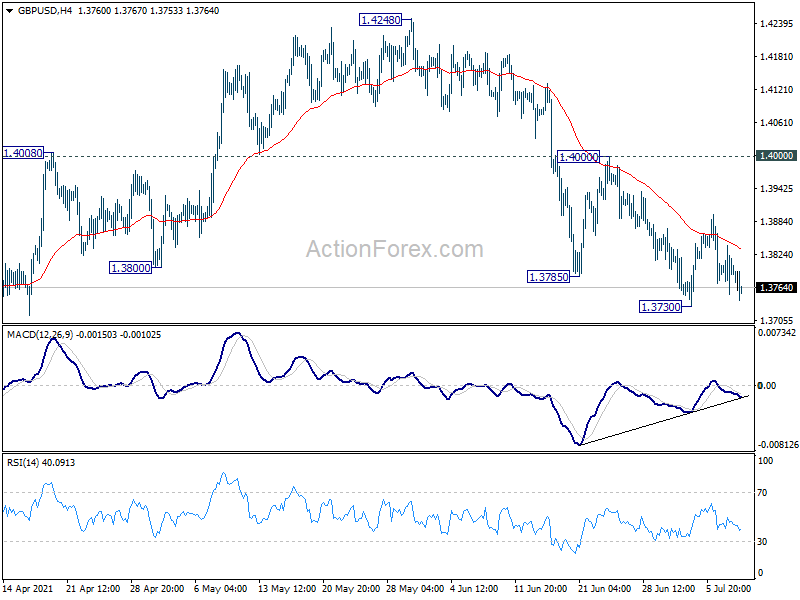
Intraday bias stays neutral at this point. On the downside, break of 1.3730 support will resume the fall from 1.4248, as the third leg of the consolidation pattern from 1.4240. Deeper decline would be seen to 1.3668 support and possibly below. On the upside, break of 1.4000 resistance will argue that fall from 1.4248 has completed. Intraday bias will be turned back to the upside for retesting 1.4240/8 resistance zone.
In the bigger picture, as long as 1.3482 resistance turned support holds, up trend from 1.1409 should still continue. Decisive break of 1.4376 resistance will carry larger bullish implications and target 38.2% retracement of 2.1161 (2007 high) to 1.1409 (2020 low) at 1.5134. However, firm break of 1.3482 support will argue that the rise from 1.1409 has completed and bring deeper fall to 1.2675 support and below.