

Sample Category Title
EUR/JPY Daily Outlook
Daily Pivots: (S1) 130.24; (P) 130.64; (R1) 130.85; More....
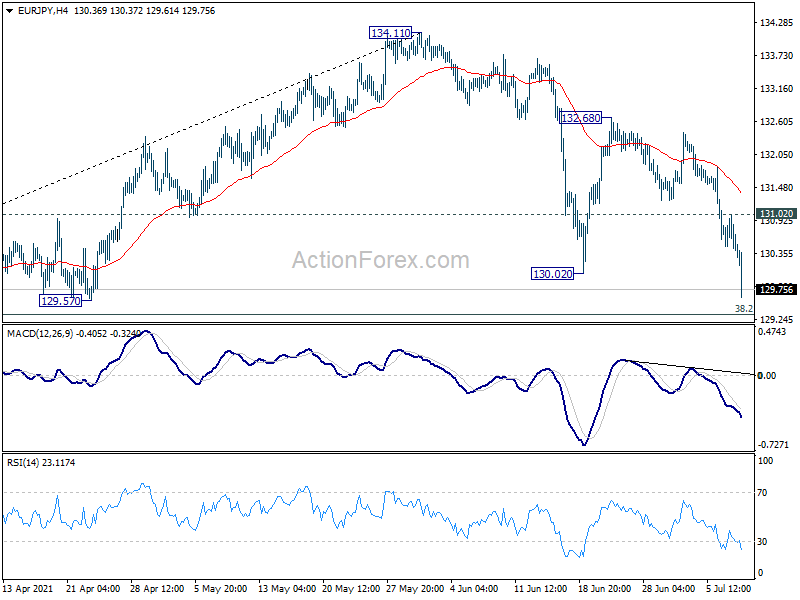
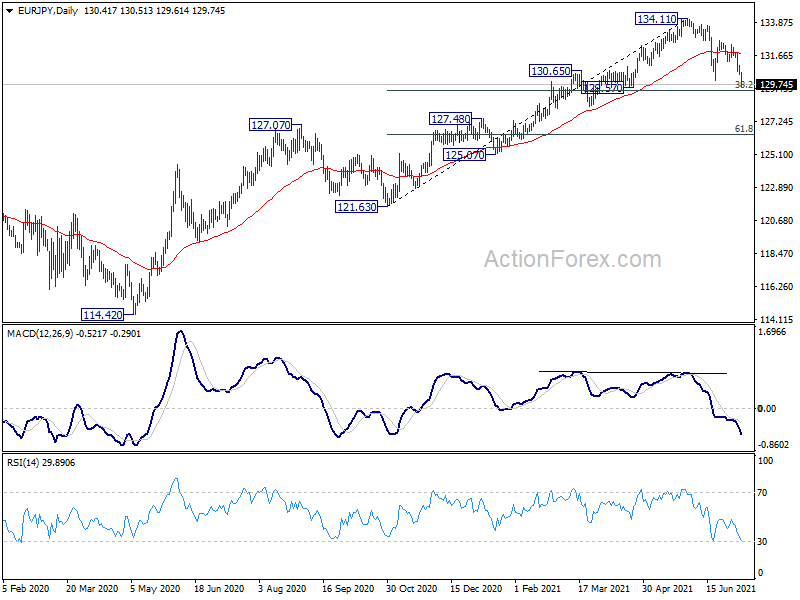
EUR/JPY's break of 130.02 confirms resumption of whole correction from 121.63. Deeper decline would be seen to 38.2% retracement of 121.63 to 134.11 at 129.34 support. We'd look for strong support from there to bring rebound. On the upside, above 131.02 minor resistance will turn bias back to the upside for 132.68 resistance first.
In the bigger picture, rise from 114.42 is seen as a medium term rising leg inside a long term sideway pattern. Next target is 137.49 (2018 high). Decisive break there will open up the possibility that it's indeed resuming the up trend from 94.11 (2012 low). For now, outlook will stay bullish as long as 127.07 resistance turned support holds, in case of pull back.
EUR/AUD Daily Outlook
Daily Pivots: (S1) 1.5710; (P) 1.5754; (R1) 1.5803; More...
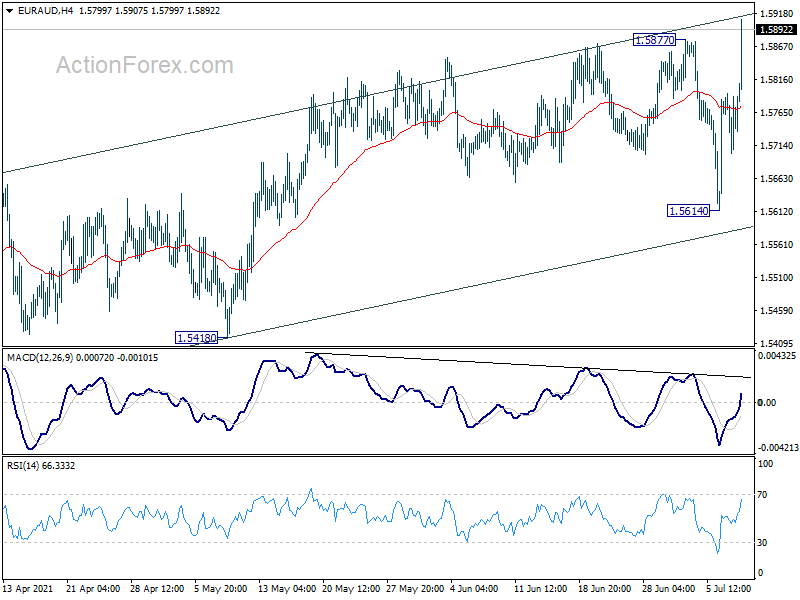
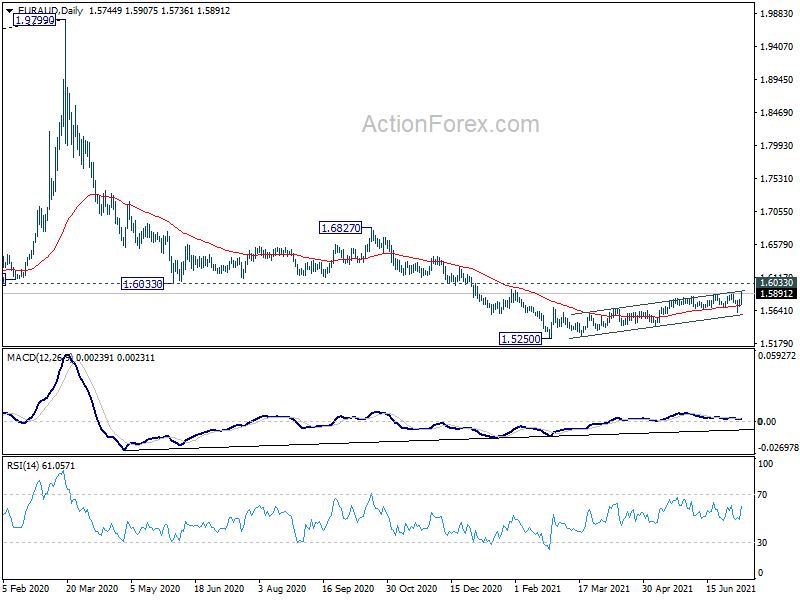
EUR/AUD's strong rally and break of 1.5877 resistance suggests resumption of whole choppy rise from 1.5025 low. Intraday bias is back on the upside for 1.6033 resistance turned support next. On the downside, break of 1.5614 resistance support is needed to indicate short term topping. Otherwise, further rise will remain in favor in case of retreat.
In the bigger picture, price actions from 1.9799 are developing into a deep correction, to long term up trend from 1.1602 (2012 low). Deeper fall would be seen to 61.8% retracement of 1.1602 to 1.9799 at 1.4733. Medium term outlook will remain bearish as long as 1.6033 support turned resistance holds, even in case of strong rebound. However, firm break of 1.6033 will argue that such decline has completed, and turn focus to 1.6827 structural resistance for confirmation.
USD/JPY Outlook: Accelerates Through Key 110 Support Zone On Fresh Risk Aversion
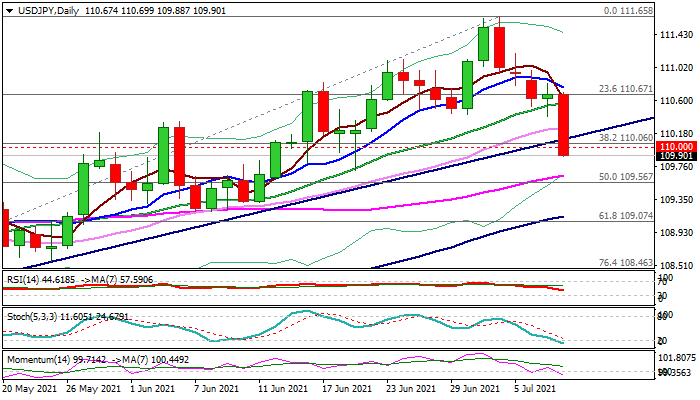
The USDJPY accelerated sharply lower in early European trading on Thursday, deflated by fresh risk aversion, mainly driven by a sharp fall in China’s government bond yields after authorities announced cuts in banks’ mandatory reserves in order to keep monetary policy stable, which investors took as a strong easing signal.
Fresh weakness probes through pivotal 110 support zone (bull-trendline off 107.47 low/Fibo 38.2% of 107.47/111.65/psychological), with a daily close below these levels to generate a strong bearish signal.
Rising 55DMA offers support at 109.65, with stronger acceleration to risk test of 109.13/07 (100DMA/Fibo 61.8%).
Daily chart studies are gaining negative momentum and support the action, but oversold stochastic may provide headwinds and slow bears.
Solid resistances at 110.60 zone (broken 20DMA/session high) should cap extended upticks and keep fresh bears in play.
Res: 110.06, 110.16, 110.60, 110.76.
Sup: 109.65, 109.31, 109.07, 108.72.
EUR/GBP Daily Outlook
Daily Pivots: (S1) 0.8532; (P) 0.8557; (R1) 0.8571; More...
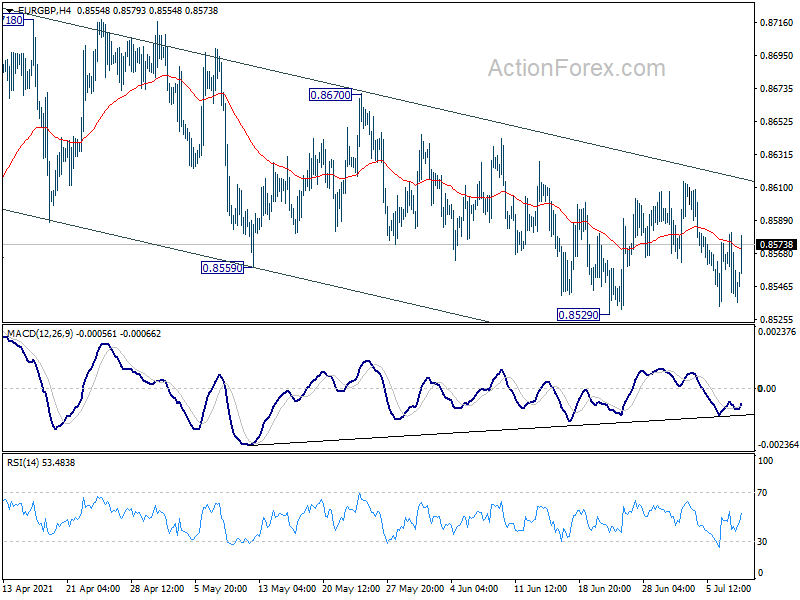
EUR/GBP is staying in range above 0.8529 and intraday bias remains neutral at this point. On the downside, break of of 0.8529 will resume the choppy decline towards retesting 0.8470 low. On the upside, decisive break of 0.8670 will confirm that corrective fall from 0.8718 has completed. Further rise would be seen to resume the rebound from 0.8470.
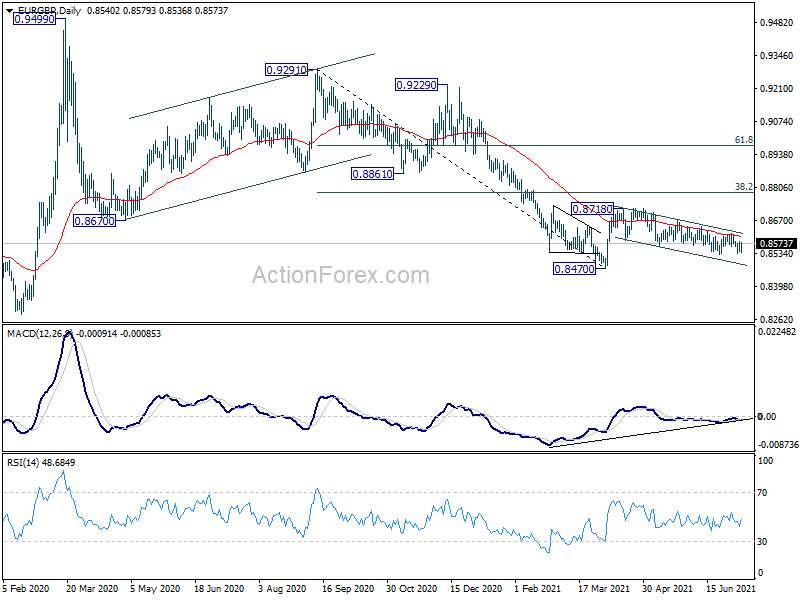
In the bigger picture, price actions from 0.9499 are still seen as developing into a corrective pattern. That is, up trend from 0.6935 (2015 low) would resume at a later stage. This will remain the favored case as long as 0.8276 support holds. However, firm break of 0.8276 support will suggest that rise from 0.6935 has completed and turn medium term outlook bearish.
EUR/CHF Daily Outlook
Daily Pivots: (S1) 1.0906; (P) 1.0920; (R1) 1.0929; More....
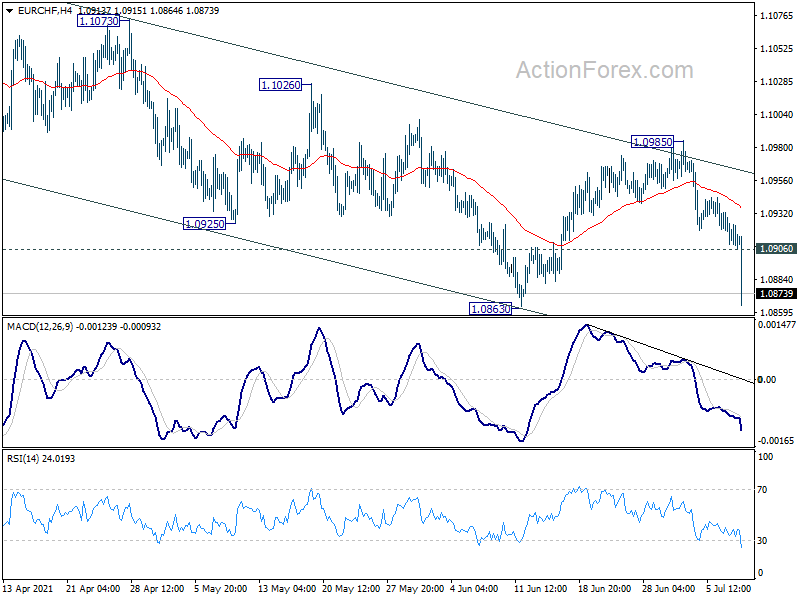
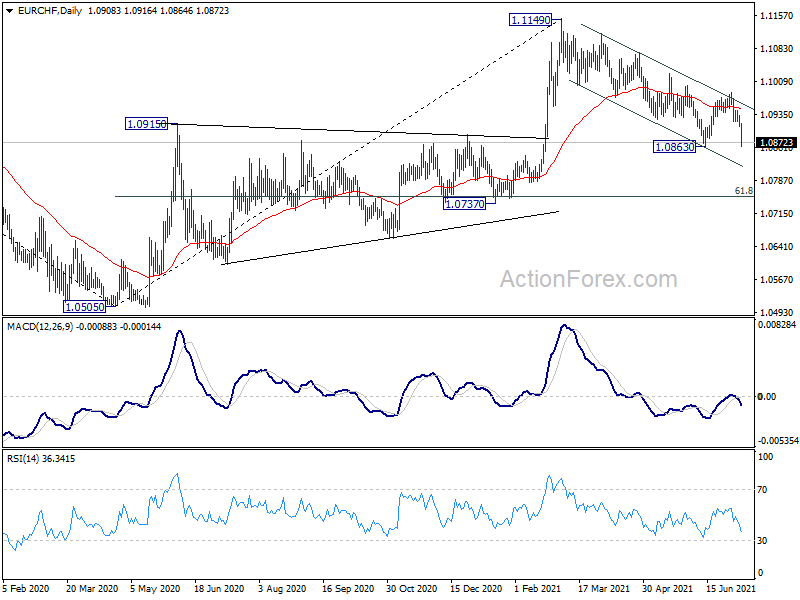
EUR/CHF drops to as low as 1.0864 so far and intraday bias remains on the downside. Break of 1.0863 support will resume whole decline from 1.1149. Deeper fall should then be seen to 1.0737 cluster support zone. On the upside, break of 1.0906 minor resistance will turn intraday bias neutral first. But outlook will stay bearish as long as 1.0985 resistance holds.
In the bigger picture, current development argues that rebound from 1.0505 (2020 low) might be completed at 1.1149 already. Rejection by 55 month EMA (now at 1.1074) at least keeps medium term bearishness open. Sustained break of 1.0737 cluster support (61.8% retracement of 1.0505 to 1.1149 at 1.0751) will argue that the down trend from 2004 (2018 high) is ready to resume through 1.0505 low. Sustained trading below 55 week EMA (now at 1.0885) will affirm this bearish case. Nevertheless, strong support from 55 week EMA will revive the case for resuming the rise from 1.0505 at a later stage.
AUDUSD Stuck On The Bearish Side, Trend Signals Unfavorable
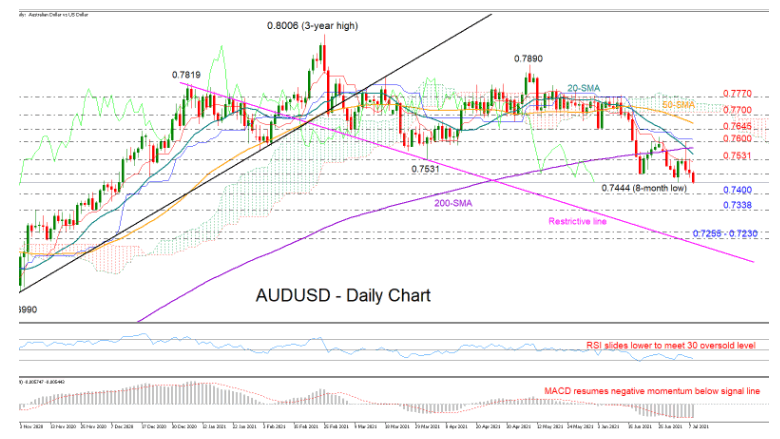
AUDUSD is pointing to the downside again after its bullish attempts to close above the red Tenkan-sen line at 0.7531 and run beyond the 0.7600 resistance vanished on Tuesday.
The RSI has reversed course as well, unable to create a higher high in the bearish territory, while the MACD has resumed its negative momentum below its red signal line, both painting a blurry picture for short-term trading.
Of note, the 20- and 200-day simple moving averages (SMAs) have completed a bearish cross for the first time since January 2020, dashing any hopes of a trend improvement. The narrowing distance between the 50- and 200-day SMAs is something to keep a close eye on too in the coming sessions.
The spotlight is now on last week’s low of 0.7444. A decisive close below it would downgrade the short- and medium-term market structure, bringing the 0.7400 level next into focus. This is also where the 23.6% Fibonacci retracement of the 2020 uptrend is positioned. Hence, failure to hold above it may activate fresh selling, likely towards the next support region of 0.7338. A step lower from here is expected to feed a more aggressive decline towards the 0.7255 – 0.7230 zone, while not far below the restrictive line drawn from the peaks in January 2021 may boost bullish pressures as it did back in April.
On the upside, a close above the red Tenkan-sen line currently at 0.7524 and the 0.7600 mark is still required to challenge the 0.7645 barrier. Unless the 50-day SMA blocks the way, the rally could accelerate towards the 0.7700 number, which has been limiting upside and downside corrections since February. Yet, for an outlook improvement, the pair would have to spiral through a long distance in order to peak above 0.8000.
Summarizing, AUDUSD remains in the bearish territory. A successful extension below 0.7440 could raise negative risks, with support expected to emerge within the 0.7400 – 0.7338 zone.
USOil Sinks Towards Daily Support
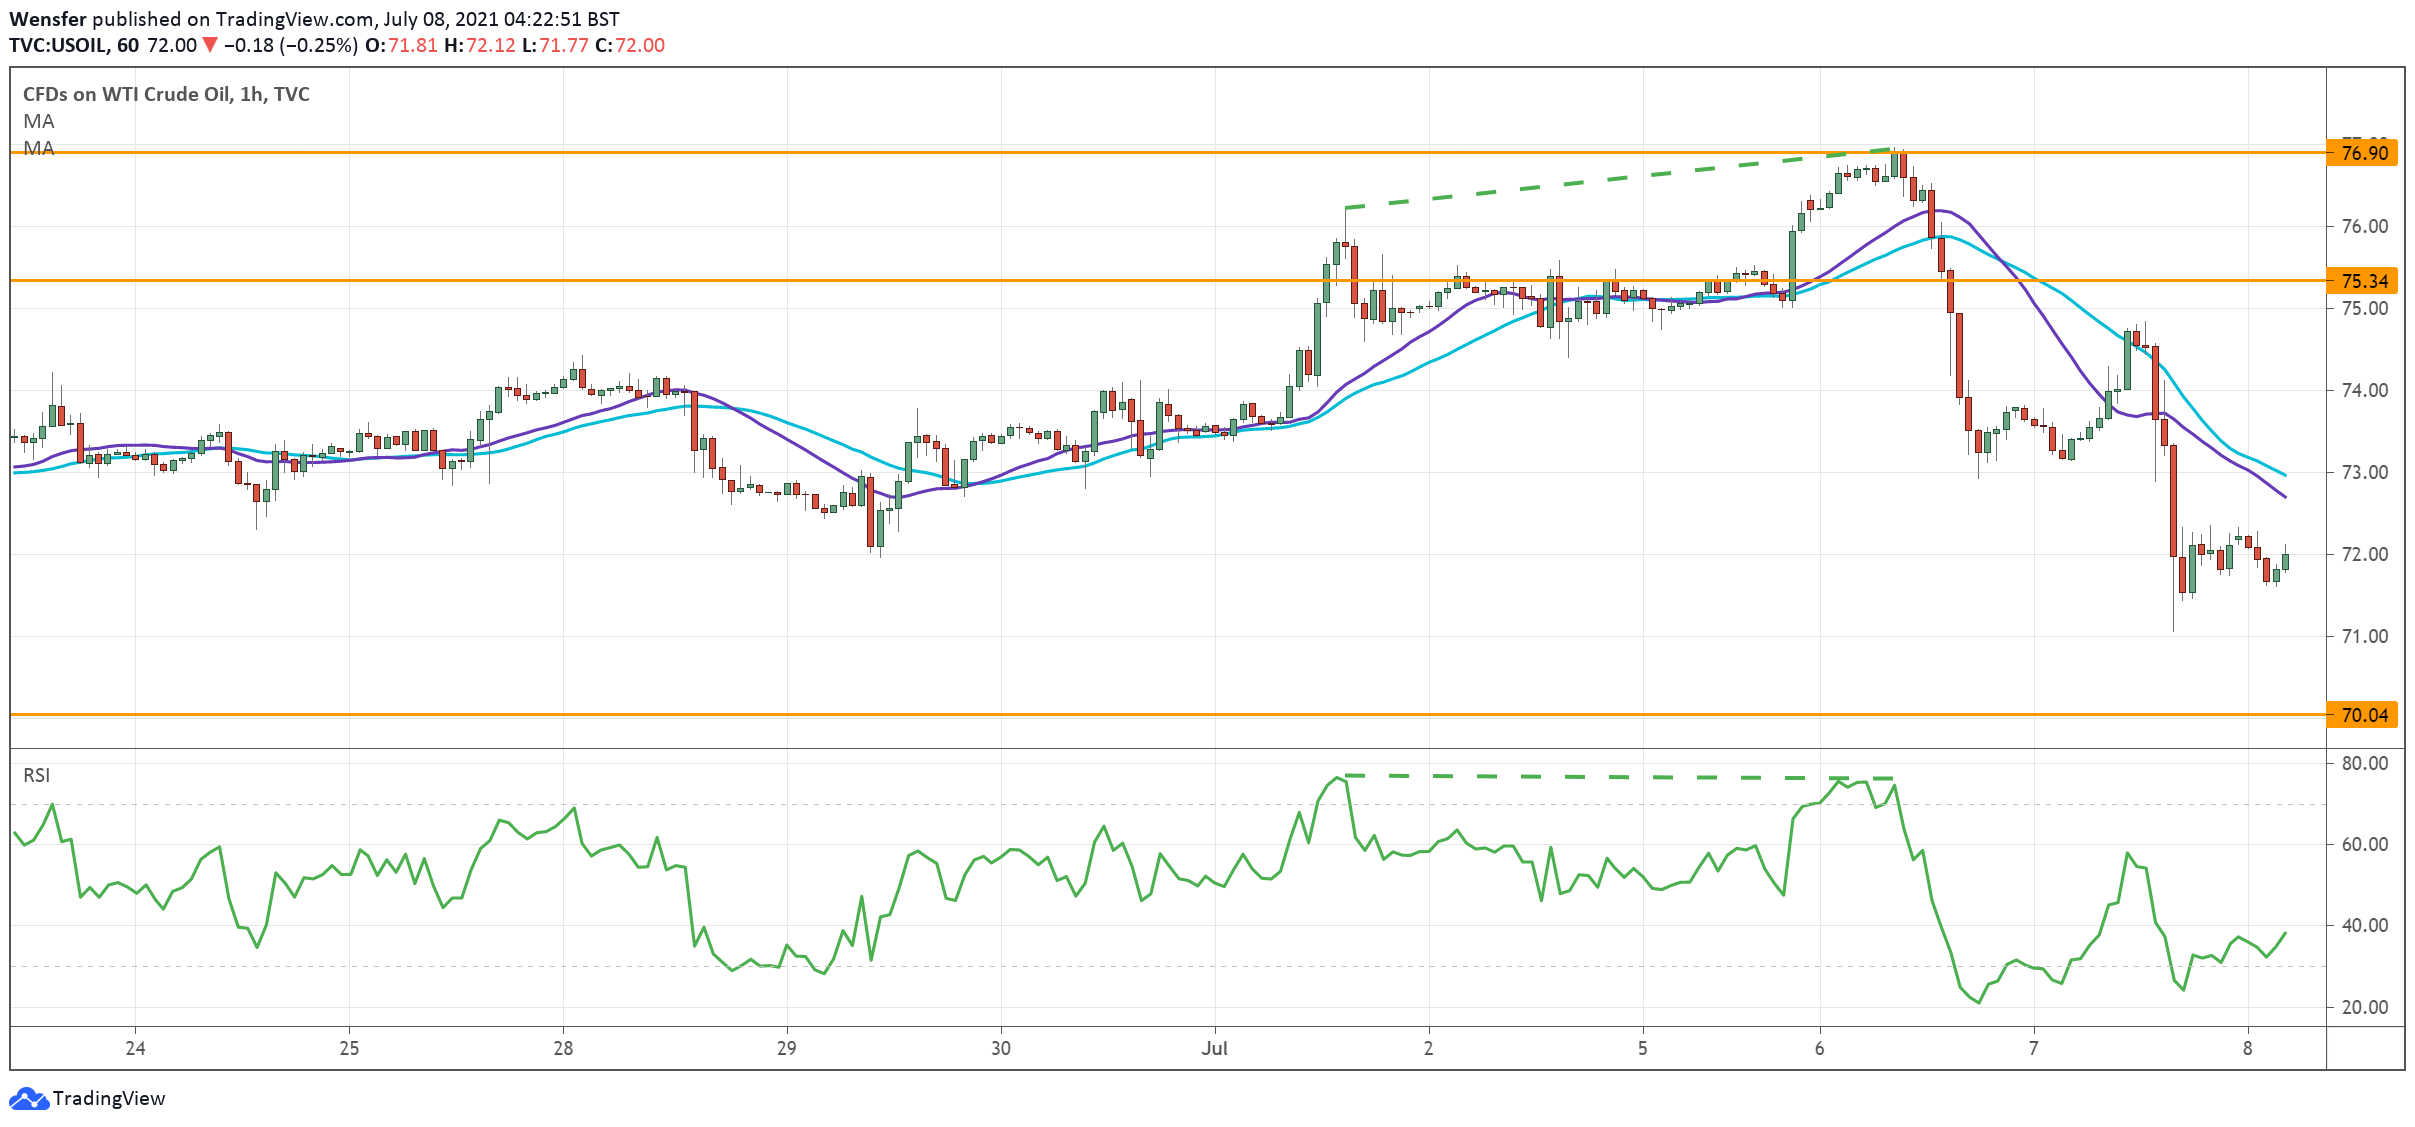
Oil plunges as the OPEC+ deadlock over supply, fuels concerns for a price war.
The RSI divergence already indicated a loss in the upward momentum.
Price’s successive drop below 75.00, then 73.60, is the confirmation of a correction. Strong momentum suggests that buyers are forced to run for cover.
The bears are pushing for the psychological level of 70.00. Below that, the rising trendline (68.40) from April 2020 would be critical support. 75.30 is now the resistance in case of a rebound.
XAU/USD Meets Key Resistance
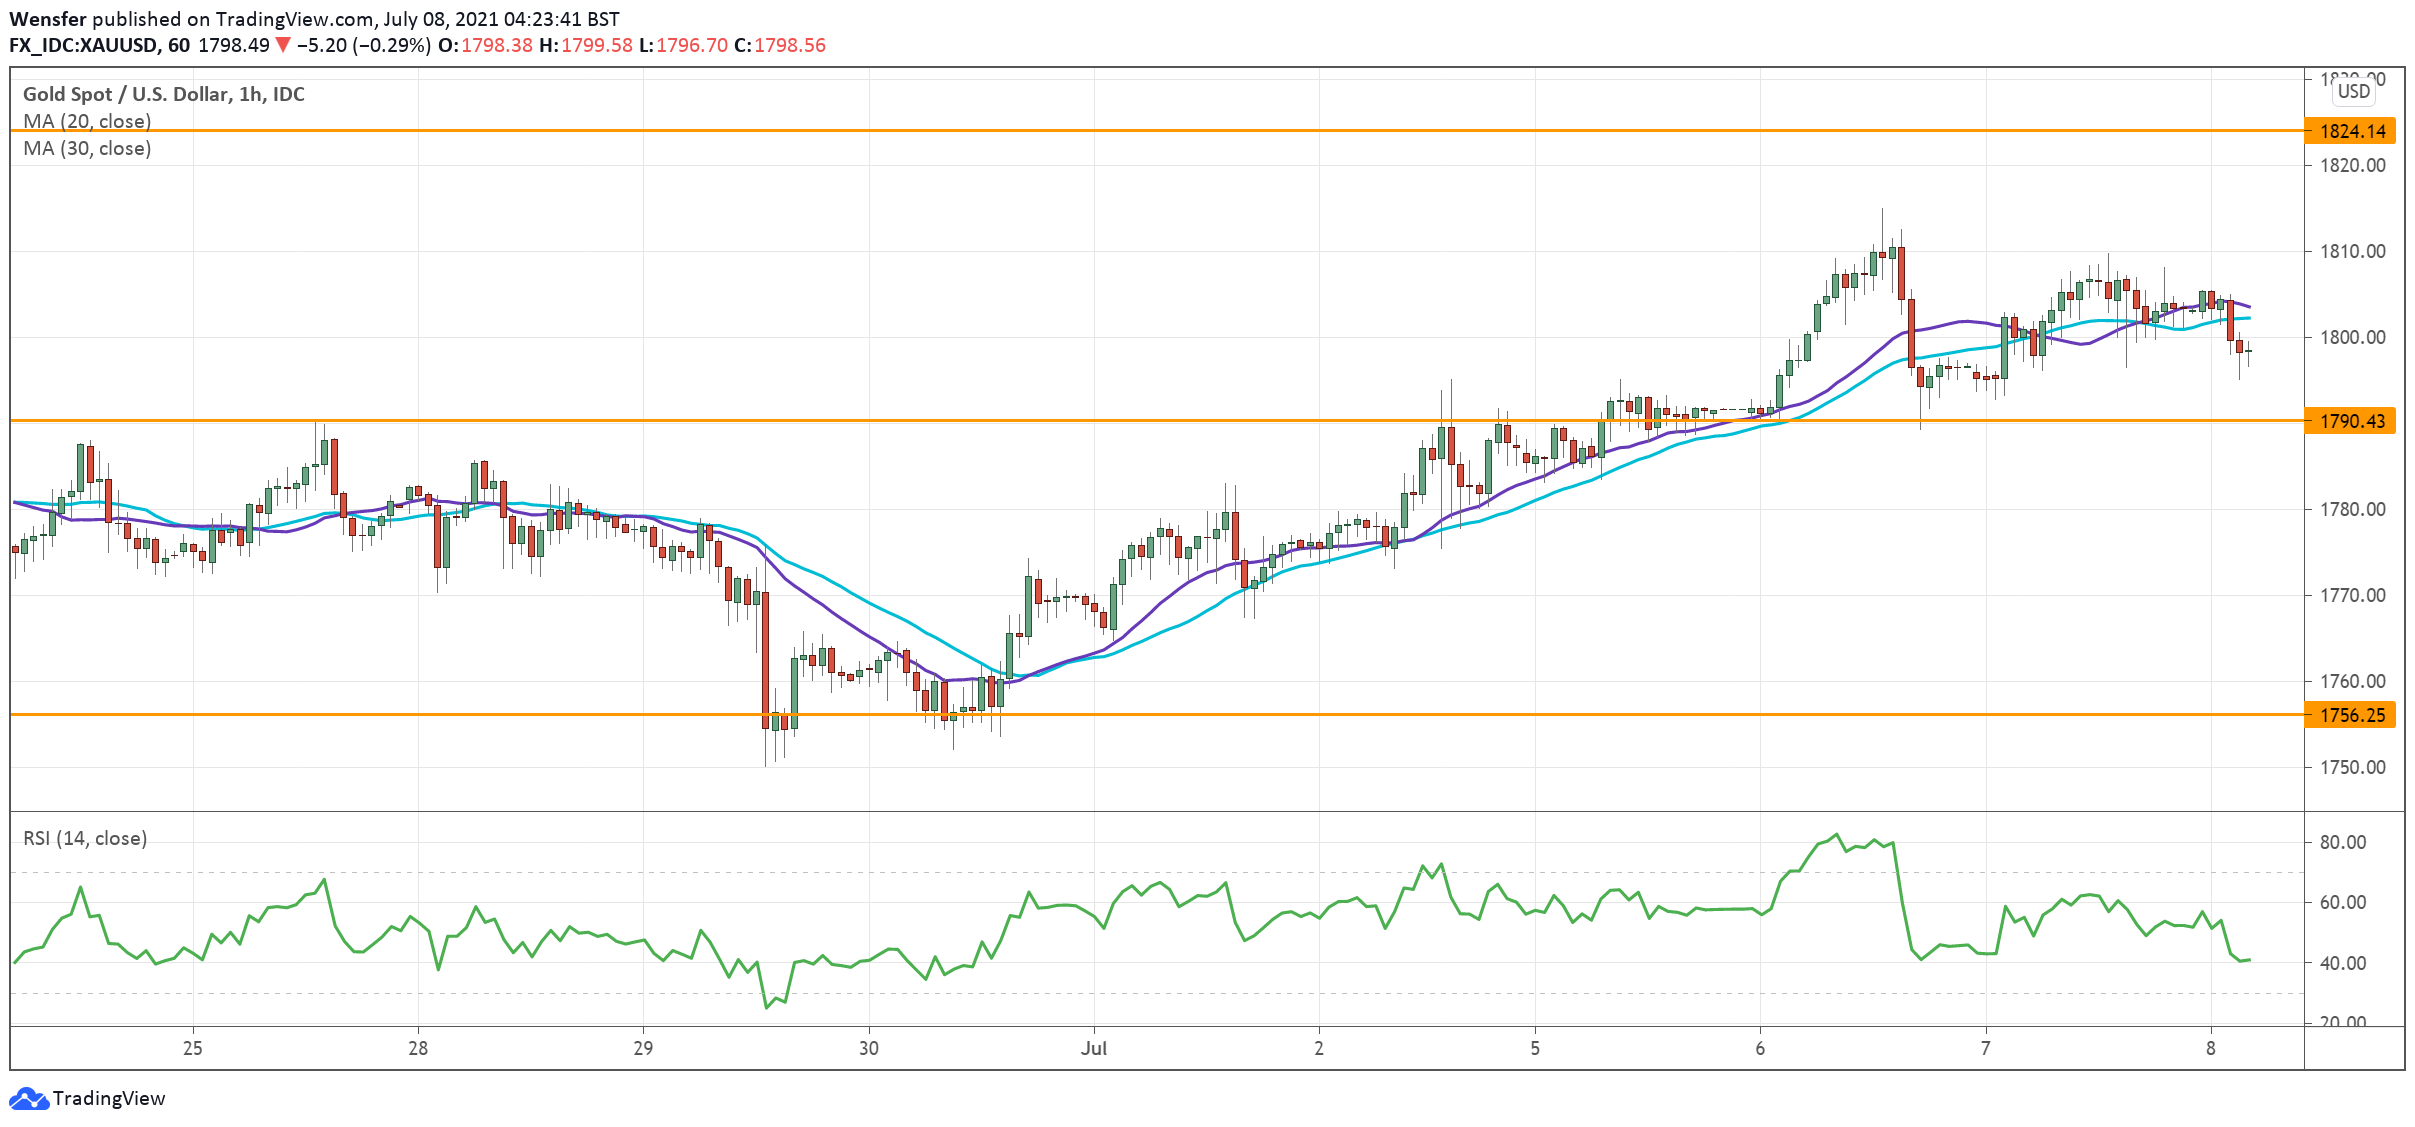
Gold continues to recover as US Treasury yields soften.
The non-yielding metal has slowly cleared the resistance at 1795, which had the benefit of attracting trend followers in joining the rebound.
The former supply area around 1790 has turned into a demand area. The RSI has returned to neutral territory. 1824 is a major hurdle ahead. A bullish breakout could raise volatility and confirm the reversal.
However, a fall below 1790 would dent intraday optimism and trigger a sell-off to retest 1760.
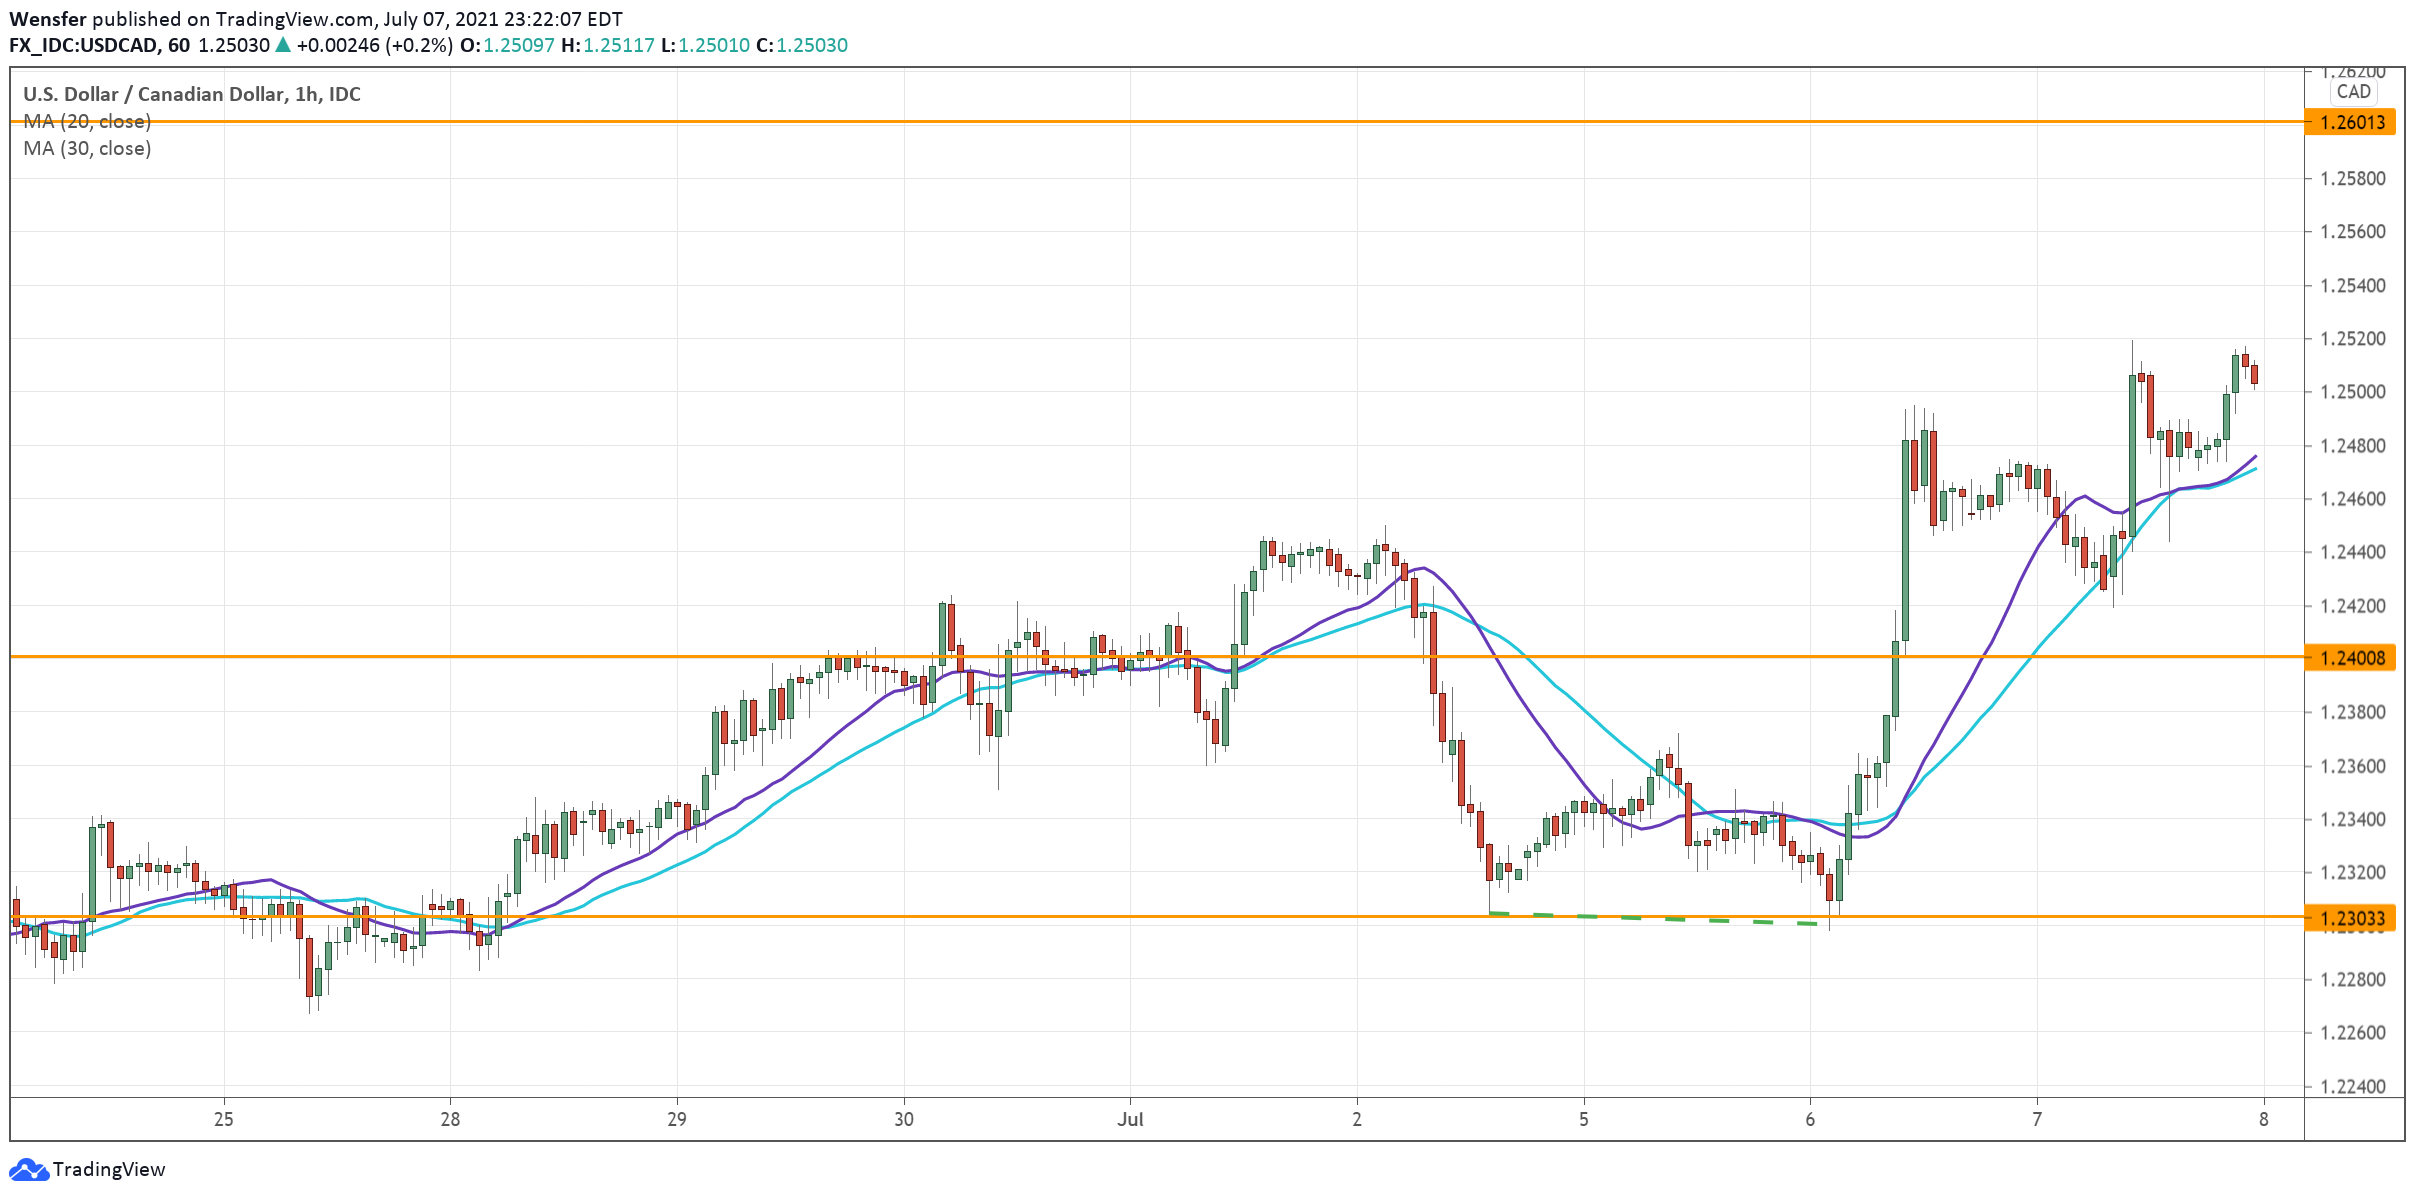
USD/CAD Rallies Above Recent Peak
The US dollar keeps the high ground after the FOMC minutes delivered no surprises. The greenback saw a strong bid around the important support at 1.2300.
The RSI divergence suggests that the selling pressure has waned in this demand area. The latest bounce above the previous high at 1.2470 is the confirmation the bulls were looking for.
The pair may resume its uptrend and 1.2600 would be the next target. A temporary pullback driven by an overbought RSI may seek support around 1.2400.
Currency Market Cautiousness Vs Mild Stock Market Optimism
The US dollar renewed three-month highs against a basket of major currencies last night, but its advance came to a halt after the publication of FOMC minutes.
The minutes note that the Fed is ready to begin discussions on winding down emergency measures at its upcoming meetings. Some representatives also stated that several indicators favour an earlier start to the unwinding than before.
Interestingly, with the FOMC comments reasonably bullish for the dollar, we saw markets "selling the facts", i.e. intensifying dollar selling. Elsewhere, the US S&P500 managed to gain support on the intraday decline and close at all-time highs.
Taking a step back, however, the broader picture is by no means so optimistic. The daily charts of the currency and commodity markets show persistent bear pressure, indicating a potential trend reversal.
The USDJPY maintains a downtrend despite the positive equity market dynamics, which indicates the demand for defensive low-yielding assets. This is also evidenced by an active sell-off in high-yielding EM currencies and the Canadian and Australian dollars, with AUDUSD now at 8-month lows. Like earlier this week, the main interest in the dollar forms at the start of the US session, suggesting a push to the safe-heavens in the debt markets.
Thus, the market is in a relatively contradictory situation with positive stock market trends and wariness on the debt and currency markets. The stock market is now full of small retail investors, which is why we believe the dynamics in debt and FX are most illustrative.
Retail investors should be wary that the big players in global markets are already closing the reflationary trade, selling stocks gently on the upside, as they bet that the peak of the recovery has passed.
A persistent strengthening of the dollar sooner rather than later could pull the stock market reversal triggering a correction. This is especially true when one considers that retail investors are being cut back on external support (unemployment programmes are being wound down, and no new cheques are being paid) and that inflation and softening lockdowns are bringing back the relevance of spending on many services and commodities.
The RSI index on the daily charts of the Nasdaq100 was at its highs since last August yesterday, marking an impressive local overbought situation. In this environment, short-term buyers of equities may find it more advantageous to watch from the sidelines for a couple of days and not rush to buy out intraday drawdowns.