Sample Category Title
Yen Extends Rally, Crosses Below 110
The Japanese yen is up sharply on Thursday. In the European session, USD/JPY is trading at 109.92, down 0.63% on the day. In the Asian session, the pair touched a low of 109.75, its lowest level since June 21.
FOMC minutes a non-event
The was plenty of anticipation ahead of the release of the FOMC minutes on Wednesday, with investors hoping that the minutes would provide some clues as to when the Fed might begin scaling back its bond purchases. In the end, however, the release turned out to be a sleeper, and market reaction was muted.
The minutes indicated that policymakers discussed tapering at the June policy meeting, but there is no appetite on the part of most members to take any action. Some members called for a taper, arguing that the economic recovery was moving more quickly than expected and inflation was on the rise. Still, the dominant view was that currently there was no need at this time for any shift in policy, as the economy still needed to make “substantial further progress”. There were no clues as to the timing of a taper, but one takeaway from the minutes is that there is only limited support for any reduction in QE.
Bottom line? The Fed continues to “talk about talking about tapering.”
In Japan, Prime Minister Yoshihide Suga faces an election in the autumn, and election season often means economic goodies. According to a Bloomberg report, Suga is expected to unveil a stimulus package of between 20-30 billion yen before the election, in order to shore up weak electoral support. The government has been criticized for its poor handling of the Covid pandemic, including a sluggish vaccine rollout. An increase in economic stimulus should kick-start the weak economy, which has been hampered by health restrictions to contain Covid.
USD/JPY Technical
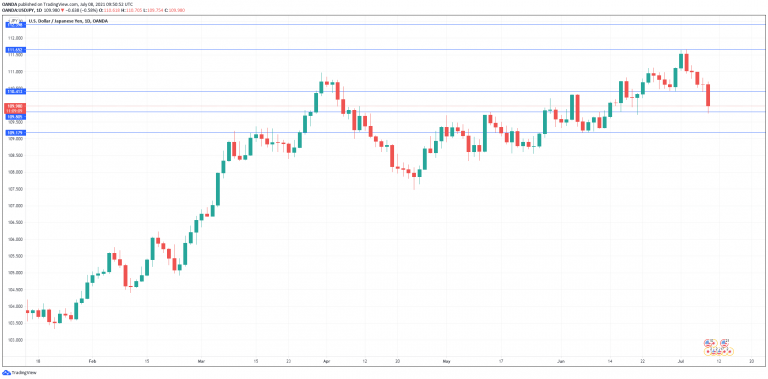
- USD/JPY has broken below support at 110.41 and 109.80. The next support level is 109.18
- On the upside, there is resistance at 111.65 and 112.88
Content Of The Fed’s Meeting Minutes
The dollar continued to rise for a third consecutive day near a three-month high level yesterday while US stockmarkets were also on the rise as S&P 500 and Nasdaq traded at record high levels, while Dow Jones also covered some ground. The Fed's minutes for the bank's mid-June meeting, which were released reaffirmed the bank's for tapering its asset purchases as soon as this year. Fed policymakers seem to be of the opinion that substantial further progress on economic recovery "was generally seen as not having yet been met," yet some policymakers expect the economic recovery to continue the bank must be ready to act if inflation or other upside risks materialise. Some policymakers felt that conditions for tapering the bank's QE program may be "met somewhat earlier than they had anticipated," while others saw required more clarity in the data according to the minutes. The bullish bias seems to continue, and we may see the markets focusing today on the release of the US weekly initial jobless claims figure.
The USD index continued to rise and tested the 92.75 (R1) resistance line. We tend to maintain a bullish outlook for the index, given that it continues to follow the upward trendline incepted since the 6th of July. We note that the RSI indicator below our 4-hour chart is near the reading of 70 implying that the bulls still have the upper hand. Should the bulls actually maintain their control over the index's direction, we may see the Dollar Index breaking the 92.75 (R1) resistance line and aim for the 93.45 (R2) resistance level. Should the bears take over, we may see the index reversing course, breaking the prementioned upward trendline and aim if not break the 92.30 (S1) support line.
EUR traders await Lagarde's speech
Today the ECB is expected to unveil the results of the its 18-month strategy review, which is to redefine the bank's inflation target and also clear how the bank perceives its role in fighting climate change. It should be noted that it's the bank's fist review in 18 years and the new strategy may signal the initiation of one of the biggest transformations for the relatively young central bank. The ECB is expected to part from its current wording of “close but below 2%” inflation target and adopt a clear-cut 2%, which in the past had given the impression of the bank worrying about inflation overshooting its target rather than undershooting it. The main question is whether the bank is willing to allow for inflation to overshoot its target on a temporary basis in order to rebalance the market more or less like the Fed, yet such a scenario may face fierce competition from the inflation worried Germans and BuBa President Weidman. Nevertheless, should clues for such a scenario be present in Lagarde's press conference, it could allow for bearish tendencies to emerge for EUR. EUR/USD continued to drop yesterday testing the 1.1785 (S1) support line. We tend to maintain a bearish outlook for the pair yet the pair seems to find considerable support at the 1.1785 (S1) level. For our bearish outlook to change in favour of a bias for a sideways movement initially we would require a clear breaking of the downward trendline incepted since the 6th of July. Please note that the RSI indicator below our 4-hour chart is at the reading of 30 which confirms the presence of the bears. Also please bear in mind that the divergence between the 50 moving average (green line) and the 200 moving average (orange line) seems to be widening to the downside, which also tends to point towards the bears. If the selling interest for the pair is extended, EUR/USD could break the 1.1785 (S1) support line and aim for the 1.1695 (S2) level. Should the bulls take over, we may see the pair reversing course and aim if not break the 1.1885 (R1) resistance line
Other economic highlights today and the following Asian session:
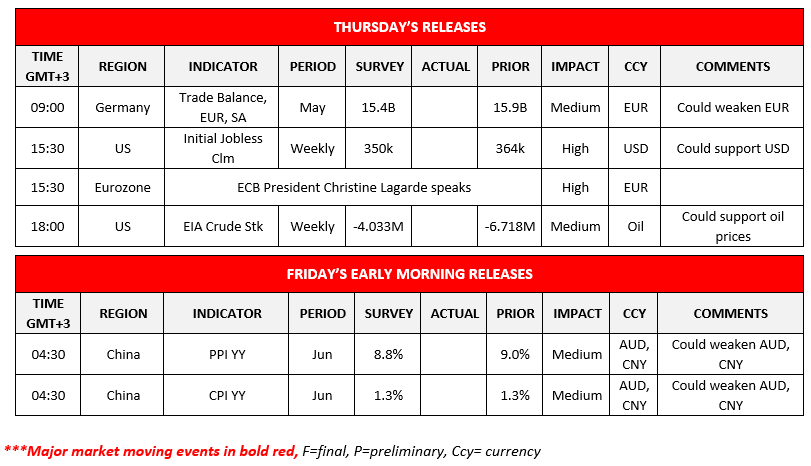
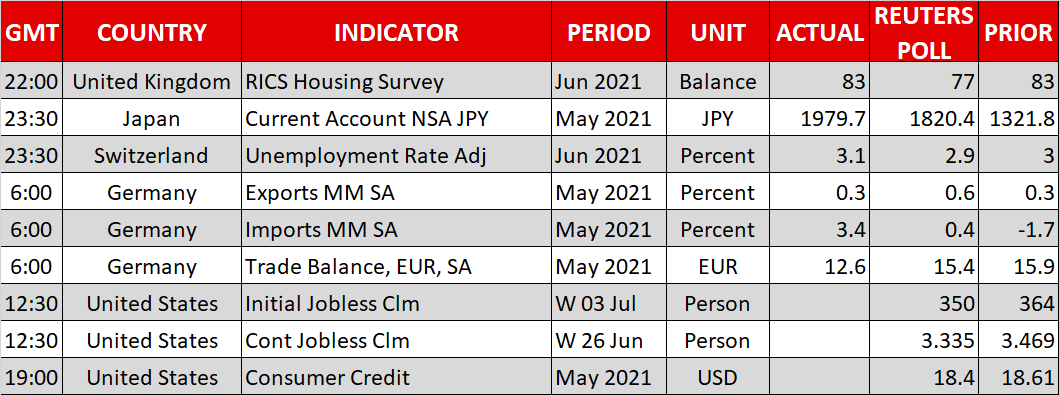
Today we note Germany's trade data for May, the US weekly initial jobless claims figure, the US EIA crude oil inventories figure and China's inflation measures for June.
USD Index H4 Chart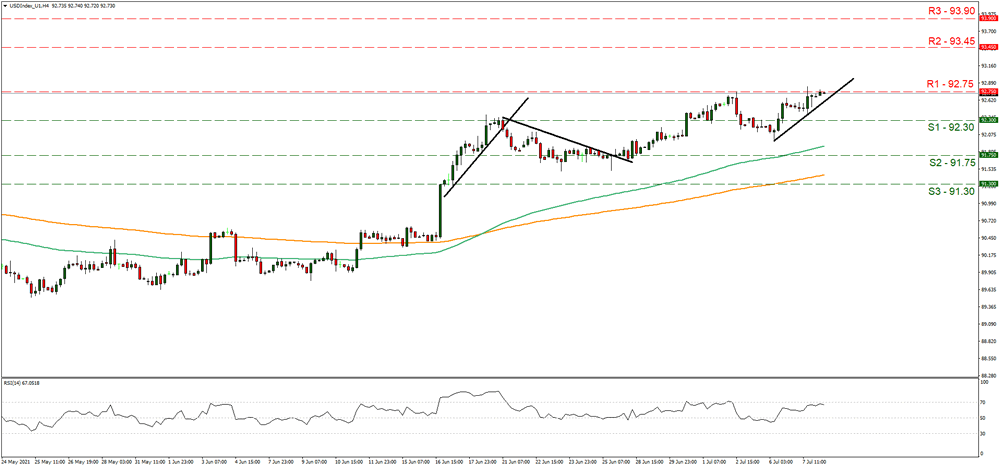
Support: 92.30 (S1), 91.75 (S2), 91.30 (S3)
Resistance: 92.75 (R1), 93.45 (R2), 93.90 (R3)
EUR/USD H4 Chart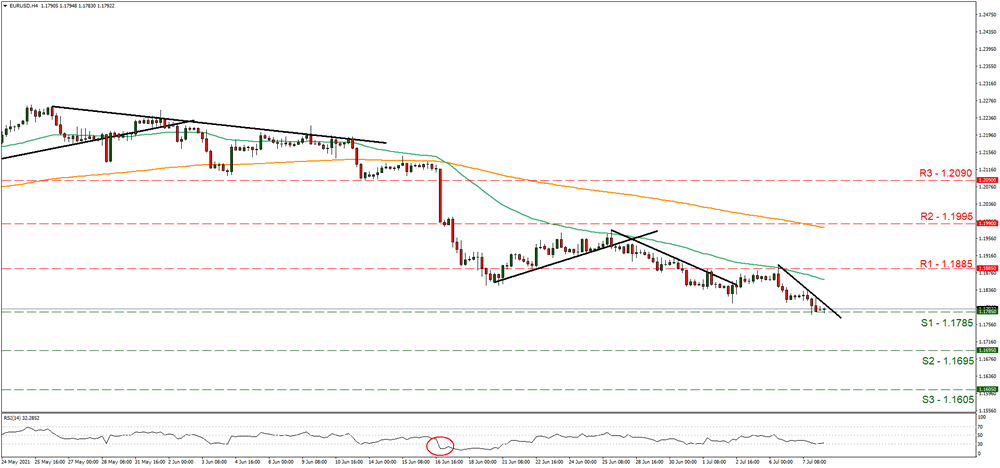
Support: 1.1785 (S1), 1.1695 (S2), 1.1605 (S3)
Resistance: 1.1885 (R1), 1.1995 (R2), 1.2090 (R3)
Dollar Index Is Holding Steady Near A 3-Month High After The FOMC Meeting
According to the minutes of the Fed's meeting in June, which were published yesterday, Fed officials are ready to take steps to reduce asset purchases as early as 2021. But the target for the beginning of the reduction of the monthly bond purchases has not yet been reached. There is some kind of uncertainty about the timeframe of meeting the conditions for a reduction. Opinions are divided. Some representatives expected the target to be reached sooner than expected, while others preferred to wait for incoming economic data. Considering the decrease of the bond yields, the S&P 500 and Nasdaq indices closed at record highs on Wednesday. Technology, commodity, and industrial sectors were the leaders of the growth.
The European stock market closed in the green zone. Shares of mining companies and producers of sports goods were the leaders of the growth. The market was also supported by the European Commission's forecasts of the economic growth in the euro area for the current and next year. According to a new forecast, the European economy will grow by 4.8% this year and by 4.5% next year. Also, the ECB has agreed to set a new inflation target of 2%.
Oil prices are correcting. Investors are waiting for new signs of progress in negotiations to increase production and resolve the dispute between Saudi Arabia and the UAE. But the minister of Energy of Saudi Arabia, Abdulaziz bin Salman admitted that the next meeting of the OPEC+ coalition might not take place until August. The oil market remains in a state of uncertainty for now. However, analysts of JPMorgan Chase are sure that OPEC+ countries will agree upon a monthly increase of oil production from August and count on the growth of oil prices to $80 per barrel.
The situation in the precious metals market remains unchanged. The reduction of profitability of government obligations led to the increase in gold and silver prices. The fundamental picture is now in favor of growth in prices of precious metals.
Asian stocks fell to a six-week low as the sell-off of technology companies continues amid China's move to close a loophole for Chinese IT giants to float IPOs in the US. The Chinese government has begun drafting amendments to legislation regulating the listing of Chinese companies abroad. The amendments would allow the authorities to block Chinese companies from listing abroad even if its organization is registered outside China.
Main market quotes:
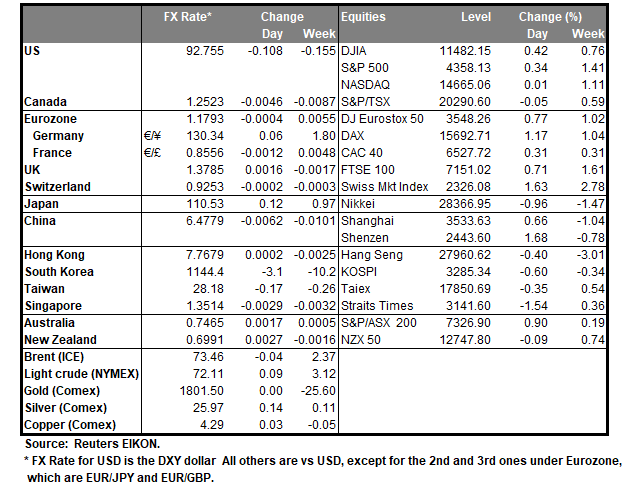
- S&P 500 (F) 4,358.13 +14.59 (+0.34%)
- Dow Jones 34,681.79 +104.42 (+0.30%)
- DAX 15,692.71 +181.33 (+1.17%)
- FTSE 100 7,151.02 +50.14 (+0.71%)
- USD Index 92.71 +0.16 (+0.18%)
Important events:
- Australia RBA Governor Philip Lowe’s Speech at 05:30 (GMT+3);
- ECB Monetary Policy Statement at 14:30 (GMT+3);
- US Initial Jobless Claims (w/w) at 15:30 (GMT+3);
- US Natural Gas Storage (w/w) at 17:30 (GMT+3);
- US Crude Oil Inventories (w/w) at 18:00 (GMT+3).
USD/CHF Technical Analysis: Dves Below 100-MA As Selling Orders Amplify
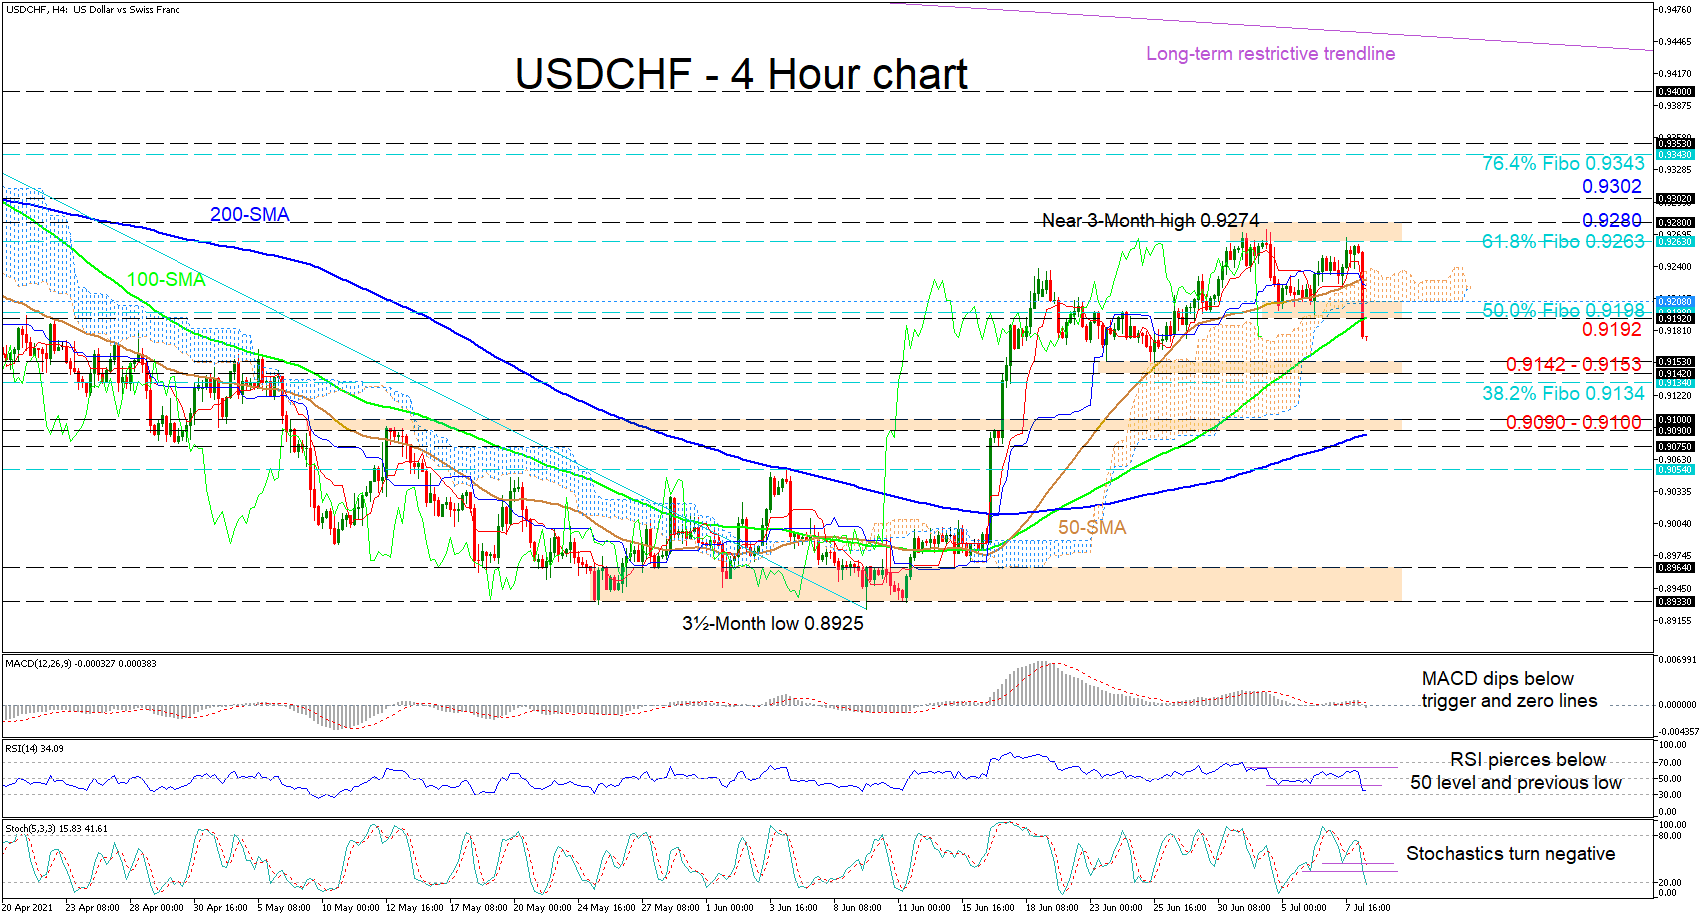
USDCHF has been struggling to decisively extend past the 61.8% Fibonacci retracement of the down leg from 0.9472 until 0.8925, only ticking to a near 3-month peak of 0.9274. In spite of the climbing simple moving averages (SMAs) defending the recent price improvements, negative pressures have managed to steer the price beneath the support section between the Ichimoku cloud’s floor and the 100-period SMA at 0.9192.
The Ichimoku lines are tilting lower, while the short-term oscillators are reflecting the surge in selling interest, which started in the proximity of the 61.8% Fibo. The MACD has nudged beneath its red trigger line and a tad below the zero threshold, while the RSI is growing increasingly negative. The negatively charged stochastic oscillator is also presently promoting downward tendencies.
As things stand with the bears breaking the important 0.9192-0.9208 support section, the pair looks set to snowball. That said, downside limitations around the 0.9142-0.9153 region, along with the 38.2% Fibo of 0.9134 lingering beneath, could barricade additional declines in the pair. However, should the price deteriorate further, the 0.9090-0.9100 boundary could then come into play.
If the 0.9142-0.9153 support base helps the pair gather its feet, initial resistance could emanate from the 0.9192-0.9208 zone. Improvements in the pair may then falter around the 50-period SMA, otherwise, a push above the cloud may encourage buyers to challenge the minor ceiling formed between the 61.8% Fibo and the April 9 high of 0.9280. Gaining confidence, buyers may then examine the 0.9302 barrier before piloting for the 76.4% Fibo of 0.9343.
Summarizing, negative pressures appear to be dictating the short-term price direction. However, for USDCHF to retain a positive spark, the price would need to endure above the 0.9153 lows from the end of June.
EUR/CHF Outlook: Risk Aversion Lifts Safe-Haven Swiss Franc To A Seven-Month High Vs Euro
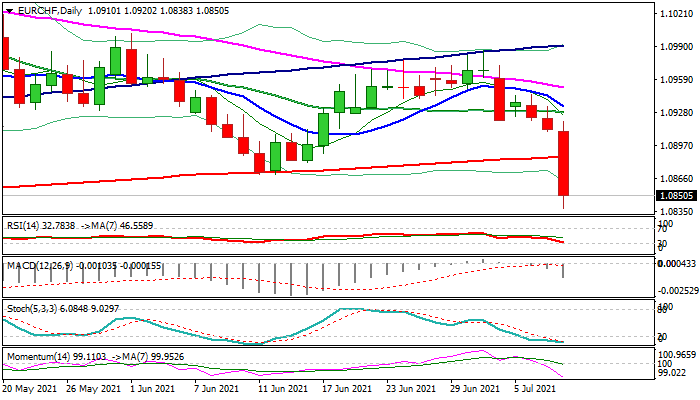
The EURCHF cross was among top losers in early Thursday’s trading, being down 0.7% so far, as fresh risk aversion strongly lifted safe-haven Swiss franc.
Bears took out strong technical supports at 1.0886/70 (200DMA / June 11 former low) and probed through pivotal Fibo support at 1.0844 (61.8% of 1.0654/1.1151 advance), pressuring the lower boundary of bear channel (1.0828) from 2021 high at 1.1151 (Mar 4).
Fresh weakness signals continuation of larger downtrend, which could accelerate further on break of channel trendline support.
Bears see close below 1.0870 as a minimum requirement to remain intact, while clear break of 1.0844 Fibo level would boost bearish signal.
Daily moving averages turned to full bearish setup, while negative momentum rises sharply, supporting the action.
Bearish weekly studies signal more room for descend.
However, overextended daily techs suggest bears may take a breather before resuming, with extended upticks to stay capped under 200DMA (now reverted to solid resistance) and provide better opportunities to re-join the downtrend.
Res: 1.0870, 1.0886, 1.0920, 1.0927.
Sup: 1.0828, 1.0810, 1.0784, 1.0738.
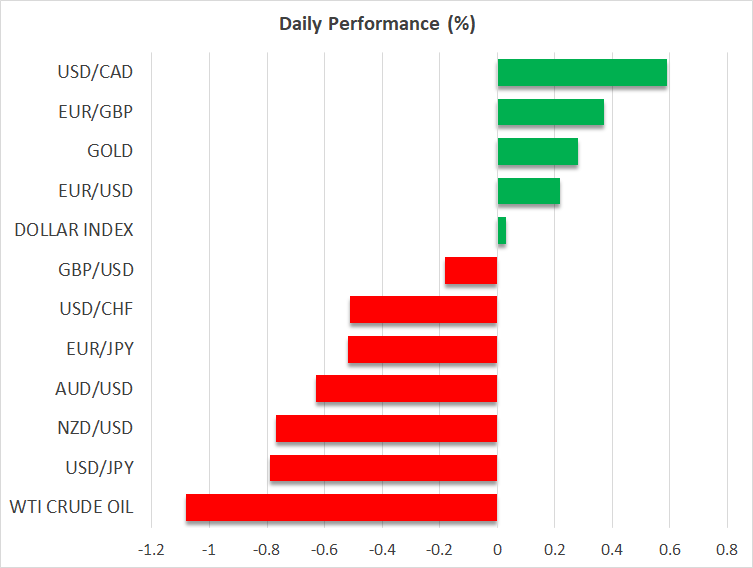
Special ECB Announcement Could Rock The Euro Today
- ECB set to announce higher inflation target, Lagarde presser to follow
- Dollar little changed after Fed minutes, yen shines as yields crumble
- Stocks retreat amid Chinese regulatory crackdown, oil tanks
Euro braces for special ECB announcement
The European Central Bank will announce the outcome of its strategic policy review at 11:00 GMT today, with a press conference by President Lagarde to follow 90 minutes later. Reports suggest the ECB will raise its inflation target to 2% and signal it will tolerate an overshoot if the situation demands it.
This would essentially lock the ECB into negative interest rates for a longer period of time. It hasn’t been able to hit its inflation target for a decade now, so raising it further would imply it intends to keep its foot heavy on the money accelerator for years.
That’s bad news for the euro. It would crystalize the imminent divergence of monetary policy between the Eurozone and America. With the Fed moving towards higher rates but the ECB staying committed to negative rates, yield differentials could widen further in the dollar’s favor in the coming years, which argues for a lower euro/dollar over time. 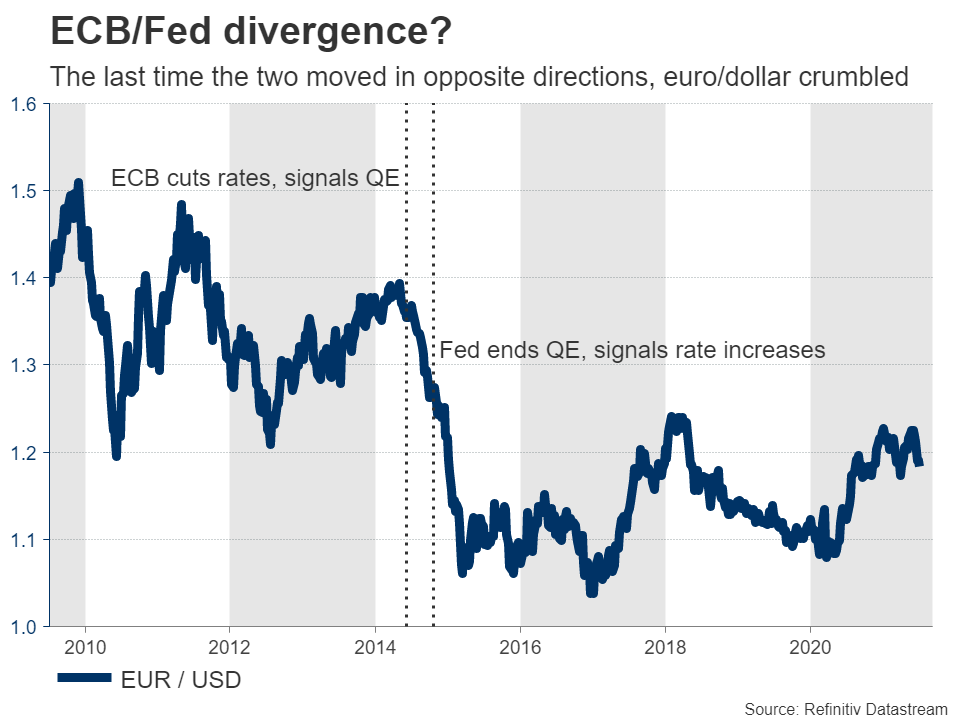
The last time the world’s two biggest central banks drifted in opposite directions was in 2014-2015, a period of carnage for euro/dollar. The market impact might be smaller this time as the Fed will likely be less aggressive, but the direction seems clear.
Dollar unfazed by Fed minutes, yen powers higher
The US dollar remained near its recent highs yesterday, taking little damage from the minutes of the latest FOMC meeting. The general sense in the minutes was that the Fed is not in a rush to scale back its humongous asset purchase program, but is moving closer to doing so.
‘Various’ officials expected the conditions for tapering to be met ‘somewhat earlier’, while ‘some’ others suggested they would have the information soon to make a judgment call on the economy. Nothing new there. The Fed is still on track to announce it will dial back its asset purchases in the fall, likely after a strong warning signal in August. For all that to happen, we need a couple of scorching-hot jobs reports.
Meanwhile, the Japanese yen has been the biggest winner from the latest demolition in Treasury yields. Market participants are still mystified by what is pushing bond yields lower. Is it an epic short squeeze that’s still playing out, is it big banks swallowing up bonds for collateral purposes, or is the market really pricing slower growth and lower inflation?
We’ll find out the answer by whether the move persists or not. For now, this has lit a fire under the yen, which shines in an environment of lower rates and risk aversion. Still, with central banks across the world moving towards higher rates but the Bank of Japan not following suit, the big picture seems gloomy.
Stocks drop as Chinese regulators flex
In the stock market, the S&P 500 and Nasdaq closed at another record high yesterday, but the mood has deteriorated today. Futures point to losses of around 1% for the major US indices when Wall Street opens today, in sympathy to equities in Hong Kong which are down almost 3% after new regulations from Beijing.
Chinese regulators continue to tighten the screws on large multinationals, especially in the tech sector, announcing rules that would allow them to block companies from listing overseas. Tech heavyweights like Tencent and Alibaba are down 4% today.
Finally, oil prices remain under heavy pressure for a third session. Market participants seem to be pricing in the risk of a ‘pump at will’ endgame from OPEC as the fallout between Saudi Arabia and the UAE continues, with the latest bouts of risk aversion adding fuel to the retreat.
A look at falling AUD/JPY and GBP/CHF as risk aversion intensifies
Risk aversion comes back again today, as led by the -807pts, or -2.89%, free fall in Hong Kong HSI. At the time of writing, FTSE and DAX are down -1.4% while CAC is down -1.9%. DOW future is down around -400pts. In the bond markets, Germany 10-year yield is down -0.04 at -0.33. US 10-year yield dis down -0.05 at -1.265.
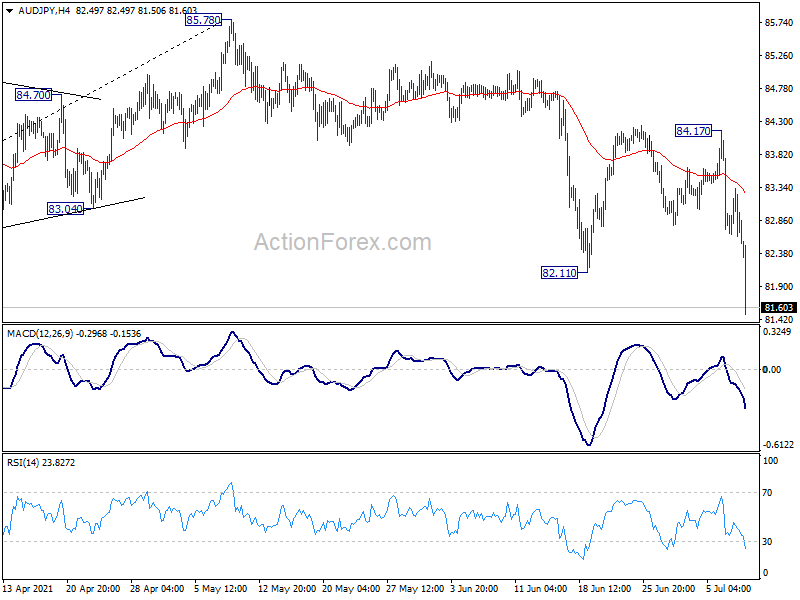
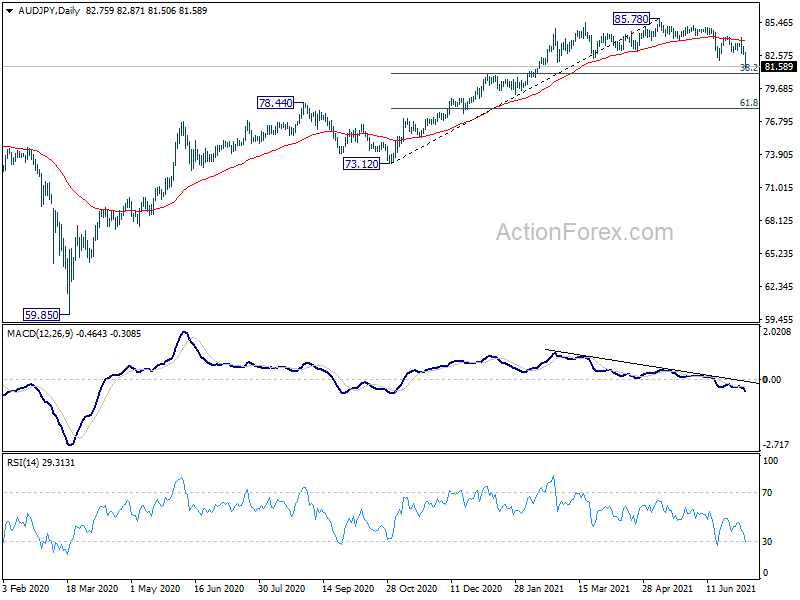
In the currency markets, Yen and Swiss Franc are currently the strongest ones. AUD/JPY breaks through 82.11 support to as low as 81.50 so far, resuming whole decline from 85.78. Rejection by 55 day EMA is a clear sign of near term bearishness. Such decline is seen as correcting the rise from 73.12 for the moment. Hence, we'd look for strong support from 38.2% retracement of 73.12 to 85.78 at 80.94 to contain downside and bring rebound. However, sustained break of 80.94 will argue that it's indeed correcting whole up trend from 59.85 and target 73.12/78.44 support zone.
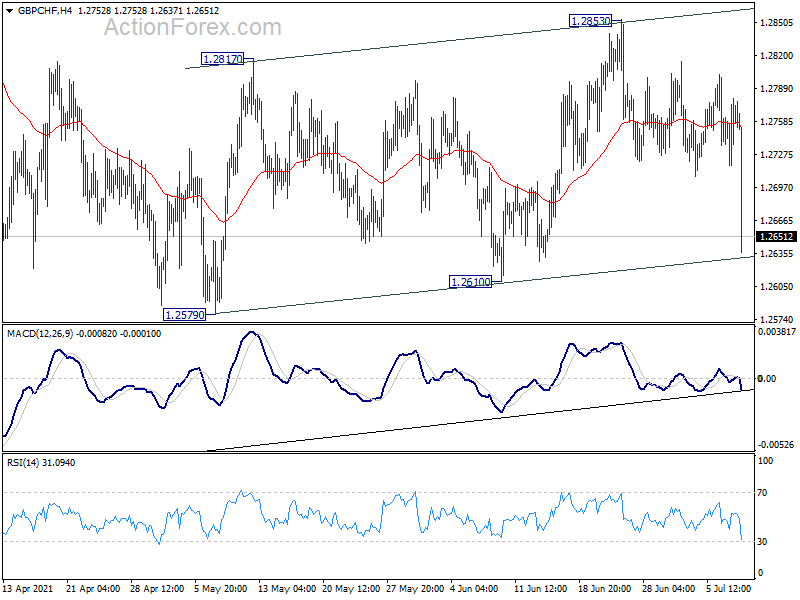
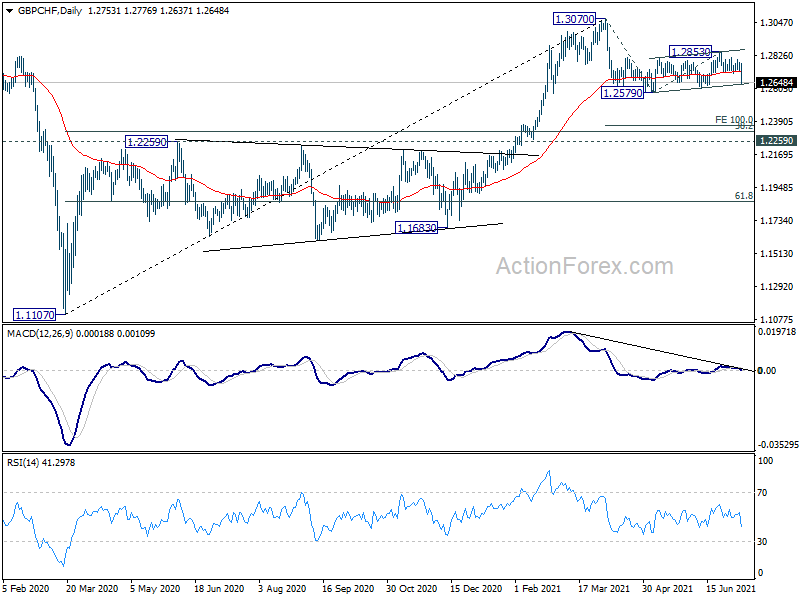
GBP/CHF's sharp fall today now argues that consolidation from 1.2579 might have completed with three waves up to 1.2853. Immediate focus is now on 1.2579/2610 support zone. Decisive break there will confirm this bearish case and target 100% projection of 1.3070 to 1.2579 from 1.2853 at 1.2362. At this point, we'd expect strong support around 1.2259 resistance turned support to contain downside and bring rebound.
The Analytical Overview Of The Main Currency Pairs
The EUR/USD currency pair
Technical indicators of the currency pair:
Prev Open: 1.1823
Prev Close: 1.1790
% chg. over the last day: -0.28%
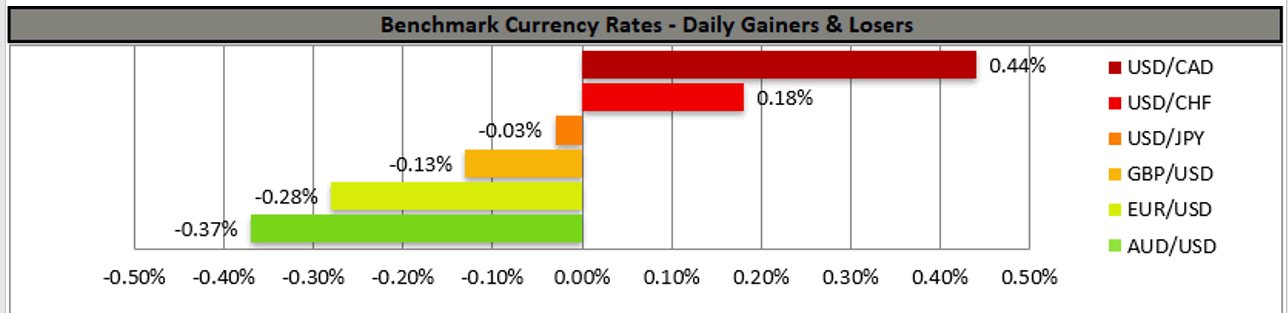
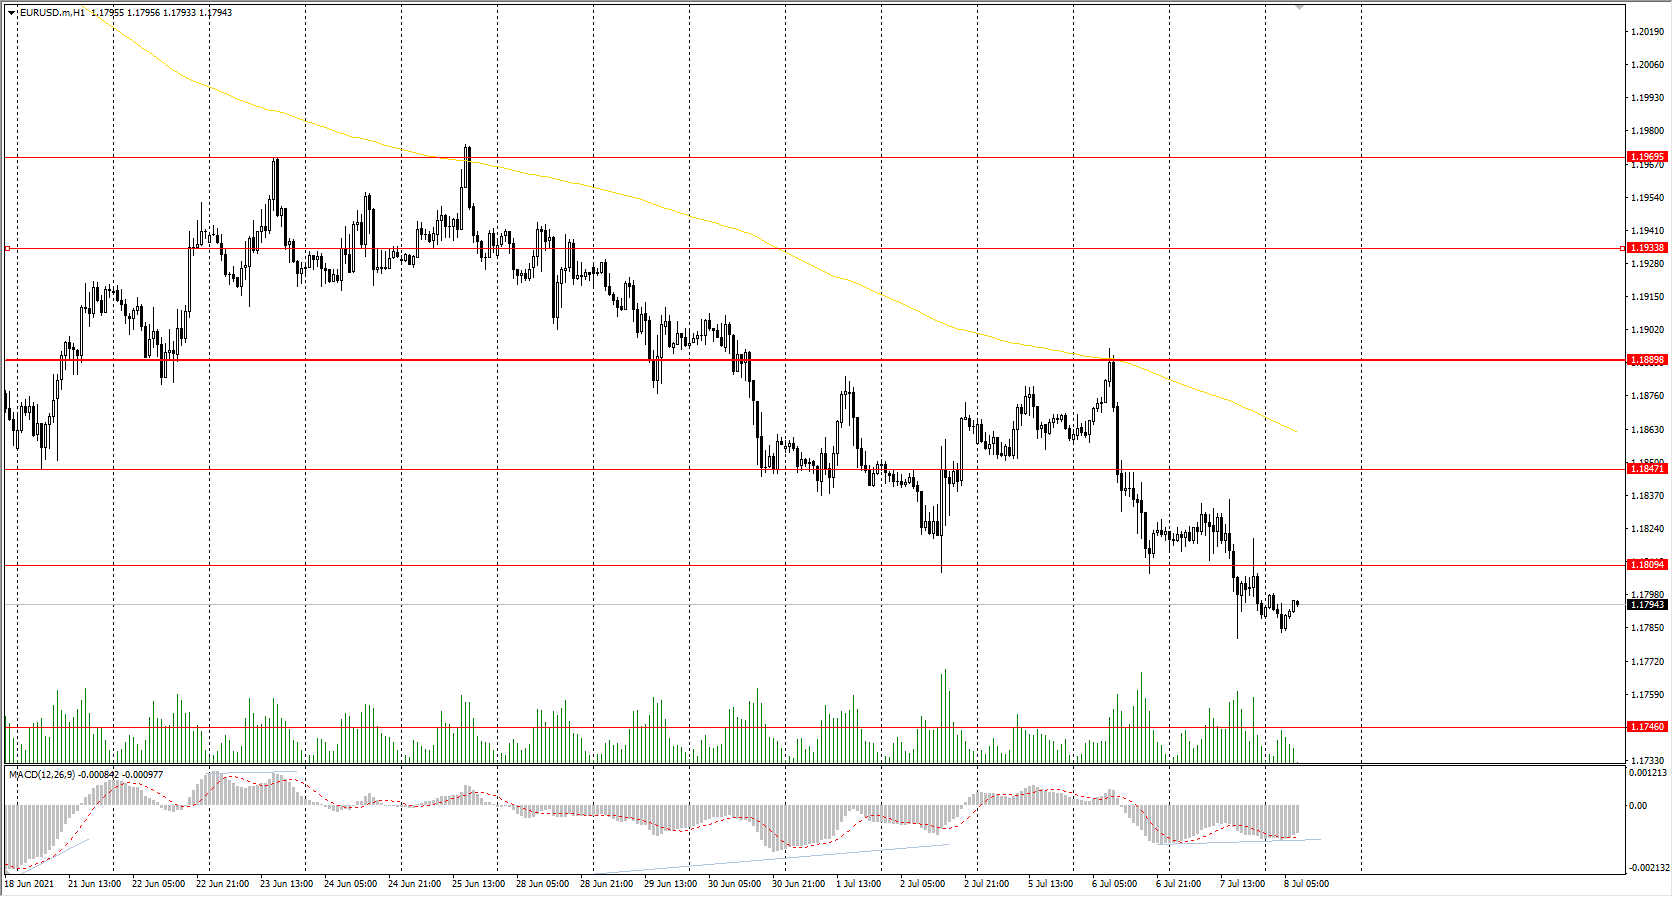
Because of the dollar index growth, the EUR/USD currency pair fell by another 0.28%, breaking through the support level of 1.1809. The overall fundamental picture is starting to change as the United States is planning to cut the QE program, and Europe is not doing it so far. It will push the EUR/USD quotes down. The ECB monetary policy meeting is expected today.
Trading recommendations
Support levels: 1.1746, 1.1609
Resistance levels: 1.1809, 1.1847, 1.1889, 1.1934, 1.1969
The trend is still bearish. The price broke through the support level of 1.1809 and fixed lower. The initiative from the buyers is very weak. The MACD indicator is in the negative zone, and there are signs of divergence on the higher timeframes. Under such market conditions, it is better to trade intraday. To sell, traders need to wait for a pullback to the nearest resistance levels. It is necessary to be careful with buy trades, as the price can drop to the next support level.
Alternative scenario: if the price breaks out through the 1.1889 resistance level and fixes above, the general uptrend is likely to be resumed.
News feed for 2021.07.08:
- ECB Monetary Policy Statement at 14:30 (GMT+3);
- US Initial Jobless Claims (w/w) at 15:30 (GMT+3).
The GBP/USD currency pair
Technical indicators of the currency pair:
Prev Open: 1.3795
Prev Close: 1.3798
% chg. over the last day: +0.02%
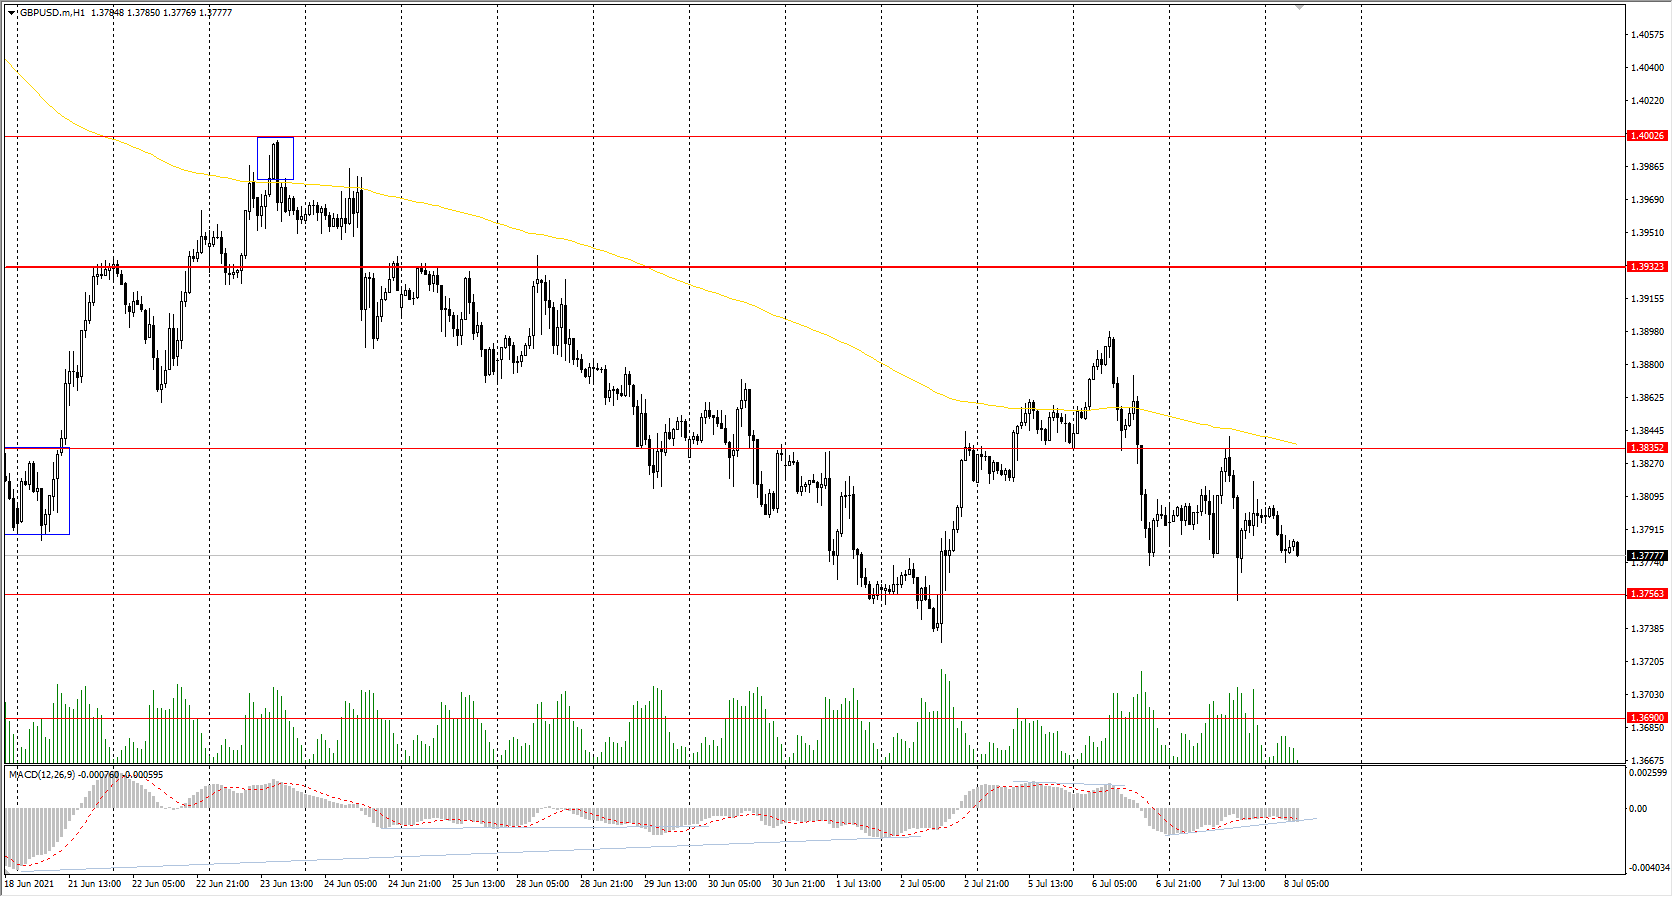
The British pound looks a bit more confident than the euro. First of all, it is because the UK is a major supplier of Brent crude oil. However, for the last 2 days, oil is also correcting downward, so against the background of the dollar index growth, the British pound is slowly sliding to the support level of 1.3756.
Trading recommendations
Support levels: 1.3756
Resistance levels: 1.3835, 1.3923, 1.4002, 1.4075, 1.4101, 1.4138, 1.4191
The GBP/USD trend is bearish on the H1 timeframe. Buying pressure has become weak now; the price drops below the moving average. The MACD indicator is in the negative zone, but there are signs of divergence. Under such market conditions, traders are better to look for both sell trades from the resistance levels and buy trades from the support levels on the intraday timeframes.
Alternative scenario: if the price breaks out through the 1.3922 resistance level and consolidates above, the bearish scenario is likely to be canceled.
The USD/JPY currency pair
Technical indicators of the currency pair:
Prev Open: 110.61
Prev Close: 110.61
% chg. over the last day: 0.00%
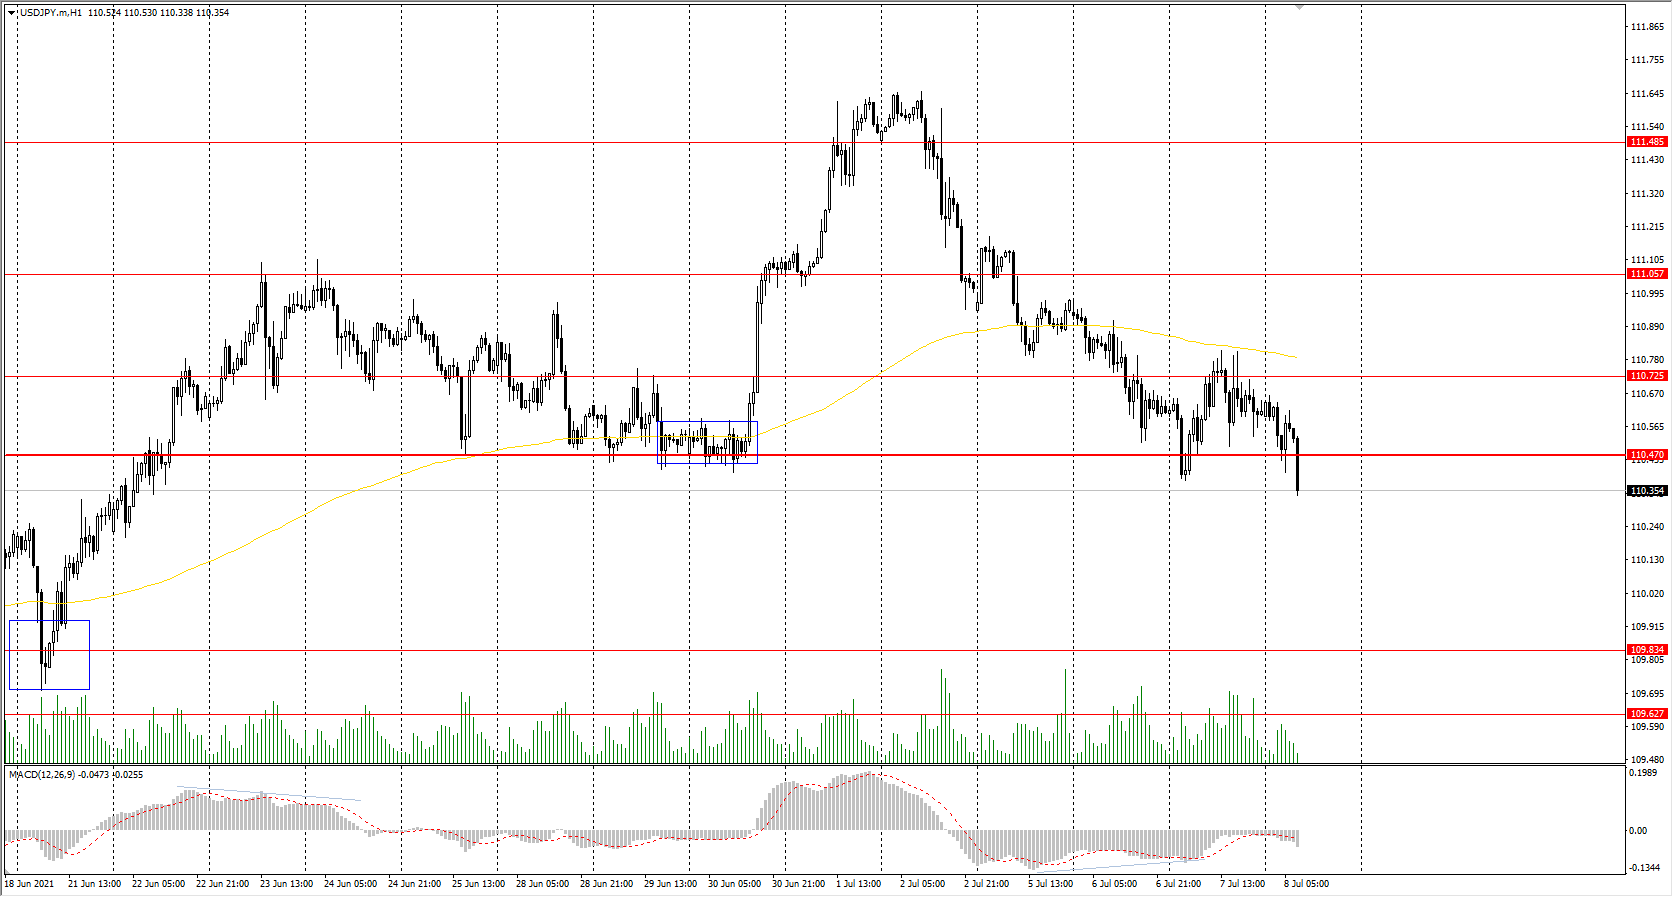
The situation with the USD/JPY currency pair remains the same. The Japanese Yen futures are growing as well as the dollar index futures. It turns out that both currencies are strengthening, even with a slight advantage to the strengthening of the yen. Such a fundamental picture contributes to the formation of trading corridors on the charts.
Trading recommendations
Support levels: 110.47, 109.83, 109.62, 109.31
Resistance levels: 110.73, 111.06, 111.48, 110.73, 112.18
From the point of view of technical analysis, the trend remains bullish. The price reached the change priority level yesterday and tried to break down through it, but the buyers managed to defend their positions. Today, the sellers are trying to break the priority change level again during the morning session. It's better to wait for the price to consolidate below the 110.47 level. There is no optimal entry point for buying now, only if a false breakout occurs and the price sharply returns above the 110.47 level.
Alternative scenario: if the price falls below 110.47, the general downtrend is likely to be resumed.
The USD/CAD currency pair
Technical indicators of the currency pair:
Prev Open: 1.2459
Prev Close: 1.2483
% chg. over the last day: +0.19%
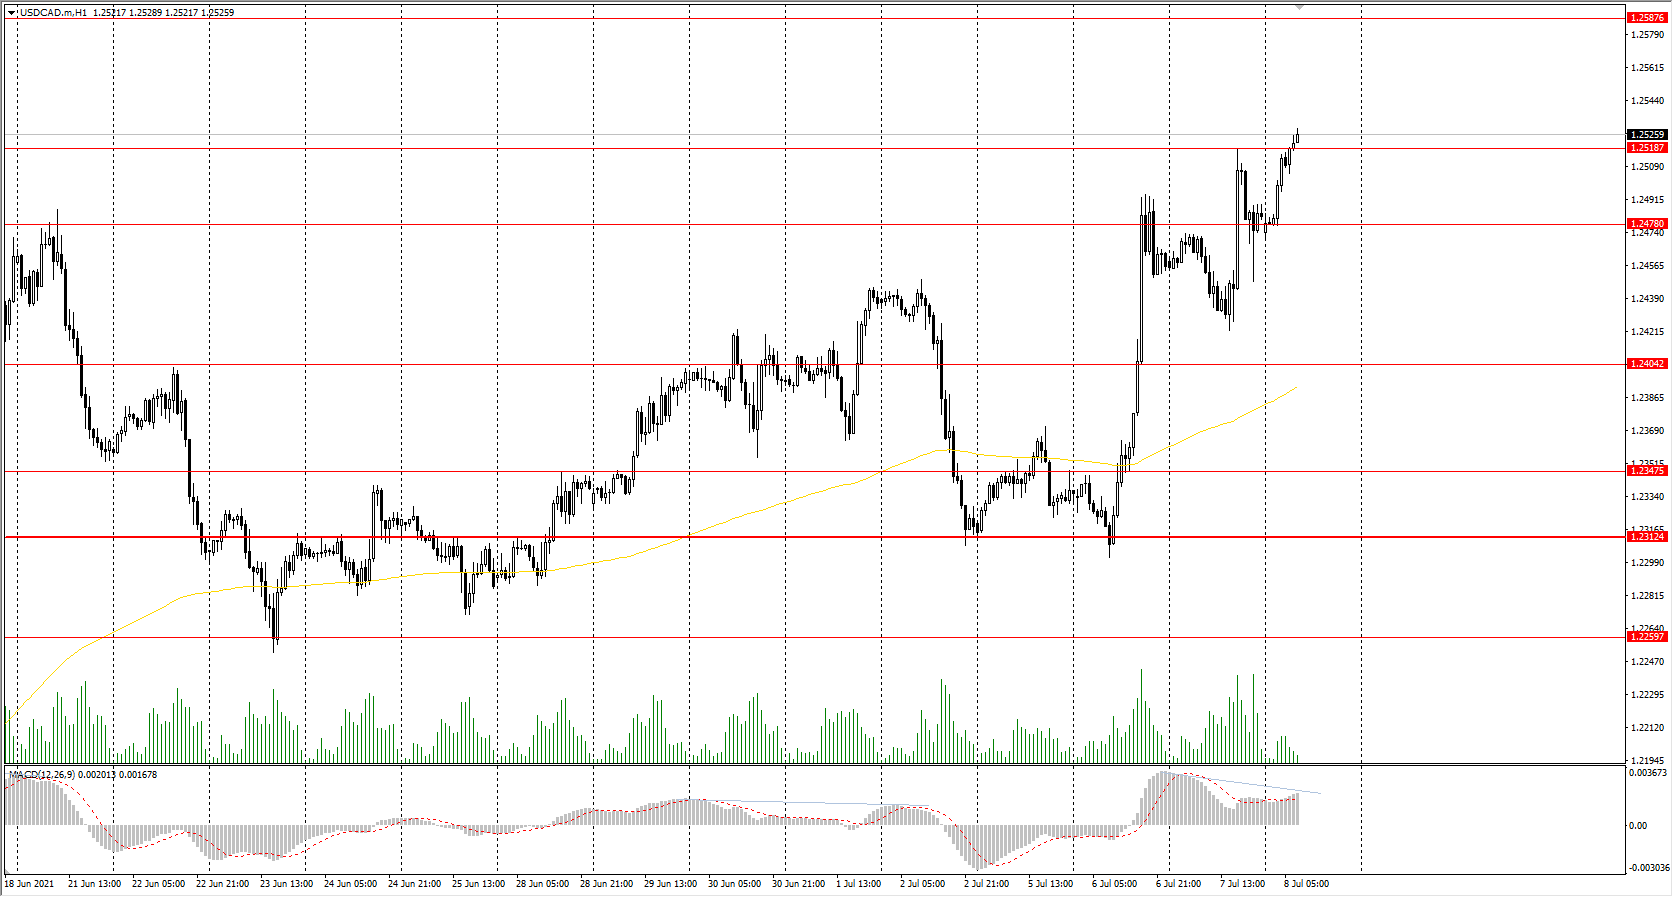
The growth of the dollar index and the fall in oil prices contributes to the upward trend on the USD/CAD currency pair. The price easily breaks throughout all resistance levels, but the first signs of a corrective wave have already appeared.
Trading recommendations
Support levels: 1.2478, 1.2404, 1.2347, 1.2312, 1.2260, 1.2190
Resistance levels: 1.2519, 1.2587
Technically, the trend remains bullish. The price is trading above the moving average, but there is a strong deviation from the midline. The MACD indicator has returned to the positive zone but with signs of divergence. Under such market conditions, it is best to trade on the lower timeframes. Buyers need to wait for a slight pullback to the nearest support levels. Traders can also look for entry points on intraday timeframes for short positions, but only with short targets because it will be trading against the trend.
Alternative scenario: if the price breaks down through the 1.2312 support level and fixes below, the downtrend is likely to be resumed.
Aussie Crashes To Lowest Level In 2021
The Australian dollar has fallen for a third straight day. In the European session, AUD/USD is trading at 0.7428, down 072% on the day.
It’s turning into an ugly week for the Australian dollar, as AUD/USD has fallen by 1.30%. The pair is currently at its lowest level since December 2020.
The Aussie has been hit by a double-edged punch. First, US Jolts Job Openings climbed to a record high of 9.21 million in May, up from a revised 9.19 million in April. This is another signal that the demand for workers continues to outstrip supply. If this situation persists, this will likely lead to upward pressure on wages, and consequently, higher inflation. Investors are concerned that the Fed could tighten policy in order to curb inflation, and tighter policy, especially a rate hike makes the US dollar more attractive.
Dovish Lowe weighs on Aussie
Secondly, RBA Governor Philip Lowe said today that it was likely that QE would be needed in future business cycles. Lowe continues to send out a dovish message to the markets, even though the RBA tightened policy this week and tapered its asset purchase program from AUD 5 billion per week to AUD 4 billion per week. At the policy meeting, Lowe reiterated that he did not expect the bank would raise interest rates before 2024. The Australian dollar initially showed gains after the taper move, but the dovish stance of the RBA brought out the bears and sent the Aussie lower on Wednesday.
The FOMC minutes indicated that policymakers discussed tapering at the last policy meeting, but most members agreed that there was no need at this time for any shifts in policy, as the economy still needed to make “substantial further progress”. The minutes did not shed any light on the critical question of when the Fed might begin to taper, and market reaction was muted.
AUD/USD Technical
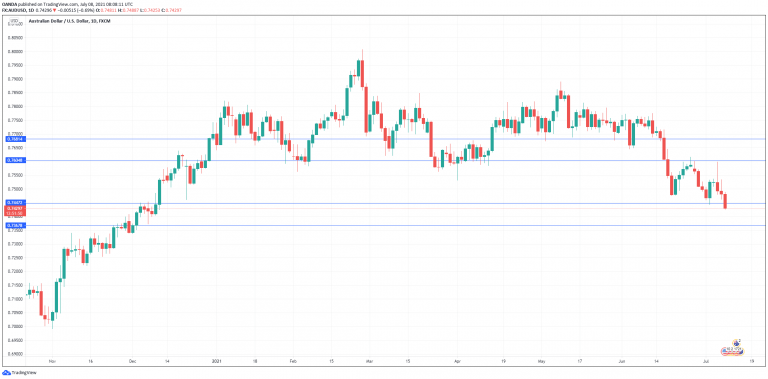
- AUD/USD is testing support at 0.7447. Below, we find support at 0.7367
- On the upside, there is resistance at 0.7604 and 0.7681
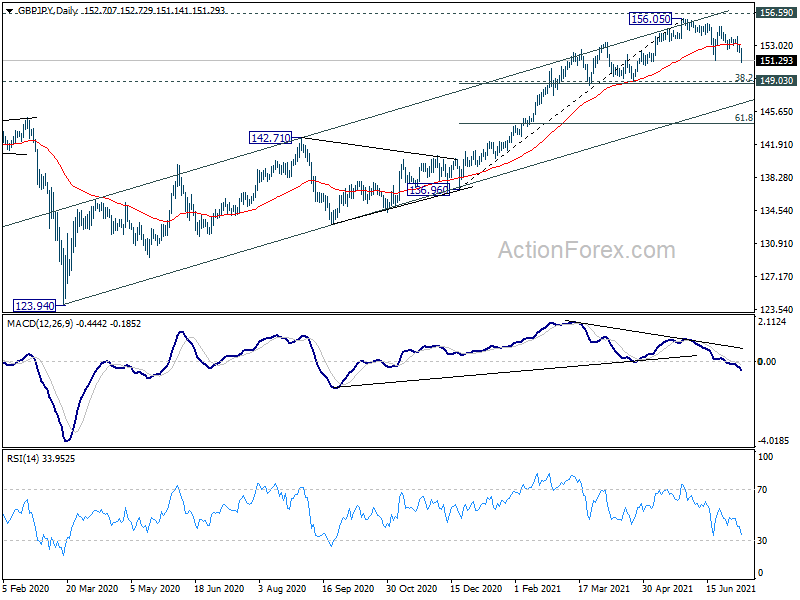
GBP/JPY Daily Outlook
Daily Pivots: (S1) 152.25; (P) 152.71; (R1) 153.14; More...
GBP/JPY's break of 151.28 support confirms resumption of corrective decline from 156.05. Intraday bias stays on the downside for 149.03 support. We'd expect strong support from 38.2% retracement of 136.96 to 156.05 at 148.75 to bring rebound. On the upside, above 153.14 minor resistance will turn bias back to the upside for 155.13 resistance.
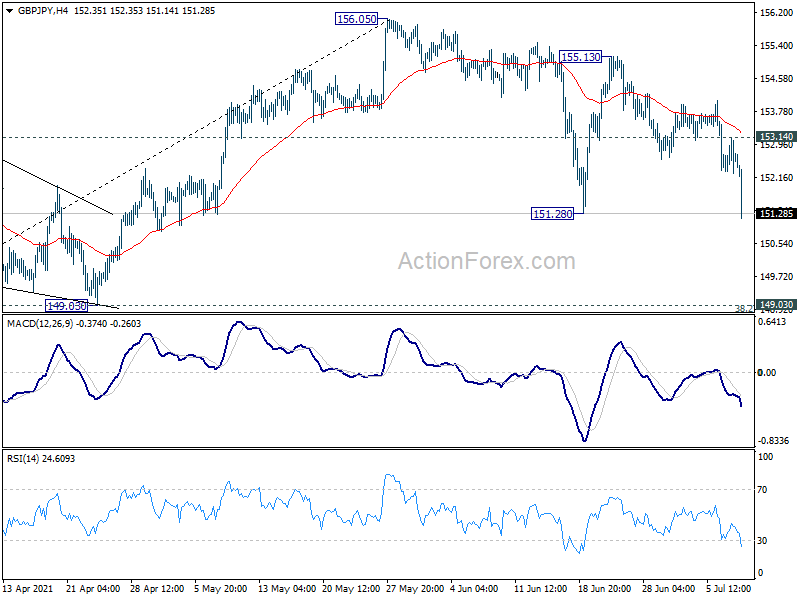
In the bigger picture, rise from 123.94 is seen as the third leg of the pattern from 122.75 (2016 low). Focus is now on 156.59 resistance (2018 high). Sustained break there should confirm long term bullish trend reversal. Next target is 61.8% retracement of 195.86 (2015 high) to 122.75 at 167.93. On the downside, break of 149.03 support is needed to be the first sign of completion of the rise from 123.94. Otherwise, outlook will remain bullish even in case of deep pull back.