Sample Category Title
USDJPY Yen Strength Increasing
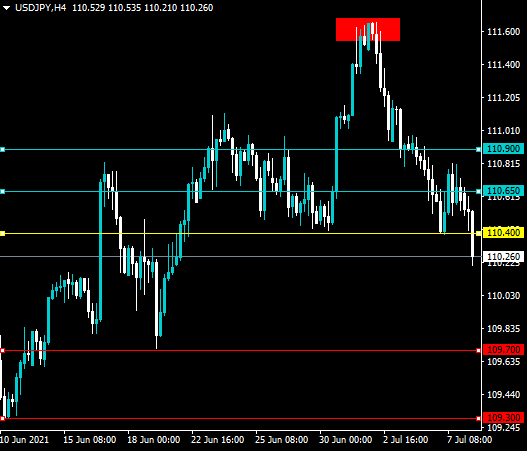
The USJPY pair is quickly reversing recent gains as strength in the Japanese yen currency is even outpacing the US dollar this week. A bearish head and shoulders pattern has been activated on the four-hour time frame after a break under the 110.40 level took place. The pattern is warning that a coming drop towards the 109.70 level could be about to take place in the USDJPY pair, at a minimum.
The USDJPY pair is only bullish while trading above the 110.40 level, key resistance is found at the 110.65 and 110.90 levels.
The USDJPY pair is only bearish while trading below the 110.40 level, key support is found at the 109.70 and 109.30 levels.
EURUSD Could Test 1.1700
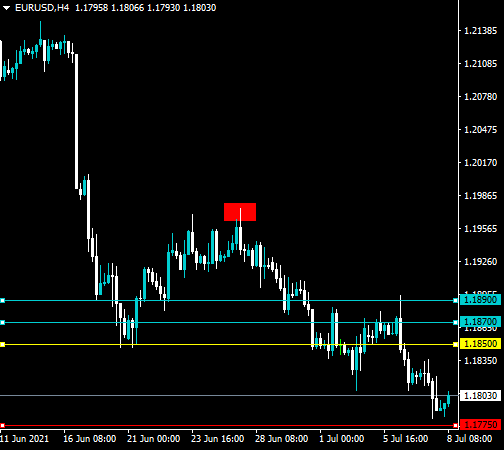
The euro currency has failed to recover higher against the US dollar, with the pair now treading water around the 1.1800 technical area. The four-hour time frame shows that a large head and shoulders pattern is now in play and is warning of further losses while the EURUSD trades under the 1.1850 level. According to the overall size of the pattern the EURUSD pair could test close to the 1.1700 support area.
The EURUSD pair is only bullish while trading above the 1.1850 level, key resistance is found at the 1.1870 and 1.1890 levels.
EURUSD pair is only bearish while trading below the 1.1850 level, key support is found at the 1.1775 and 1.1725 levels.
Daily Tecnical Analysis
EUR/USD
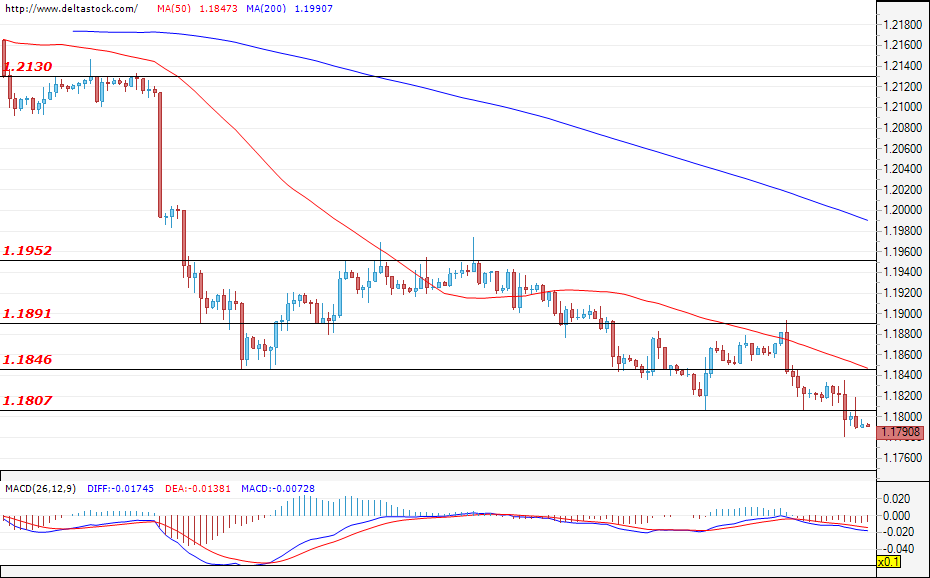
Current level - 1.1790
During yesterday's trading, the EUR/USD fell below the support zone at 1.1807 and, at the time of writing, the pair is still trading below the mentioned level. If the breach is confirmed, new losses and a continuation of the downward move for the euro against the greenback can be expected.. If the bears lose momentum, the first target for the bulls can be found at the resistance level of 1.1846, but only a successful violation of the zone at 1.1952 could lead to a change in the current sentiment. Today, investors will focus on the data for the change in initial jobless claims for the U.S. (12:30 GMT), which could lead to relatively large swings in both directions.
| Resistance | Support | ||
| intraday | intraweek | intraday | intraweek |
| 1.1807 | 1.1890 | 1.1760 | 1.1716 |
| 1.1850 | 1.1952 | 1.1750 | 1.1690 |
USD/JPY
Current level - 110.44
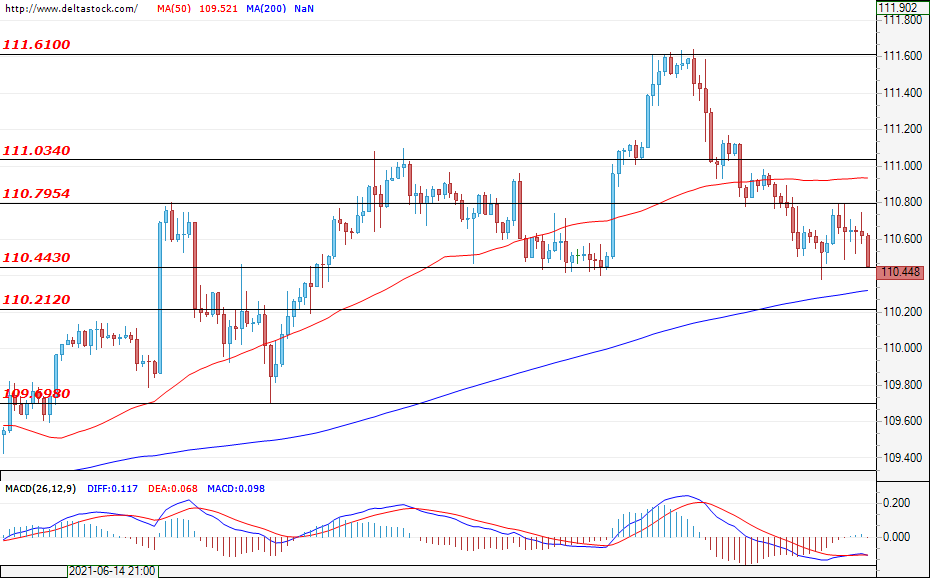
The corrective move of the USD/JPY seems to be limited at the level of 110.44. At the time of writing this analysis, the currency pair is still testing the support zone at 110.44. Despite that, the corrective phase seems to be ending. If the aforementioned level is breached, the U.S. dollar will most likely continue to lose its value against the yen and target the level of 110.21. If the bulls re-enter the market, their first resistance would be the level of 110.79. Only a breach towards the zone at 111.03, however, would signal for a more sustained rally.
| Resistance | Support | ||
| intraday | intraweek | intraday | intraweek |
| 110.79 | 111.61 | 110.44 | 109.69 |
| 111.03 | 112.60 | 110.21 | 109.29 |
GBP/USD
Current level - 1.3780
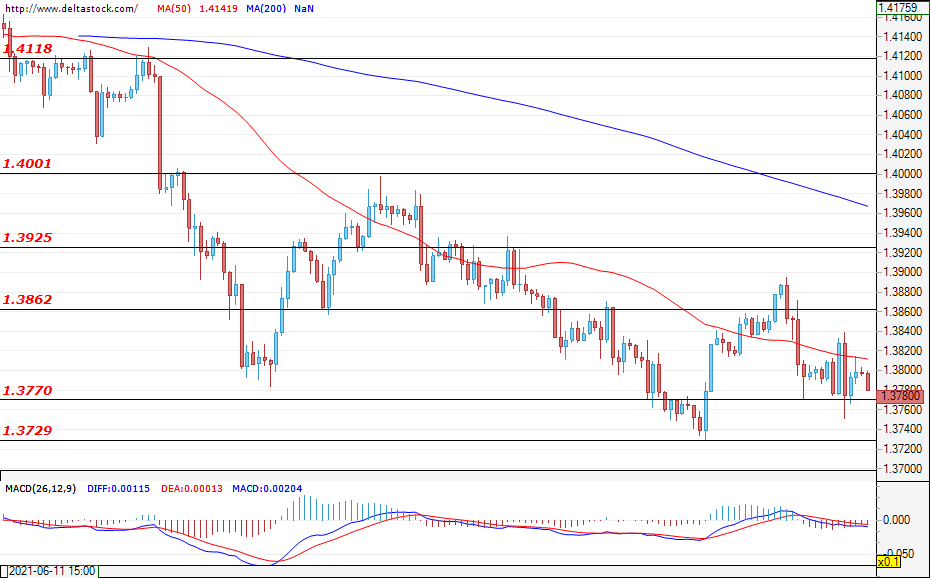
The Cable continues to trade close to the lower border of the zone between 1.3770 and 1.3862. A new test of the mentioned support at 1.3770 is quite likely, but only a successful breach of 1.3729 could lead to bigger losses for the sterling against the dollar and could help the pair reach the support at 1.3655, which is coming from the higher time frames. In the upward direction, а successful attack at the resistance zone of 1.3862 could easily lead to a rally towards the next targets at 1.3925 and 1.4001.
| Resistance | Support | ||
| intraday | intraweek | intraday | intraweek |
| 1.3862 | 1.4000 | 1.3770 | 1.3660 |
| 1.3925 | 1.4118 | 1.3730 | 1.3610 |
Bond Markets Ever Since The Payrolls
Markets
The bull flattening trend that dominated over bond markets ever since the payrolls last Friday simply continued yesterday. The reflationary tale lost further momentum, not so much affecting equities (minor gains in US and Europe) but resulting in more yield declines at the long end of the US curve with 3.3 to 4 bps. The Fed meeting minutes delivered no surprises and, if anything, painted a more nuanced picture than the hawkish dot plot mid last month suggested as Fed officials still see a lot of question marks (on inflation, labour market, growth). One key takeaway is that taper talk will continue but that’s not new to markets. US yields broke below some important technical levels, including the 1.35% June low for the 10y (close at 1.316%). The 30y managed to stay north of similar support at 1.9259%. German yields tumbled 3 to 3.7 bps, sending its 10y to test key support at -0.30%. Both minor dollar strength and euro weakness plagued EUR/USD. The currency pair slipped below intermediate support of 1.181 to close at 1.179, the lowest level since early April. DXY (trade-weighted dollar) finished north of 92.51 support (92.64). Downward pressures brought EUR/GBP to 0.854, a level that acted as support many times already.
Asian mood is pretty dark this morning. Lingering market concerns over growth were given more substance by the Chinese State Council signaling a cut in the reserve requirement ratio (see below). Being the frontrunner in the economic recovery, doing so would potentially mark a pivotal point in the economic cycle. Chinese stocks underperform. The dollar holds steady. Other majors including the euro and especially the yen perform well. The Kiwi dollar lags the scoreboard after two strong days. Core bond futures have an upward bias amid cautious trading.
The economic calendar has to offer no other than weekly jobless claims in the US. We do however look forward to the ECB’s press conference this afternoon on the results of its strategic review. According to officials familiar with the matter, the inflation target was raised from “below, but close to 2%” to 2%. It is also anticipated that the ECB will allow overshooting the target to make up for previous misses as suggested recently by board member Schnabel. We expect the impact on markets to remain limited though. Such a review mainly has longer-term implications and a lot of it has already been priced in the euro and European yields anyway. What matters for today is how the Chinese signal will be digested by the rest of markets. It certainly touches a raw nerve but how much further should the bond repositioning go after the recent sharp moves? We think the yield decline might continue but slow from here, keeping the next technical references (1.21% in US 10y, -0.40% in German 10y) at a safe distance. If sentiment turns a bit less sour, EUR/USD in a daily perspective might hold up better too. The technical picture undoubtedly does bring a major advantage to the dollar though, so it would be wrong to assume EUR/USD is out of the woods already.
News headlines
The Chinese State Council said the PBOC ‘will use monetary policy tools, including a cut to the reserve requirement ratio at appropriate timing to enhance financial support to the real economy, particularly to smaller businesses’. Such a step aims to help firms deal with the impact of rising commodity prices. Chinese authorities highlighting potential policy easing might indicate that authorities see a risk of weaker than expected data. In this respect markets look forward to the Q2 GDP data that will be published on Thursday next week. The yield on the 10-y China government bond dropped 4 bp to 3.0%. The yuan this morning is trading little changed at 6.4775.
In a speech addressing topics on the labour market, RBA’s Lowe again put forward that the bank wants to see the unemployment rate declining to 4%. This is seen necessary to lift wages and for inflation to return to the 2-3% target range in a sustained way. The unemployment rate currently stands at 5.1%. In line with last week’s policy decision, the RBA governor repeated that scaling down the bond purchases from A$ 5 bln to A$ 4 bln does not represent a withdrawal of policy support. Lowe reiterated the RBA assessment that it probably will take until 2024 for inflation to reach the target in a sustainable way.
WTI Futures Form Red Days After The Jump To 6½-Year High
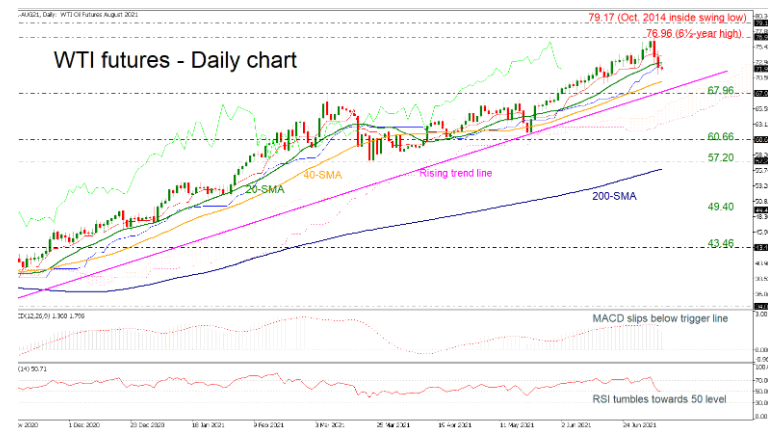
WTI crude oil futures have plummeted below the six-and-a-half-year high of 76.96 over the last couple of sessions, taking the market beneath the short-term 20-day simple moving average (SMA). However, the commodity remains above the long-term rising trend line, indicating that the broader picture is still positive.
Looking at the technical indicators, the MACD oscillator has dived beneath its trigger line in the positive region, while the RSI is approaching the 50 level with strong momentum. The Ichimoku lines are shifting to the downside despite the cloud's movement higher.
Any steeper bearish movements could take the price towards the 40-day SMA currently at 69.70 ahead of the strong supportive uptrend line near 69.12. Marginally below these lines, the 67.96 support could pause the negative move, though more declines could open the way for the 60.66 barrier.
On the other hand, a rebound off the short-term SMAs could shift the bias back to positive, touching the multi-year high around 77.00. Above this hurdle, the October 2014 inside swing low of 79.17 could be in the spotlight.
Summarizing, oil prices remain in positive territory despite the latest aggressive selling interest. Any moves underneath the ascending line and the Ichimoku cloud could switch the market to neutral.
AUD/USD Daily Report
Daily Pivots: (S1) 0.7452; (P) 0.7493; (R1) 0.7523; More...
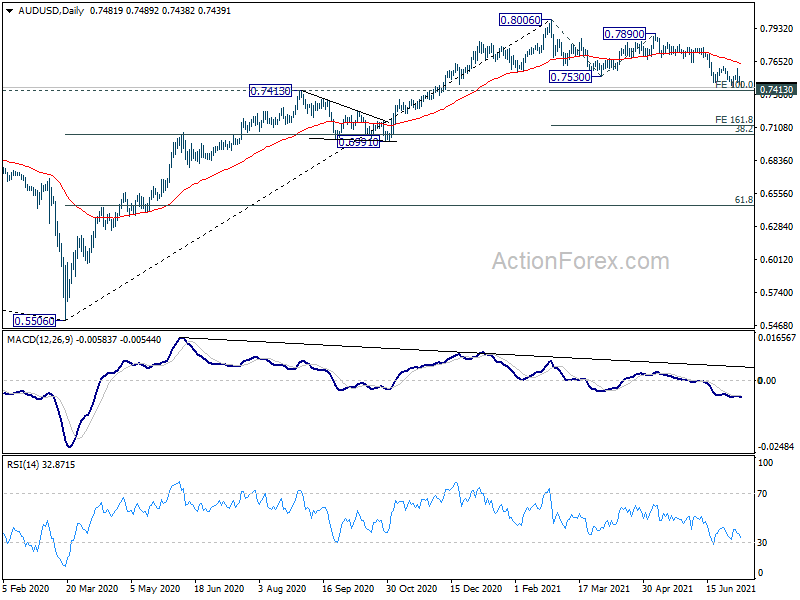
Intraday bias in AUD/USD is back on the downside with break of 0.7443 support. Fall from 0.7890 is seen as the third leg of the corrective pattern from 0.8006. Deeper fall would be seen to 100% projection of 0.8006 to 0.7530 from 0.7890 at 0.7414. But we'd expect strong support from there to bring rebound. Break of 0.7589 resistance will indicate short term bottoming. However, sustained break of 0.7414 will argue it's at least in larger scale correction, and target 161.8% projection at 0.7120 next.
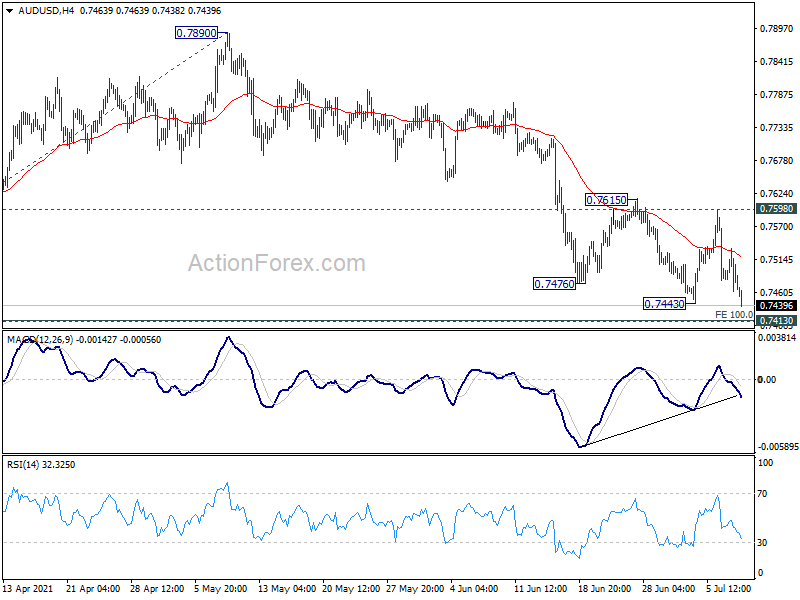
In the bigger picture, rise from 0.5506 medium term bottom could either be the start of a long term up trend, or a corrective rise. Reactions to 0.8135 key resistance will reveal which case it is. Rejection by 0.8135 key resistance, followed by firm break of 0.7413 resistance turned support, will favors the latter case. Deeper decline would be seen to 38.2% retracement of 0.5506 to 0.8006 at 0.7051 first.
USD/CAD Daily Outlook
Daily Pivots: (S1) 1.2432; (P) 1.2475; (R1) 1.2528; More...
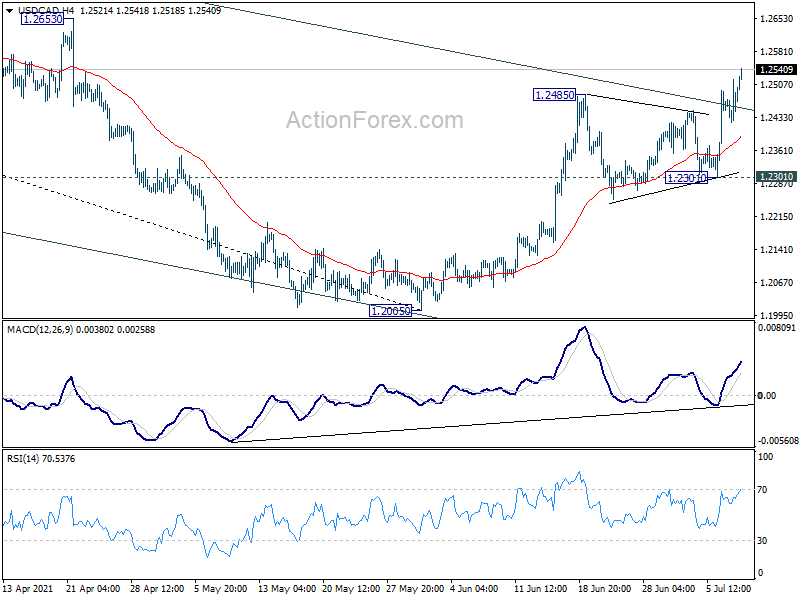
Intraday bias in USD/CAD remains on the upside as rise from 1.2005 low is in progress. The break of medium term falling channel resistance is a sign of bullish trend reversal. Further rise should be seen for 1.2653 resistance for confirmation. On the downside, break of 1.2301 support is needed to indicate short term topping. Otherwise, further rally will remain in favor in case of retreat.
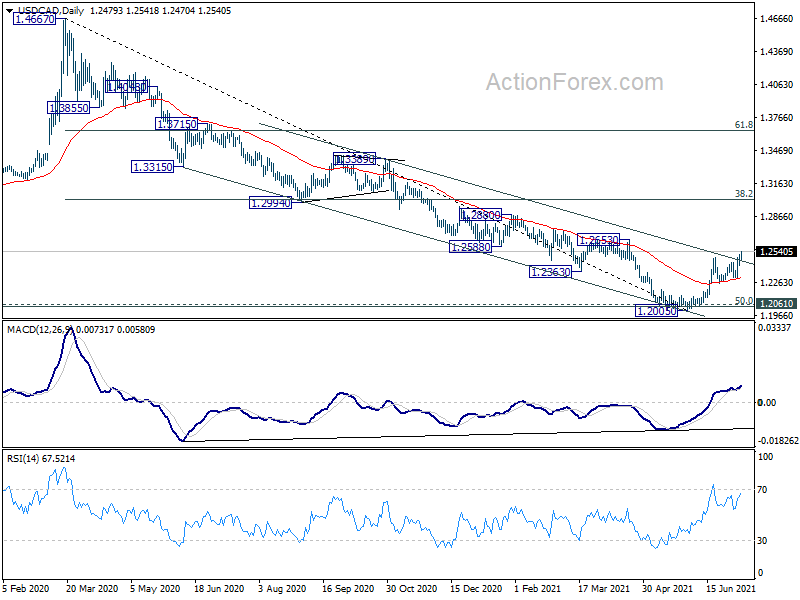
In the bigger picture, fall from 1.4667 is seen as the third leg of the corrective pattern from 1.4689 (2016 high). It might have completed after hitting 1.2061 (2017 low) and 50% retracement of 0.9406 to 1.4689 at 1.2048. Sustained break of 38.2% retracement of 1.4667 to 1.2005 at 1.3022 will pave the way to 61.8% retracement at 1.3650. Overall, medium term outlook remains neutral at worst with 1.2048/61 support zone intact.
EUR/USD Daily Outlook
Daily Pivots: (S1) 1.1771; (P) 1.1803; (R1) 1.1825; More...
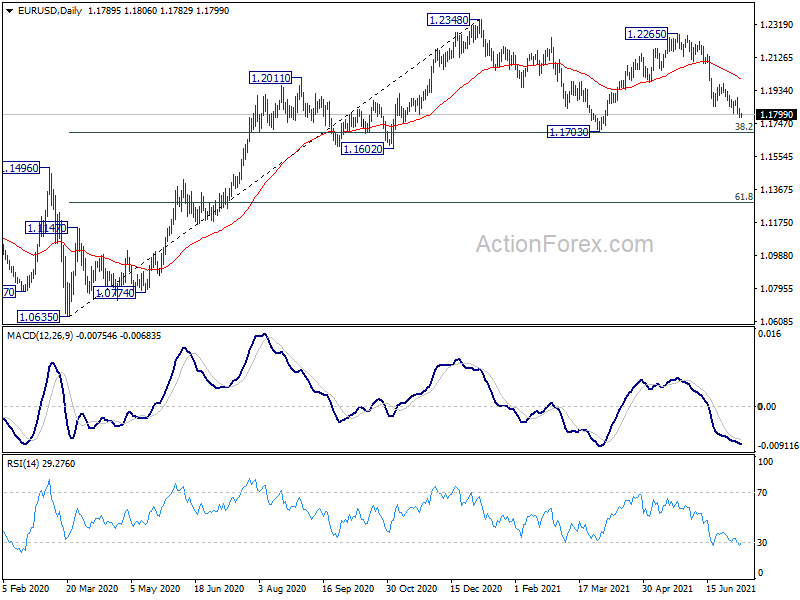
EUR/USD's break of 1.1806 support suggest resumption of fall from 1.2265, as the third leg of the consolidation pattern from 1.2348. Intraday bias is now back on the downside for 1.1703 key support next. On the upside, break of 1.1894 resistance is need to indicate short term bottoming. Otherwise, deeper fall will remain in favor in case of recovery.
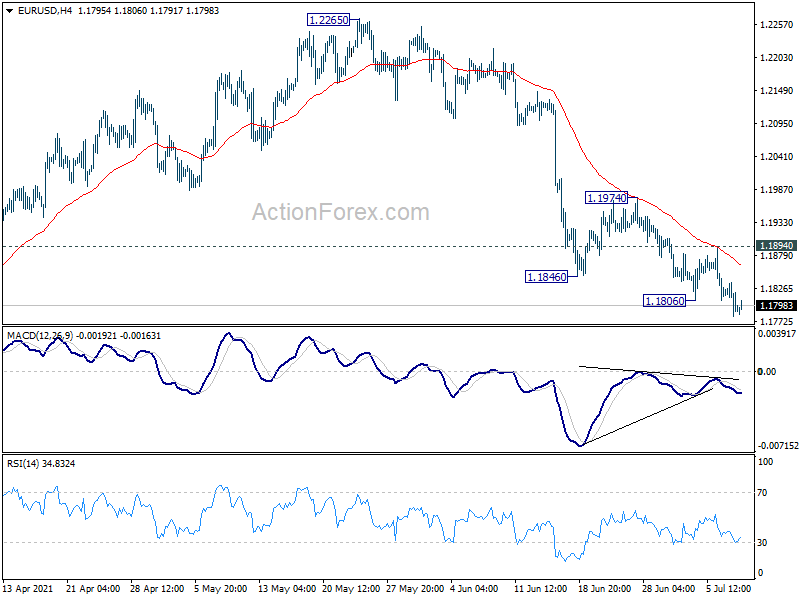
In the bigger picture, rise from 1.0635 is seen as the third leg of the pattern from 1.0339 (2017 low). Further rally could be seen to cluster resistance at 1.2555 next, (38.2% retracement of 1.6039 to 1.0339 at 1.2516). This will remain the favored case as long as 1.1602 support holds. Reaction from 1.2555 should reveal underlying long term momentum in the pair. However sustained break of 1.1602 will argue that the rise from 1.0635 is over, and turn medium term outlook bearish again.
GBP/USD Daily Outlook
Daily Pivots: (S1) 1.3755; (P) 1.3799; (R1) 1.3843; More....
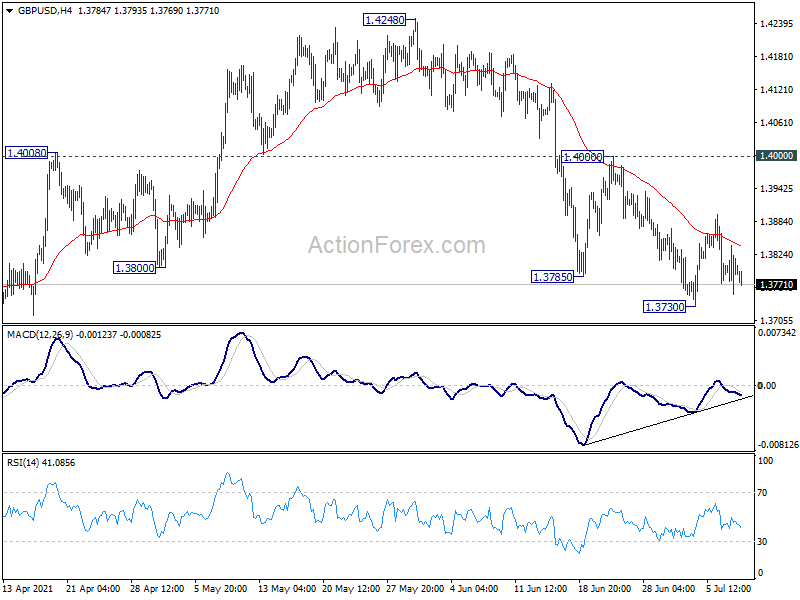
Intraday bias in GBP/USD remains neutral at this point and outlook is unchanged. On the upside, break of 1.4000 resistance will argue that fall from 1.4248 has completed. Intraday bias will be turned back to the upside for retesting 1.4240/8 resistance zone. On the downside, break of 1.3730 support will resume the fall from 1.4248, as the third leg of the consolidation pattern from 1.4240, to 1.3668 support and possibly below.
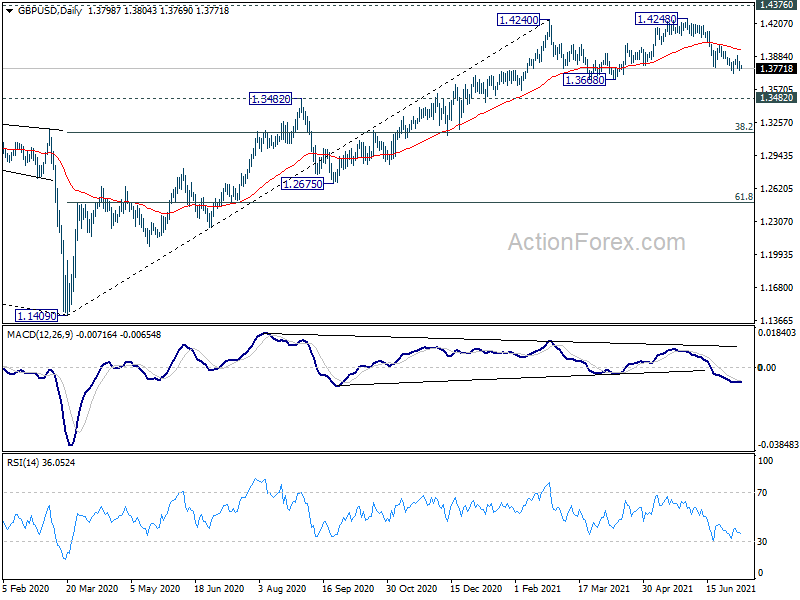
In the bigger picture, as long as 1.3482 resistance turned support holds, up trend from 1.1409 should still continue. Decisive break of 1.4376 resistance will carry larger bullish implications and target 38.2% retracement of 2.1161 (2007 high) to 1.1409 (2020 low) at 1.5134. However, firm break of 1.3482 support will argue that the rise from 1.1409 has completed and bring deeper fall to 1.2675 support and below.
USD/CHF Daily Outlook
Daily Pivots: (S1) 0.9231; (P) 0.9249; (R1) 0.9276; More....
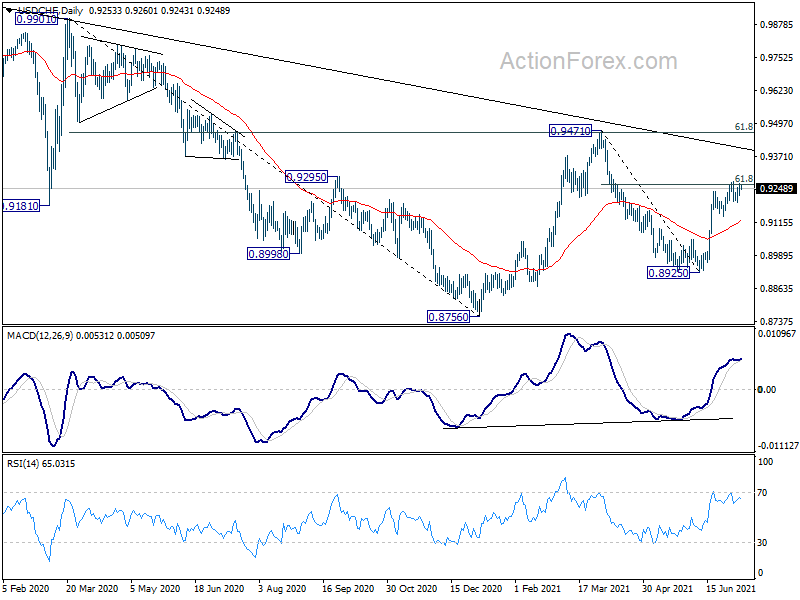
Intraday bias in USD/CHF stays neutral at this point. With 0.9141 support intact, another rise is still mildly in favor. On the upside, break of 0.9273 would pave the way to 0.9471 key resistance next. On the downside, however, break of 0.9141 support will argue that the rebound from 0.8925 has completed, and turn bias back to the downside for this low.
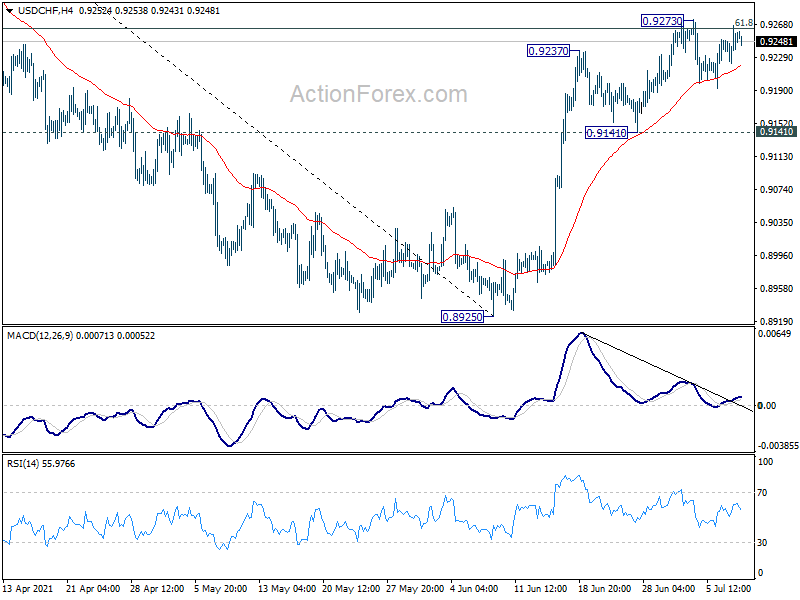
In the bigger picture, medium term outlook is currently neutral with focus on 0.9471 resistance. Sustained break there will indicate completion of whole decline from 1.0342 (2016 high). Medium term outlook will be turned bullish for a test on 1.0342 high. But, rejection by 0.9471 again will revive bearishness for another fall through 0.8756 low.