Sample Category Title
The Analytical Overview Of The Main Currency Pairs
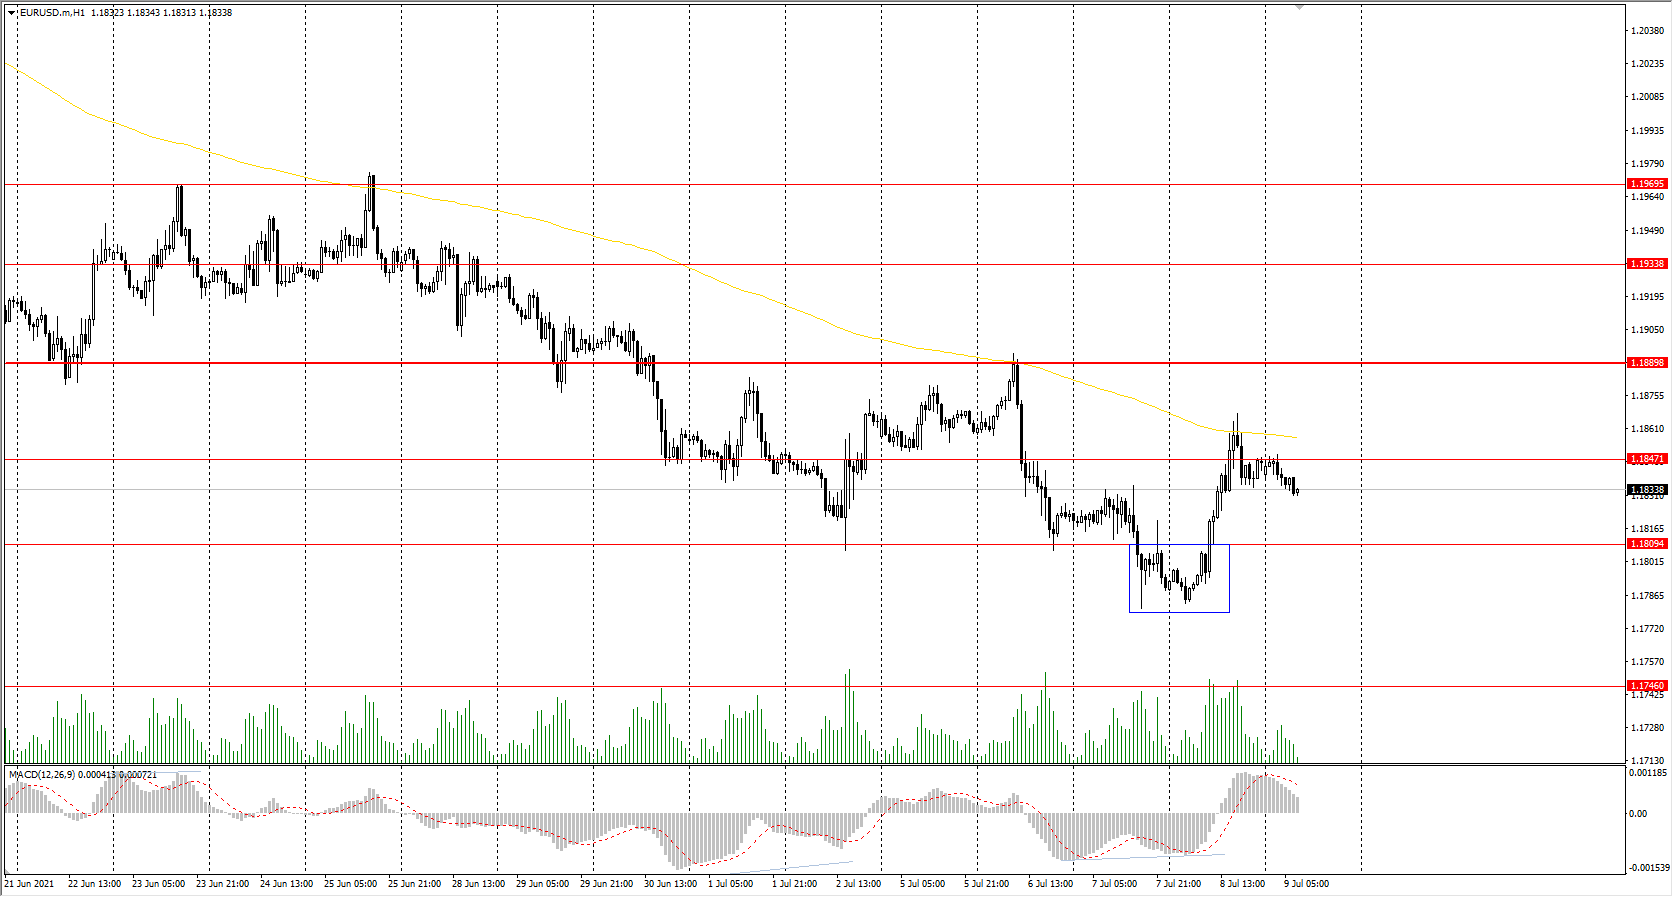
The EUR/USD currency pair
Technical indicators of the currency pair:
Prev Open: 1.1789
Prev Close: 1.1846
% chg. over the last day: +0.48%
The European Central Bank has slightly adjusted its monetary policy. The ECB raised its inflation target to 2%. The figure is symmetric, meaning that negative and positive deviations from the target are equally undesirable. Eurozone inflation is expected to fall in June as labor shortages, and delays in raw material supplies are beginning to decrease. The rate of asset purchases on the ECB balance sheet decreased, which supported the euro.
Trading recommendations
Support levels: 1.1809, 1.1746, 1.1609
Resistance levels: 1.1847, 1.1889, 1.1934, 1.1969
The trend is still bearish. But there was an initiative from the buyers, who pushed the price to the moving average, forming a false breakdown zone below. The MACD indicator returned to the positive zone. Under such market conditions, it is better to trade intraday. It is necessary to wait for a pullback to the nearest resistance levels for short positions. Long positions can be considered from the support levels. The divergence on the MACD indicator on higher timeframes is not yet completely worked out; in other words, there is still potential for growth.
Alternative scenario: if the price breaks out through the 1.1889 resistance level and fixes above, the general uptrend is likely to be resumed.
News feed for 2021.07.09:
- ECB President Christine Lagarde’s Speech at 13:00 (GMT+3).
The GBP/USD currency pair
Technical indicators of the currency pair:
Prev Open: 1.3799
Prev Close: 1.3789
% chg. over the last day: -0.07%
The British pound is trading in a narrow price range. The LIBOR lending rate on the interbank market in London began to decline again, which is favorable for the British currency. Today, the UK will present the GDP report for the month and the quarter, and the head of the Bank of England will give a speech. Volatility on the GBP/USD currency pair will increase.
Trading recommendations
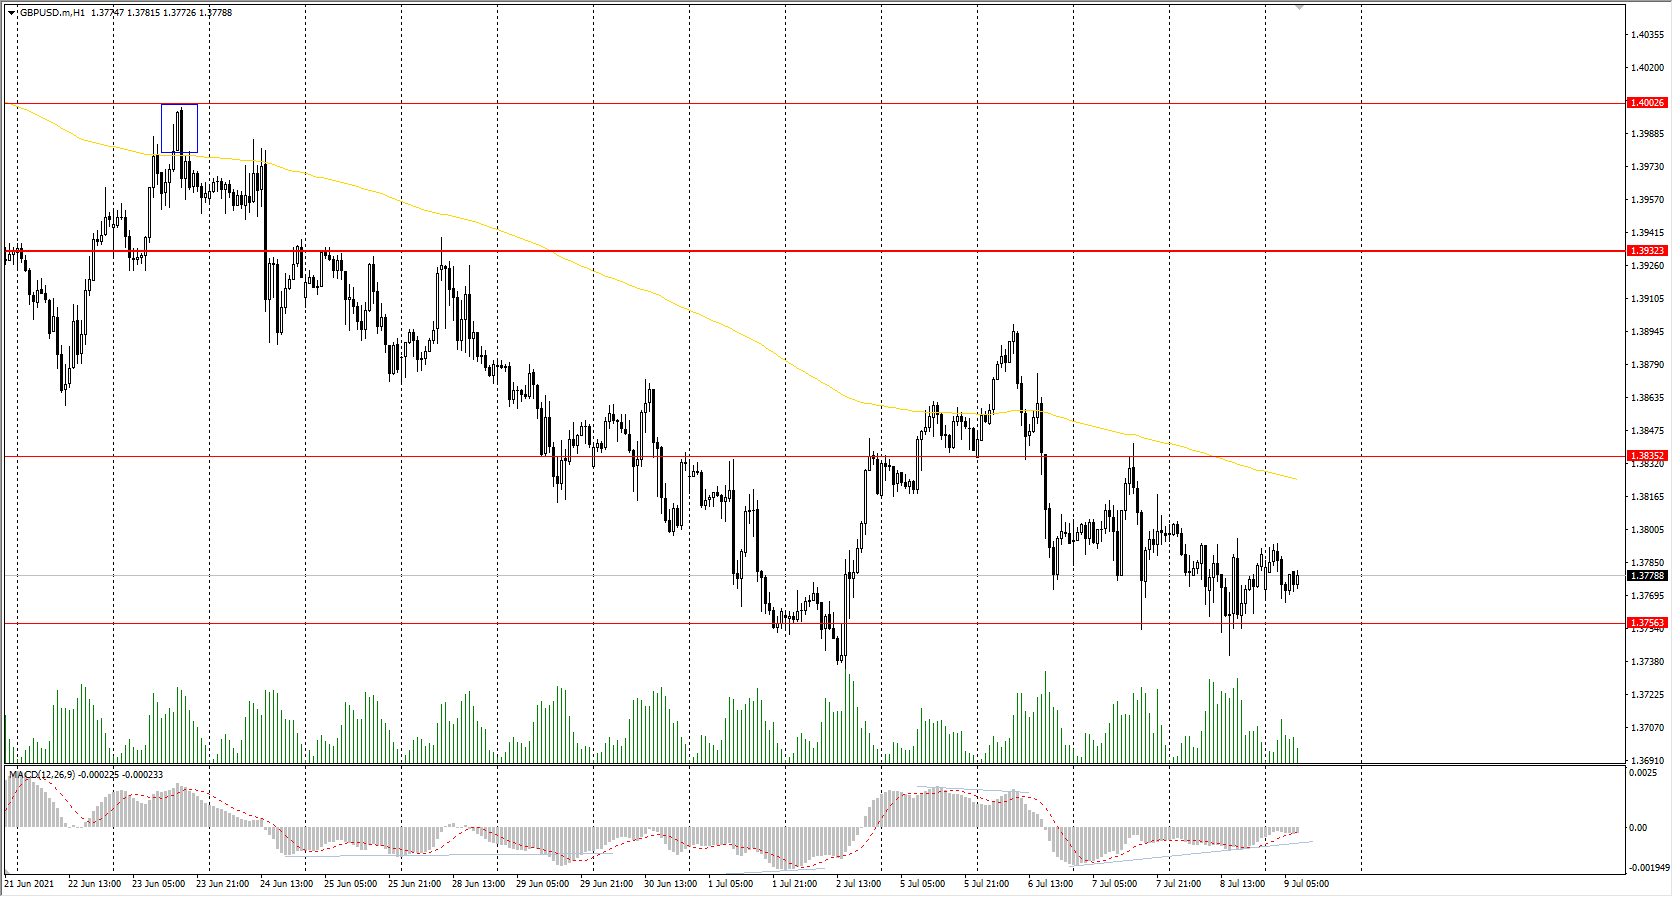
Support levels: 1.3756
Resistance levels: 1.3835, 1.3923, 1.4002, 1.4075, 1.4101, 1.4138, 1.4191
The GBP/USD trend is bearish on the H1 timeframe. Buying pressure has become weak now; the price drops below the moving average. The MACD indicator is in the negative zone, but there are signs of divergence. Under such market conditions, traders are better to look for both sell trades from the resistance levels and buy trades from the support levels on the intraday timeframes.
Alternative scenario: if the price breaks out through the 1.3922 resistance level and consolidates above, the bearish scenario is likely to be canceled.
News feed for 2021.07.09:
- UK GDP (m/m, q/q) at 09:00 (GMT+3);
- UK BoE Gov Andrew Bailey’s Speech at 13:00 (GMT+3).
The USD/JPY currency pair
Technical indicators of the currency pair:
Prev Open: 110.60
Prev Close: 109.75
% chg. over the last day: -0.77%
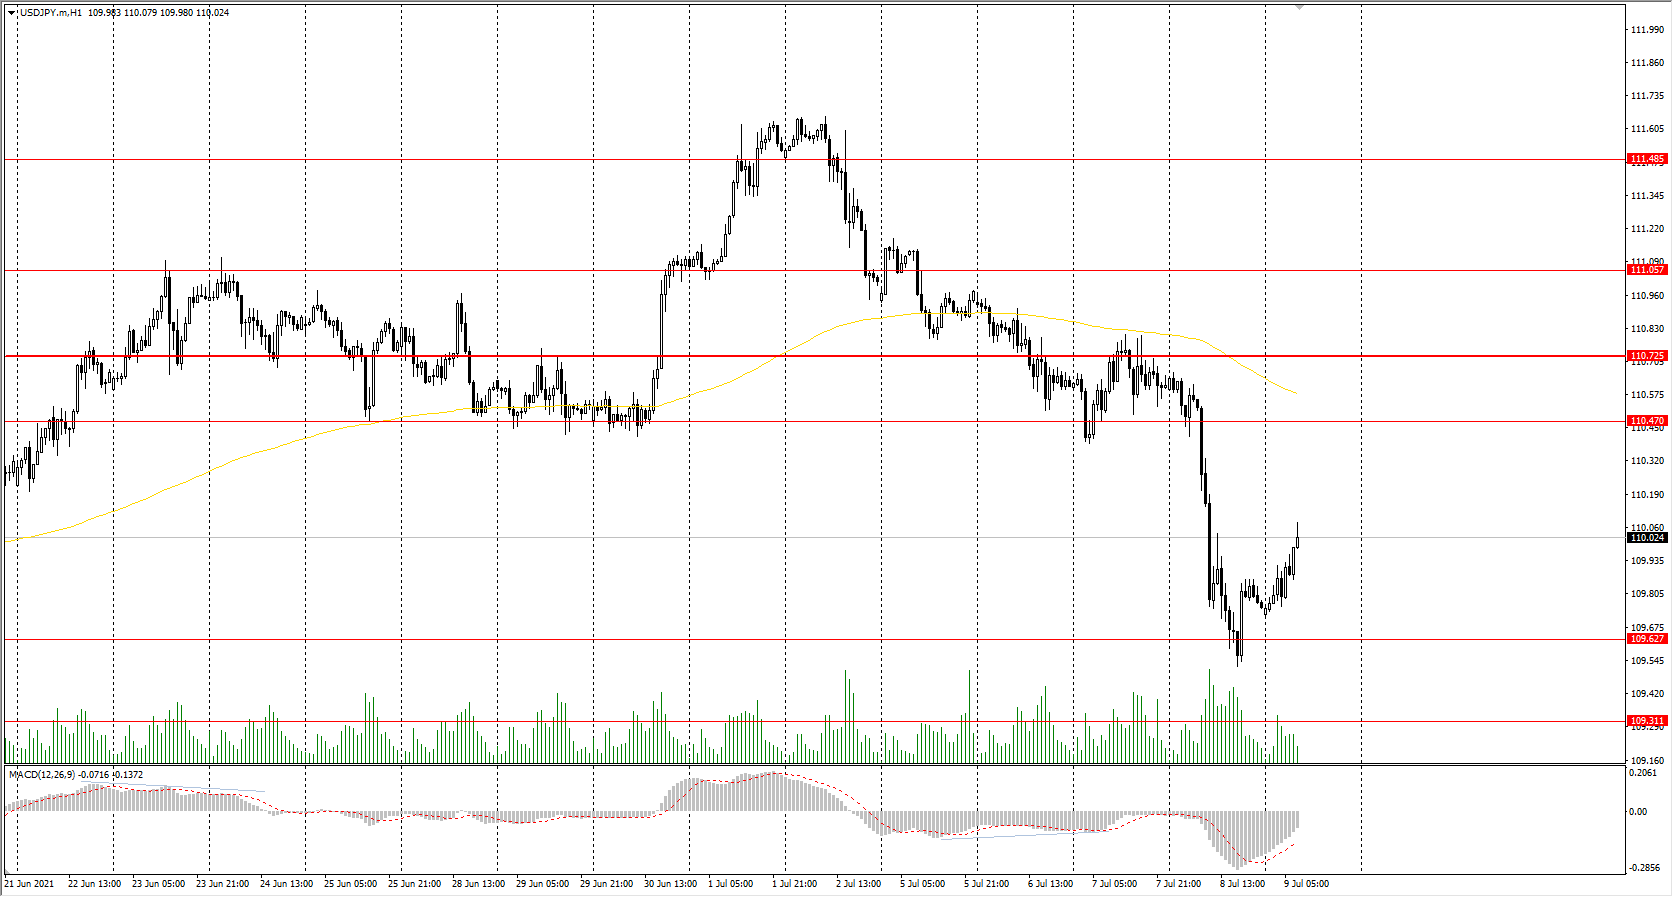
The situation on the USD/JPY currency pair has changed. Yesterday, the price broke down through the change priority level on a big impulsive move, and the quotes fell by 0.77% by the end of the day. The Japanese Yen futures continue to increase due to a decline in US government bond yields (inverse correlation). This is the reason why the USD/JPY currency pair differs from the other pairs, where the main currency is the US dollar.
Trading recommendations
Support levels: 109.62, 109.31
Resistance levels: 110.47, 110.73, 111.06, 111.48, 110.73, 112.18
From the point of view of technical analysis, the trend has changed to a downtrend. Yesterday, the price confidently broke down through the change priority level and fixed lower. Under such market conditions, it is best for traders to look for sell positions from the resistance levels. There are no optimal entry points for buy positions now.
Alternative scenario: if the price rises above 110.73, the uptrend is likely to be resumed.
The USD/CAD currency pair
Technical indicators of the currency pair:
Prev Open: 1.2474
Prev Close: 1.2532
% chg. over the last day: +0.46%
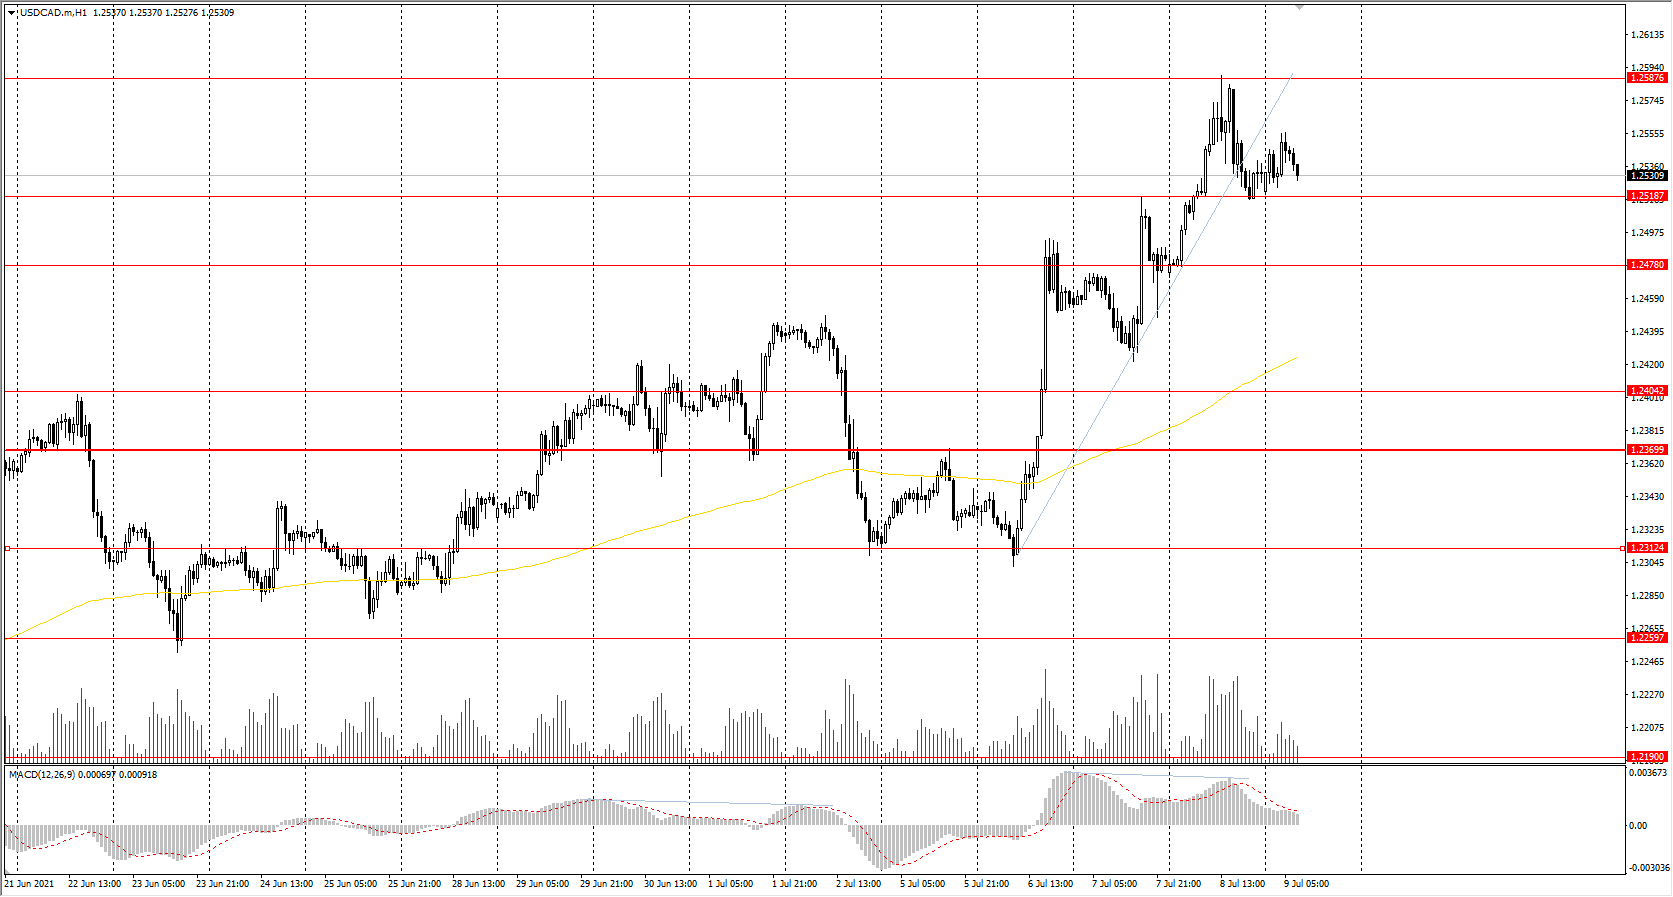
The USD/CAD currency pair began a corrective movement downwards within the ascending trend. Today, Canada will report on the labor market, which will allow estimating the fundamental picture and forecasting the actions of the Bank of Canada. At the moment, the Canadian dollar is highly correlated with the US currency and oil prices.
Trading recommendations
Support levels: 1.2519, 1.2478, 1.2404, 1.2347, 1.2312, 1.2260, 1.2190
Resistance levels: 1.2587
Technically, the trend remains bullish. The price is trading above the moving average, but there is a strong deviation from the midline. The MACD indicator has returned to the positive zone but with signs of divergence. Under such market conditions, it is best to trade on the lower timeframes. Buyers need to wait for a slight pullback to the nearest support levels. Traders can also look for entry points on intraday timeframes for short positions, but only with short targets because it will be trading against the trend.
Alternative scenario: if the price breaks down through the 1.2370 support level and fixes below, the downtrend is likely to be resumed.
News feed for 2021.07.09:
- Canada Employment Change (m/m) at 15:30 (GMT+3);
- Canada Unemployment Rate (m/m) at 15:30 (GMT+3).
USDCAD Fortifies Short-Term Bullish Structure
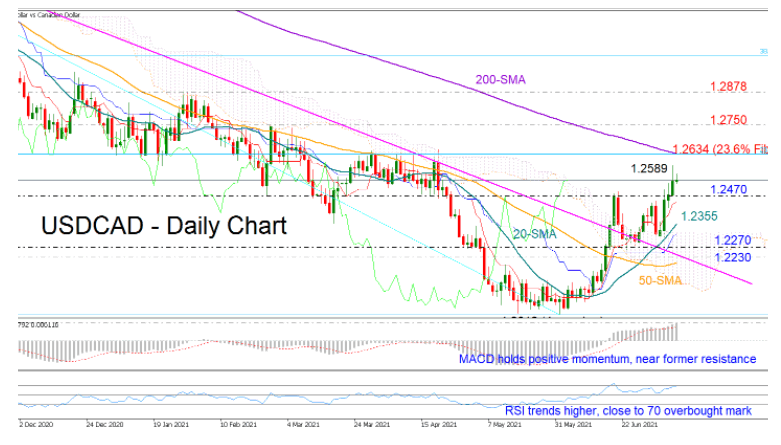
USDCAD charted a new higher high at 1.2589 on Thursday, signaling that the trendline cracked in June could be something more than temporary.
The bullish cross between the 20- and 50-day simple moving averages (SMAs) is endorsing the above narrative but technically, a sustainable move above the previous high of 1.2652 is needed to invalidate the long-term downtrend and hence bring new buyers into the market. The 200-day SMA and the 23.6% Fibonacci retracement of the March 2020 – May 2021 downfall are in the neighborhood as well at 1.2634, enhancing the upward burden in the area.
More advances are possible according to the momentum indicators. However, any upside corrections should be taken with a grain of salt as the MACD is currently hovering around a former resistance region and the RSI is in short distance from its 70 overbought mark, warning that a pullback, perhaps around 1.2650, could occur.
If that is the case, the pair could reverse to seek support near 1.2470, while lower the 20-day SMA at 1.2355 may stop the price from testing the 1.2270 level. The broken descending trendline and the 50-day SMA could also adopt a protective role slightly beneath at 1.2230 if downside pressures strengthen.
Alternatively, if the 1.2652 area proves easy to claim, the next obstacle could pop up near 1.2750, whereas a sharper upturn could head for January’s peak of 1.2880.
In brief, USDCAD looks to have set up for more increases in the near term, though room for improvement could be limited as the price is approaching overbought levels.
GBPJPY Could Fall Further
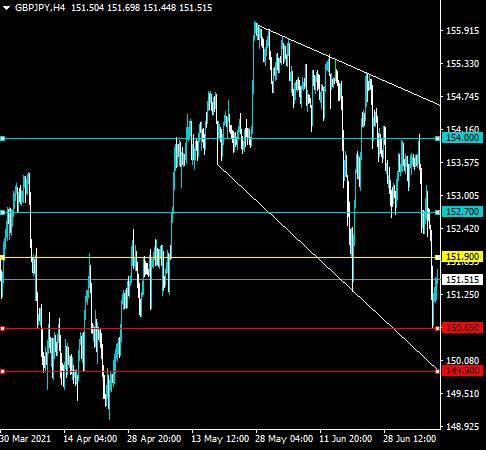
The British pound currency is attempting to recover higher against the Japanese yen after finding support around the 150.65 technical area. The four-hour time frame shows that the GBPJPY pair is trapped inside a large descending broadening wedge pattern. The GBPJPY pair has yet to test the bottom of the mention wedge pattern, which is located around the 149.90 level.
The GBPJPY pair is only bullish while trading above the 151.90 level, key resistance is found at the 152.70 and the 154.00 levels.
If the GBPJPY pair trades below the 151.90 level, sellers may test the 151.65 and 149.90 support levels.
BTCUSD $33,000 Pivot
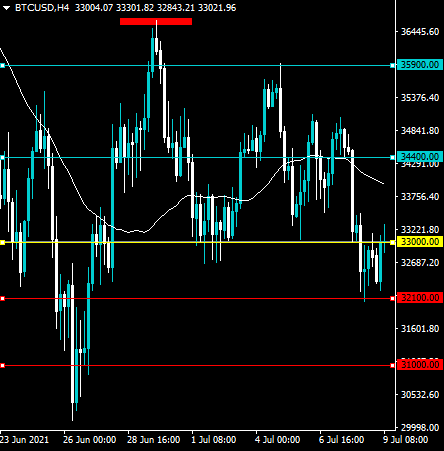
Bitcoin is struggling to make upside traction as the broader cryptocurrency market still remains entrenched in a bear market. The four-hour time frame shows that the $33,000 level is the neckline of a bearish head and shoulders pattern and is acting as a pivot point. Sustained weakness below the $33,000 level could cause the BTCUSD pair to fall towards the $31,000 level.
The BTCUSD pair is only bullish while trading above the $33,000 level, key resistance is found at the $34,400 and the $35,900 levels.
If the BTCUSD pair trades below the $33,000 level, sellers may test the $32,100 and $31,000 levels.
Sterling Yawns After Weak GDP Data
The British pound is directionless in the Friday session. In European trade, GBP/USD is trading at 1.3767, down 0.09% on the day.
GDP, Manufacturing Production underperform
The UK released a data damp to end the trading week, and the releases that investors were most interested in disappointed. GDP for May slowed to 0.8% MoM, well below the revised April reading of 2.0% and below the consensus of 1.0%. Although the recovery is gaining steam, and PMI reports are pointing to strong growth across economic sectors, GDP is still about 3 percent below the pre-Covid levels (February 2020). Still, the economy continues to expand, and the May report marked the fourth straight month of expansion.
With the government determined to remove all Covid restrictions in 10 days time, we can expect pent-up demand to be unleashed and boost economic growth in the H2 of 2021. That said, health officials are sounding the alarm that it is premature to remove all health restrictions, especially with the surge in cases of the Covid delta variant in the UK. If the move to reopen backfires and Covid cases soar, a lockdown of at least parts of the economy could be the result.
There was no relief from the manufacturing sector, as Manufacturing Production declined for a second successive month, with a reading of -0.1% MoM. This was well below the forecast of a 1.0% gain. Production output has been hampered by Covid and remains 3% below the pre-Covid level. Industrial Production accelerated to 0.8% in May MoM, up from a revised April read of -1.0%. Still, this fell short of the consensus of 1.5%.
Investors do not seem all that concerned with these soft numbers, as the pound is drifting on Friday.
GBP/USD Technical Analysis
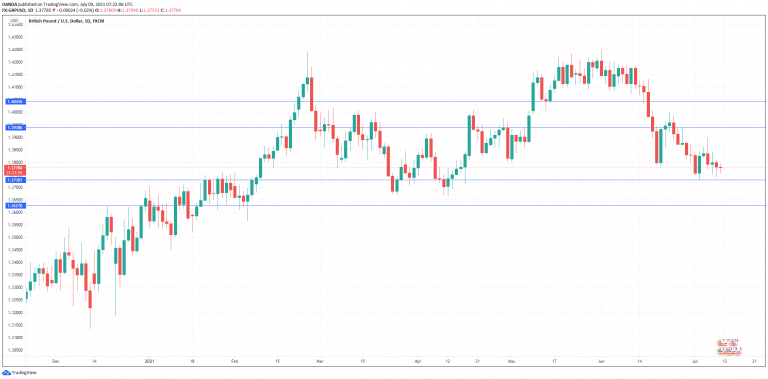
- There is resistance at 1.3938. Above, there is resistance at 1.4043
- On the downside, 1.3730 is providing support. This is followed by support at 1.3627
USD/CAD Daily Outlook
Daily Pivots: (S1) 1.2475; (P) 1.2532; (R1) 1.2588; More...
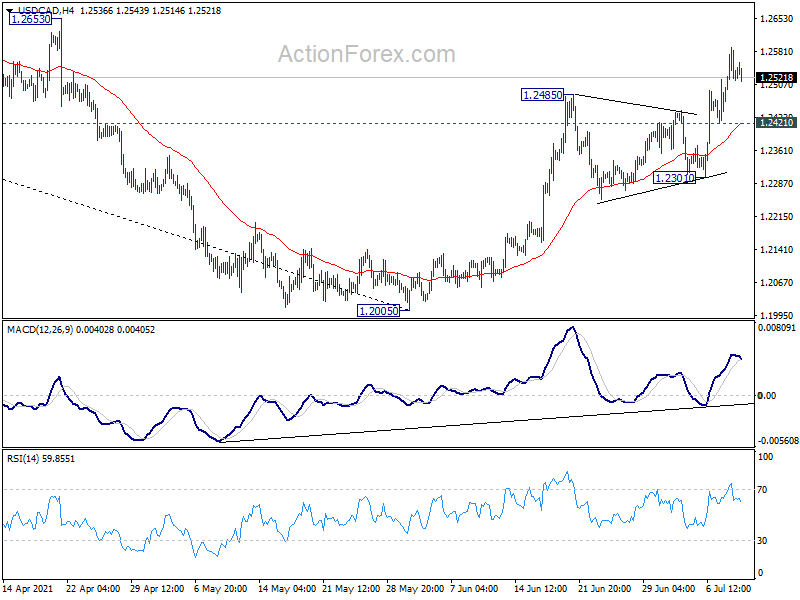
Intraday bias in USD/CAD stays on the upside at this point. Rebound from 1.2005 low is in progress for 1.2653 resistance. The break of medium term falling channel resistance is a sign of bullish trend reversal. Firm break of 1.2653 should confirm. However, downside, below 1.2421 minor support will turn intraday bias neutral first. But break of 1.2301 support is needed to indicate short term topping. Otherwise, further rally will remain in favor in case of retreat.
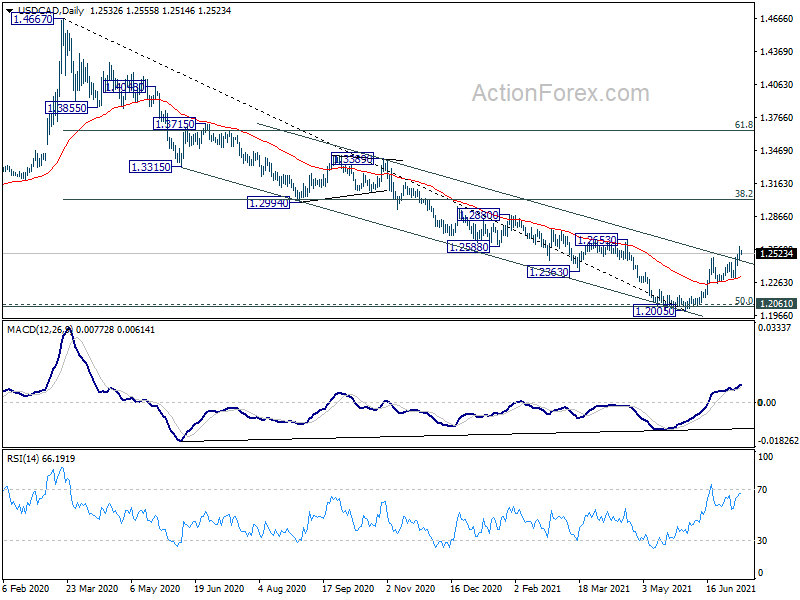
In the bigger picture, fall from 1.4667 is seen as the third leg of the corrective pattern from 1.4689 (2016 high). It might have completed after hitting 1.2061 (2017 low) and 50% retracement of 0.9406 to 1.4689 at 1.2048. Sustained break of 38.2% retracement of 1.4667 to 1.2005 at 1.3022 will pave the way to 61.8% retracement at 1.3650. Overall, medium term outlook remains neutral at worst with 1.2048/61 support zone intact.
AUD/USD Daily Report
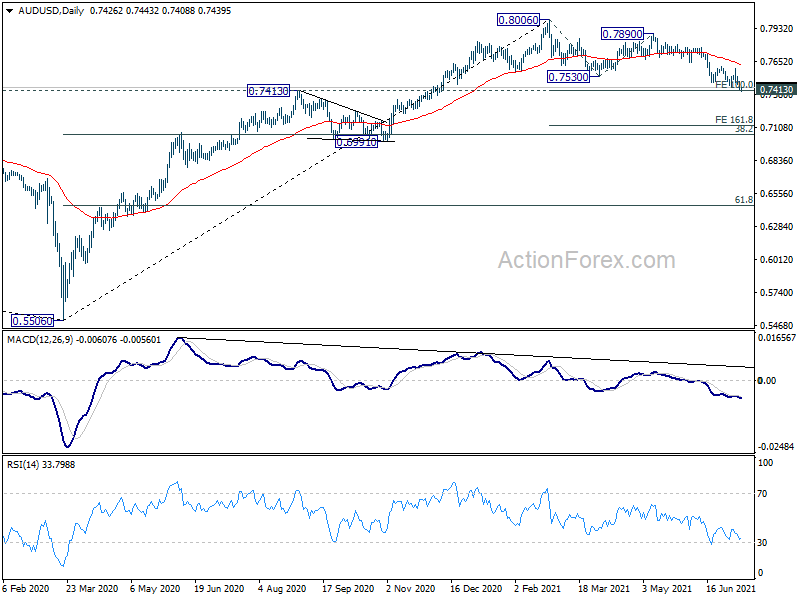
Daily Pivots: (S1) 0.7402; (P) 0.7446; (R1) 0.7476; More...
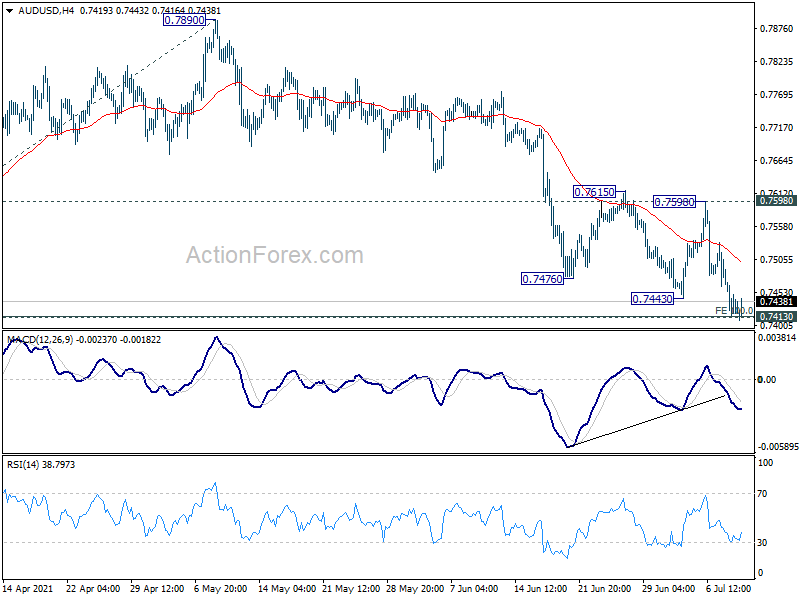
Focus is now on 0.7143/4 key support in AUD/USD. We'd still expect this to hold to complete the correction from 0.8006. On the upside, break of 0.7598 resistance will indicate short term bottoming. Intraday bias will be turned back to the upside for retesting 0.7890/8006 resistance zone. On the downside, however, sustained break of 0.7414 will argue it's at least in larger scale correction, and target 161.8% projection of 0.8006 to 0.7530 from 0.7890 at 0.7120 next.
In the bigger picture, rise from 0.5506 medium term bottom could either be the start of a long term up trend, or a corrective rise. Reactions to 0.8135 key resistance will reveal which case it is. Rejection by 0.8135 key resistance, followed by firm break of 0.7413 resistance turned support, will favors the latter case. Deeper decline would be seen to 38.2% retracement of 0.5506 to 0.8006 at 0.7051 first.
EUR/USD Daily Outlook
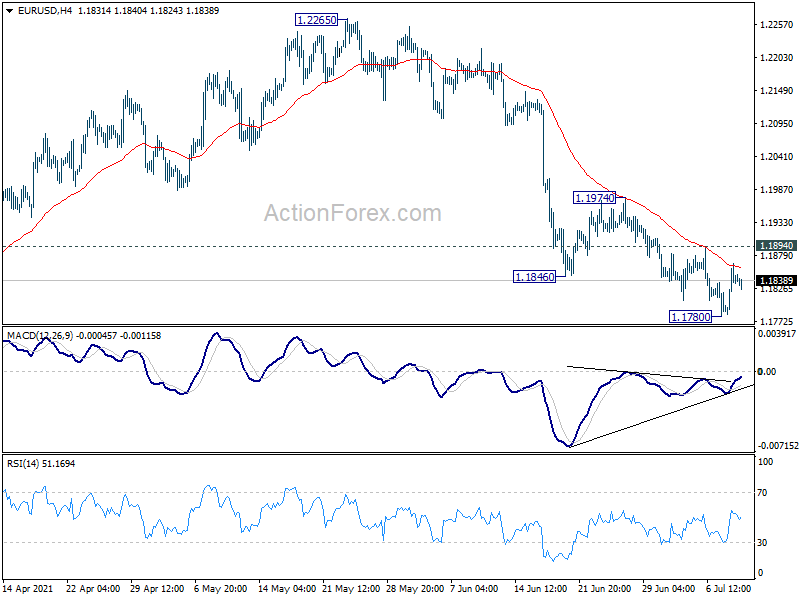
Daily Pivots: (S1) 1.1797; (P) 1.1833; (R1) 1.1881; More...
Intraday bias in EUR/USD is turned neutral for the moment. Another fall could be seen with 1.1894 minor resistance intact. Below 1.1780 will extend the fall from 1.2265, as the third leg of the consolidation pattern from 1.2348, to 1.1703 key support next. On the upside, firm break of 1.1894 resistance will suggest short term bottoming, on bullish convergence condition in 4 hour MACD. Stronger rebound should then be seen to 1.1974 resistance and above.
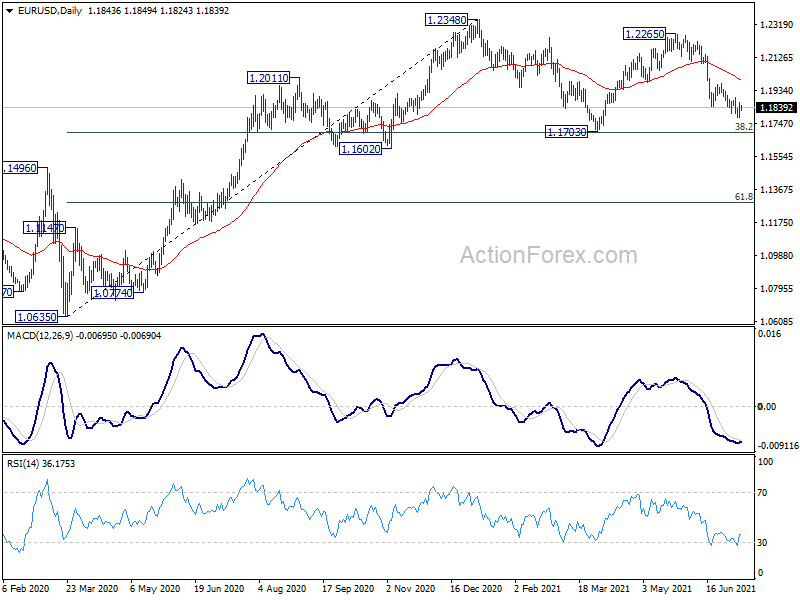
In the bigger picture, rise from 1.0635 is seen as the third leg of the pattern from 1.0339 (2017 low). Further rally could be seen to cluster resistance at 1.2555 next, (38.2% retracement of 1.6039 to 1.0339 at 1.2516). This will remain the favored case as long as 1.1602 support holds. Reaction from 1.2555 should reveal underlying long term momentum in the pair. However sustained break of 1.1602 will argue that the rise from 1.0635 is over, and turn medium term outlook bearish again.
GBP/USD Daily Outlook
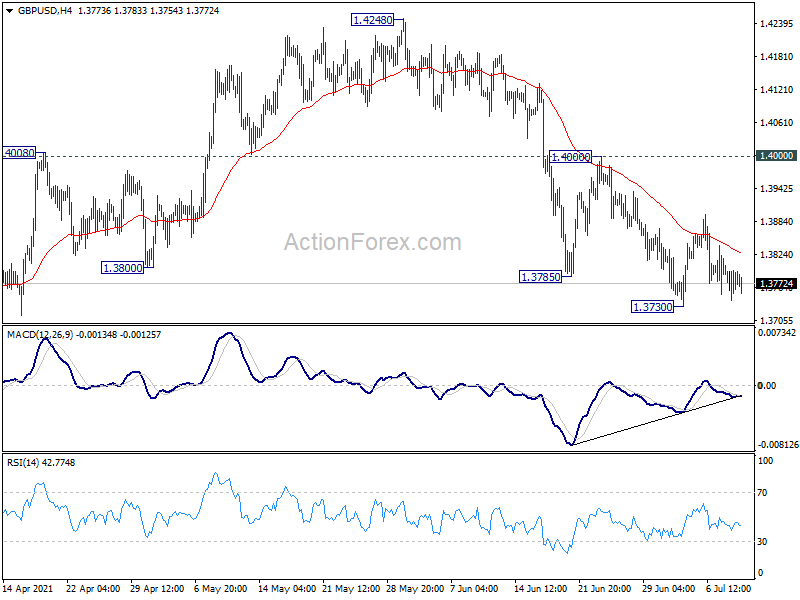
Daily Pivots: (S1) 1.3753; (P) 1.3779; (R1) 1.3817; More....
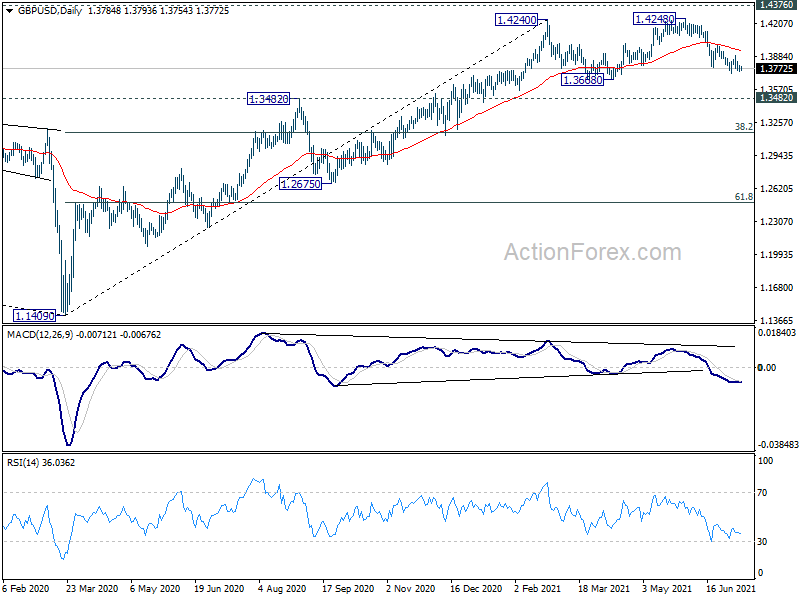
GBP/USD is still bounded in range of 1.3730/4000 and intraday bias remains neutral first. On the downside, break of 1.3730 support will resume the fall from 1.4248, as the third leg of the consolidation pattern from 1.4240. Deeper decline would be seen to 1.3668 support and possibly below. On the upside, break of 1.4000 resistance will argue that fall from 1.4248 has completed. Intraday bias will be turned back to the upside for retesting 1.4240/8 resistance zone.
In the bigger picture, as long as 1.3482 resistance turned support holds, up trend from 1.1409 should still continue. Decisive break of 1.4376 resistance will carry larger bullish implications and target 38.2% retracement of 2.1161 (2007 high) to 1.1409 (2020 low) at 1.5134. However, firm break of 1.3482 support will argue that the rise from 1.1409 has completed and bring deeper fall to 1.2675 support and below.
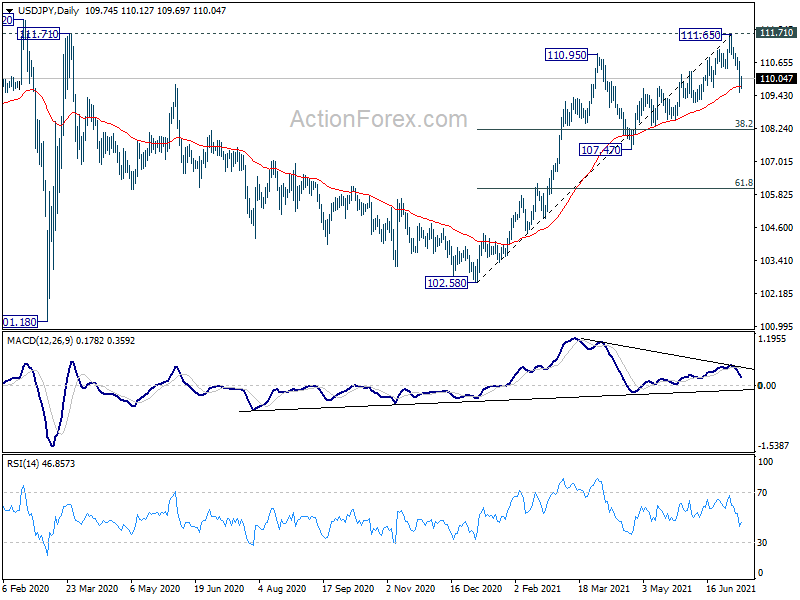
USD/JPY Daily Outlook
Daily Pivots: (S1) 109.30; (P) 110.00; (R1) 110.45; More...
Intraday bias in USD/JPY stays on the downside for the moment. Sustained trading below 55 day EMA (now at 109.78) will suggest that it's at least correcting the whole rise from 102.58. Deeper fall would be seen to 38.2% retracement of 102.58 to 111.65 at 108.18. On the upside, above 110.38 minor resistance will turn intraday bias neutral first. But risk will remain mildly on the downside as long as 111.65 resistance holds, in case of recovery.
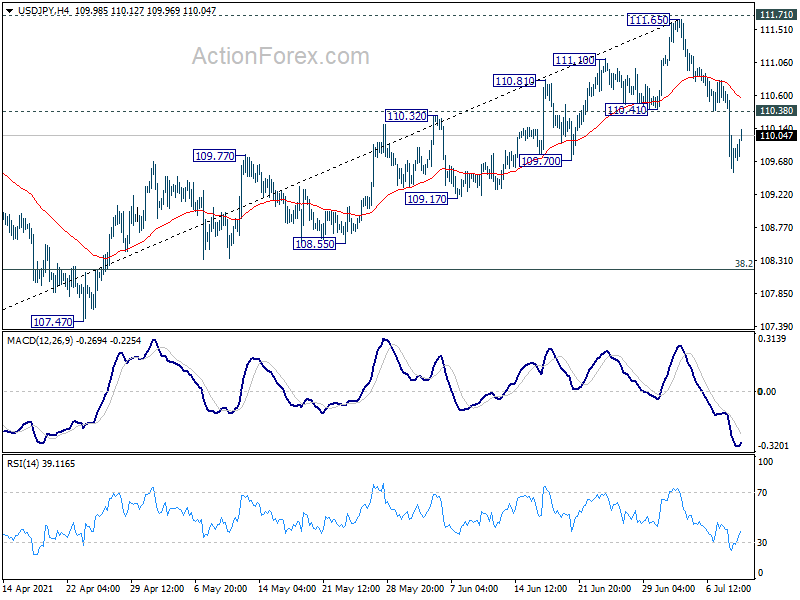
In the bigger picture, medium term outlook is staying neutral with 111.71 resistance intact. Though, as notable support was seen from 55 day EMA, rise from 102.58 is mildly in favor to extend higher. Decisive break of 111.71/112.22 resistance will suggest long term bullish reversal. Rise from 101.18 could then target 118.65 resistance (Dec 2016) and above. However, sustained break of 55 day EMA would revive some medium term bearishness, and open up deep fall back towards 102.58 support.