Sample Category Title
The Dollar Is Losing Ground, Fuelling The Oil And Gold Rally
Since the start of the month, the US dollar has been losing ground, testing the 92 levels for the DXY. The publication of strong NFP data may well have triggered continued pressure on the dollar. Reflation trade went back to the markets: betting on assets that benefit from economic growth. Fears that the Fed might tighten monetary policy in a way that would cause a significant setback in the recovery have receded somewhat.
On the other hand, one must realize that the dollar has accumulated substantial rebound potential from the previous months of decline. Although the Fed promises that it has learned from past mistakes and can avoid turbulence in the markets, it is still worth keeping this development on the periphery. The dollar has room to grow. Its recent strengthening has been quite telling, accelerating after the DXY rose above the 50 and 200-day moving averages. This dynamic is a sure sign of confidence on the part of Dollar buyers.
A bullish scenario remains in effect if the DXY trades above the 200 SMA, which is at 91.40 versus 92.00 now.
Crude oil
Oil is developing its ascent, passing the $77 per barrel Brent mark and $76 for WTI, highs since autumn 2018. Countries in OPEC+ disagreed with a position on the UAE's production baseline last week. They canceled talks on Monday without setting a new date. Without new agreements, the previous quotas, which are clearly below market needs, will remain.
This leads to an influx of speculators in oil. It is also noteworthy that WTI crude is narrowing the price difference to Brent. This is evidence that demand for black gold in the USA is rising ahead of schedule. At the same time, production has stagnated near the 11m BPD mark for almost a year.
Oil is getting speculatively hot and can even go as high as $80. However, such prices remain hardly sustainable, as some of the supply is artificially restrained.
Gold
Gold crossed above $1800 on Tuesday morning for the first time in two and a half weeks. Buying interest picked up after a dip late last month into the 1750 area to support the long-term uptrend. Late last week and early this week, gold has also seen an increase in demand for risk assets and a weakening of the dollar.
An important test for the gold bulls promises to be the area of $1830-1835, where the 50- and 200-day simple moving averages are passing. A solid jump in the price above these levels would significantly build on the bullish momentum after the failure in June.
A new wave of retreat of the US currency, if it proves sustainable, could be accompanied by a recovery of traction in the metals and has the potential to send the price towards $1900/oz as early as this month and open the way to the area of historic highs above $2075.
RBA Tapers Weekly Purchases of Bonds to $4 Billion from $5 Billion
The Governor of the Reserve Bank has announced the intention to reduce the weekly purchases from $5 billion to $4 billion and not to extend its Yield Curve Target from the April 2024 bonds to the November 2024 bonds – two clear signs that policy is tightening.
As Westpac foreshadowed the Governor has announced that the Bank will move from a policy of fixing the full target level of bond purchases to using a flexible week by week approach. It will maintain the current 80% AGS/ 20% semi government ratio.
However the policy is a tighter approach than we had expected. Westpac expected that the Bank would maintain its $5 billion purchase pace until the December Board meeting whereas the Bank has committed to a $4 billion weekly target effective until November 11.
Our expectations entailed a first tranche program of $70 billion compared to the stated program of $40 billion. However we do expect that the program will be extended beyond November.
That date will be ten days after the November Board meeting and will follow the November Statement on Monetary Policy where the Bank will have refreshed its forecasts.
We fully anticipate that those revised forecasts will support a reduced pace of purchases.
While we have argued that we expect the Bank will begin its tightening cycle in the March quarter 2023 we anticipate that November 2021 will be too early to curtail the bond purchase program altogether and it will continue into 2022 at a pace that will be gradually stepped down from the $4 billion per week.
We expect that the latest date for maintaining the program will be around mid year.
With the Governor still referring to “pick up in inflation and wages growth … likely to be only gradual and modest” the case is not strong for a full curtailment of the program in November.
We expect that the Federal Reserve will announce its intention to begin tapering its bond purchases in September with a lift off date in early January carrying through to mid 2022.
The FED’s actions, once begun, will give the RBA cover should it decide to curtail its purchases even earlier than our expectation of around mid 2022.
The decision to not extend the Yield Curve Target program to the November 2024 bonds, which we foreshadowed, is as we noted in our preview, a decision to further tighten policy.
Giving up the option to extend the purchases at 0.1% to a 3 year 4 month bond from a 2 year 9 month bond is effectively tightening policy.
We also foreshadowed that the Governor would change his guidance from “ This is unlikely to be 2024 at the earliest” to exclude “at the earliest”.
He did that but went further with “The Bank’s central scenario for the economy is that this condition will not be met until 2024.”
A “central scenario” is a less confident assessment than “unlikely” while it was always going to be necessary to maintain the 2024 assessment given that the Bank will still be purchasing the April 2024 bonds at the current cash rate of 0.1%.
The Governor has committed to further comments and a Q and A from 4 pm today.
That will be the best time to measure his views on the economic outlook.
In the current Statement the Bank has maintained its forecasts from the June Statement although has slightly lifted its forecast for annual headline inflation from” above 3%”to 3.5%.”
The commentary on the labour market is much more bullish than in June referring to “welcome decline in underemployment and labour force participation around record highs”.
There is no change in the rhetoric around the housing market, “ the Bank will be monitoring trends in housing borrowing carefully and it is important that lending standards are maintained.”
Conclusion
This is a more hawkish Statement than we had expected highlighted by the decision to taper in September; the other hawkish aspects around YCT and language were as expected.
Nevertheless, this policy change is consistent with our view that the first rate hike will come in March 2023- much earlier than the current “central scenario”
While the decision to move to a weekly purchase program was foreshadowed in our recent writings we are somewhat surprised by the decision to taper the weekly purchases.
However we expect that after November there will continue to be a further reduced purchase target extending into 2022 before a considerable break of 9–12 months before the first rate hike in the March quarter 2023.
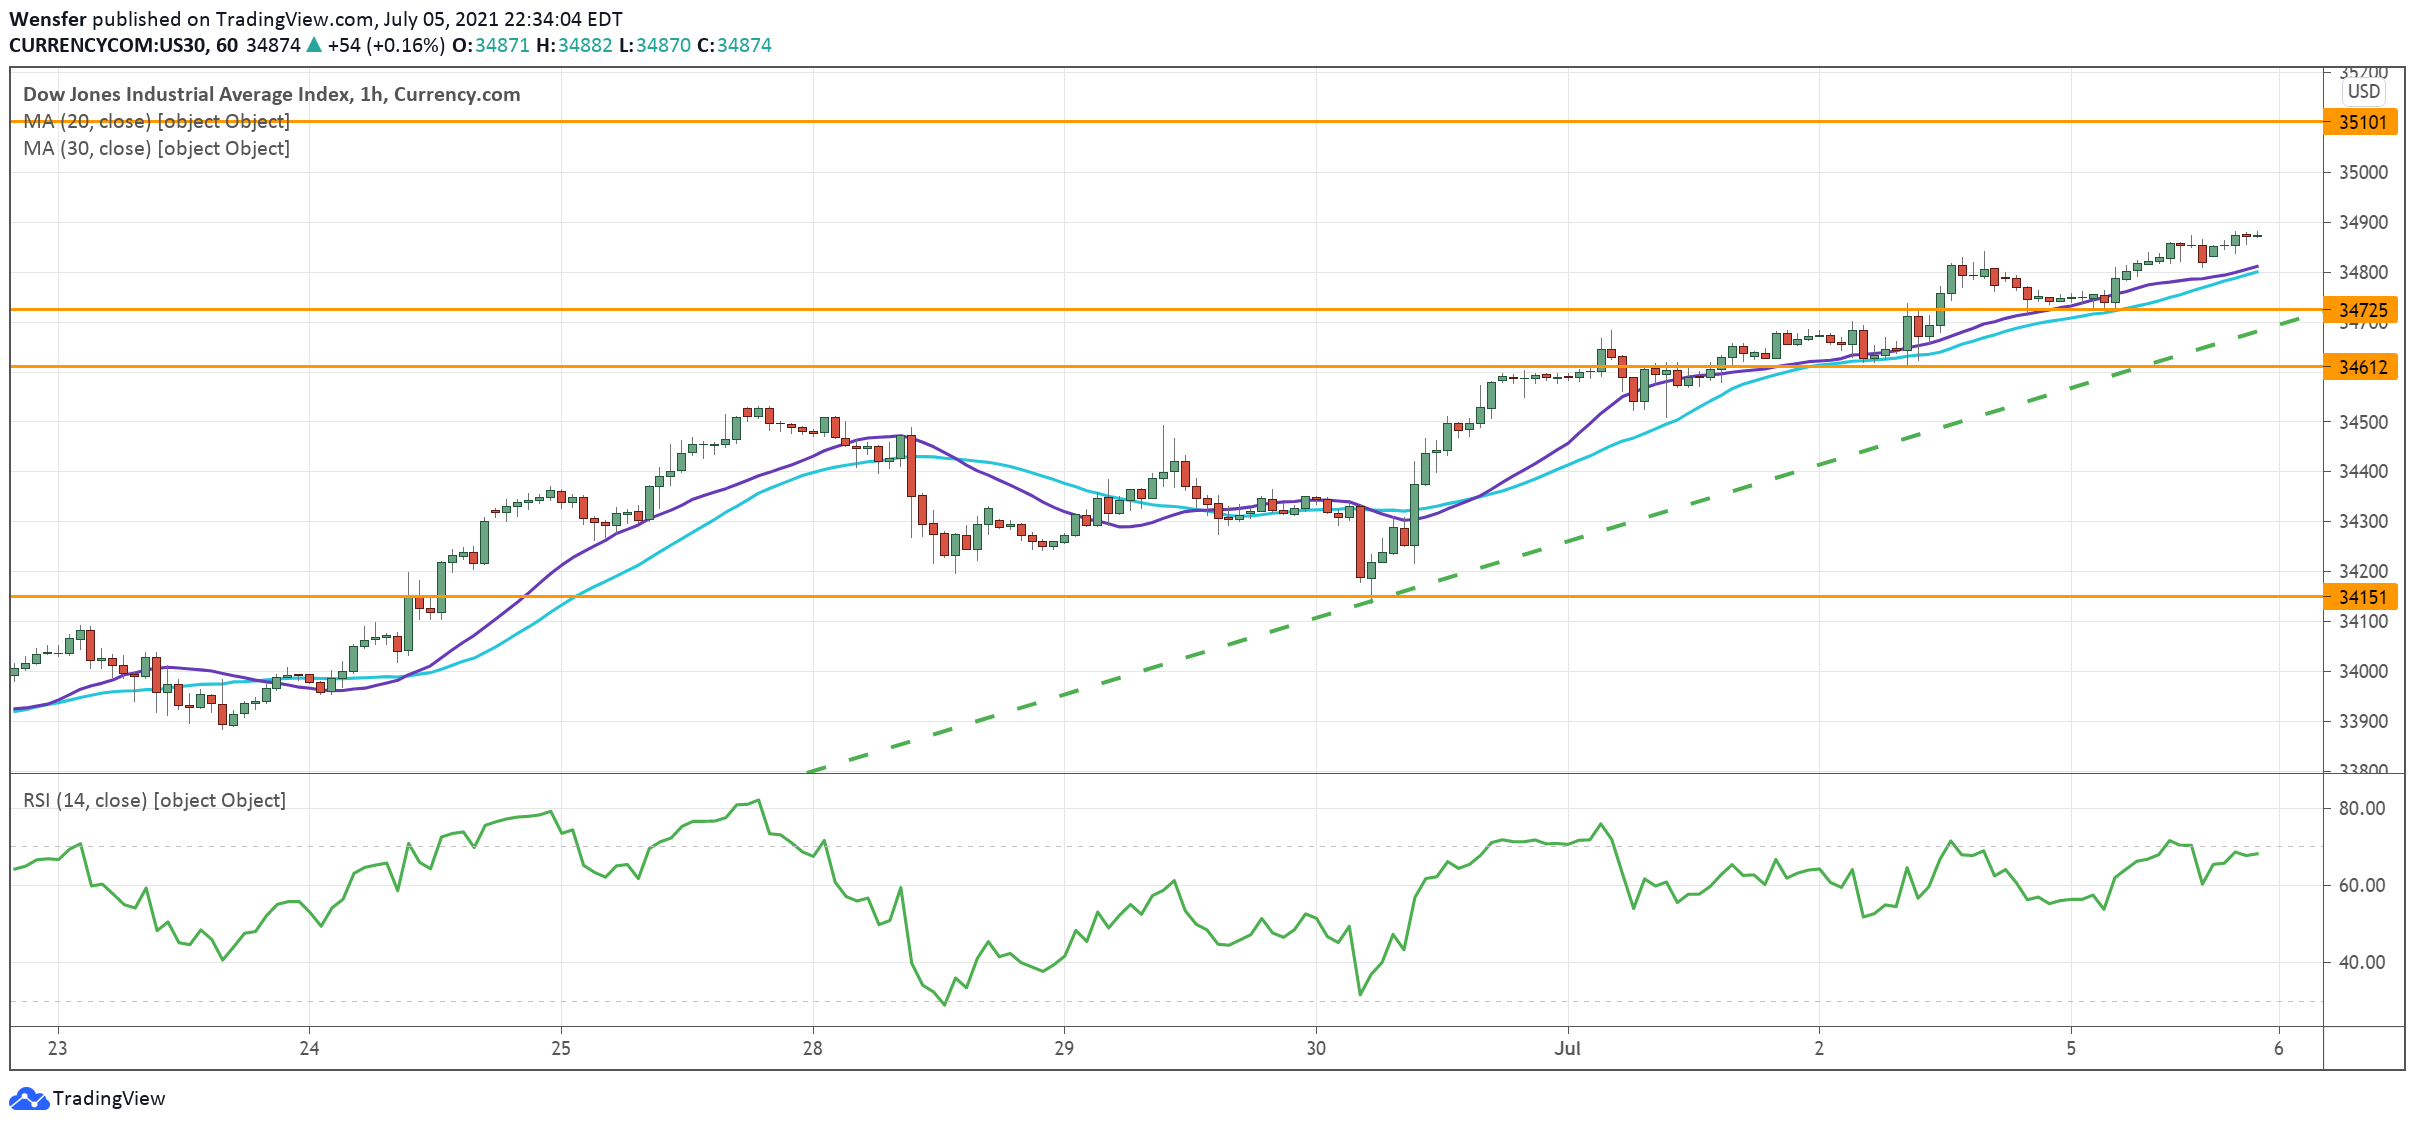
US 30 Rises Along Trendline
The Dow Jones climbs back as investors bet on a dovish Fed for the foreseeable future.
The rally above last June’s high, at 34850, indicates that the buy-side has overwhelmed the sell-side. The index keeps rising relentlessly along a bullish trendline established in late June.
Sentiment remains upbeat and the bulls are aiming for May’s peak at 35100, a prerequisite for a new record high.
An overbought RSI may trigger limited retracement. 34720 along the trendline is the immediate support in case of a pullback.
NZD/USD Faces Key Resistance
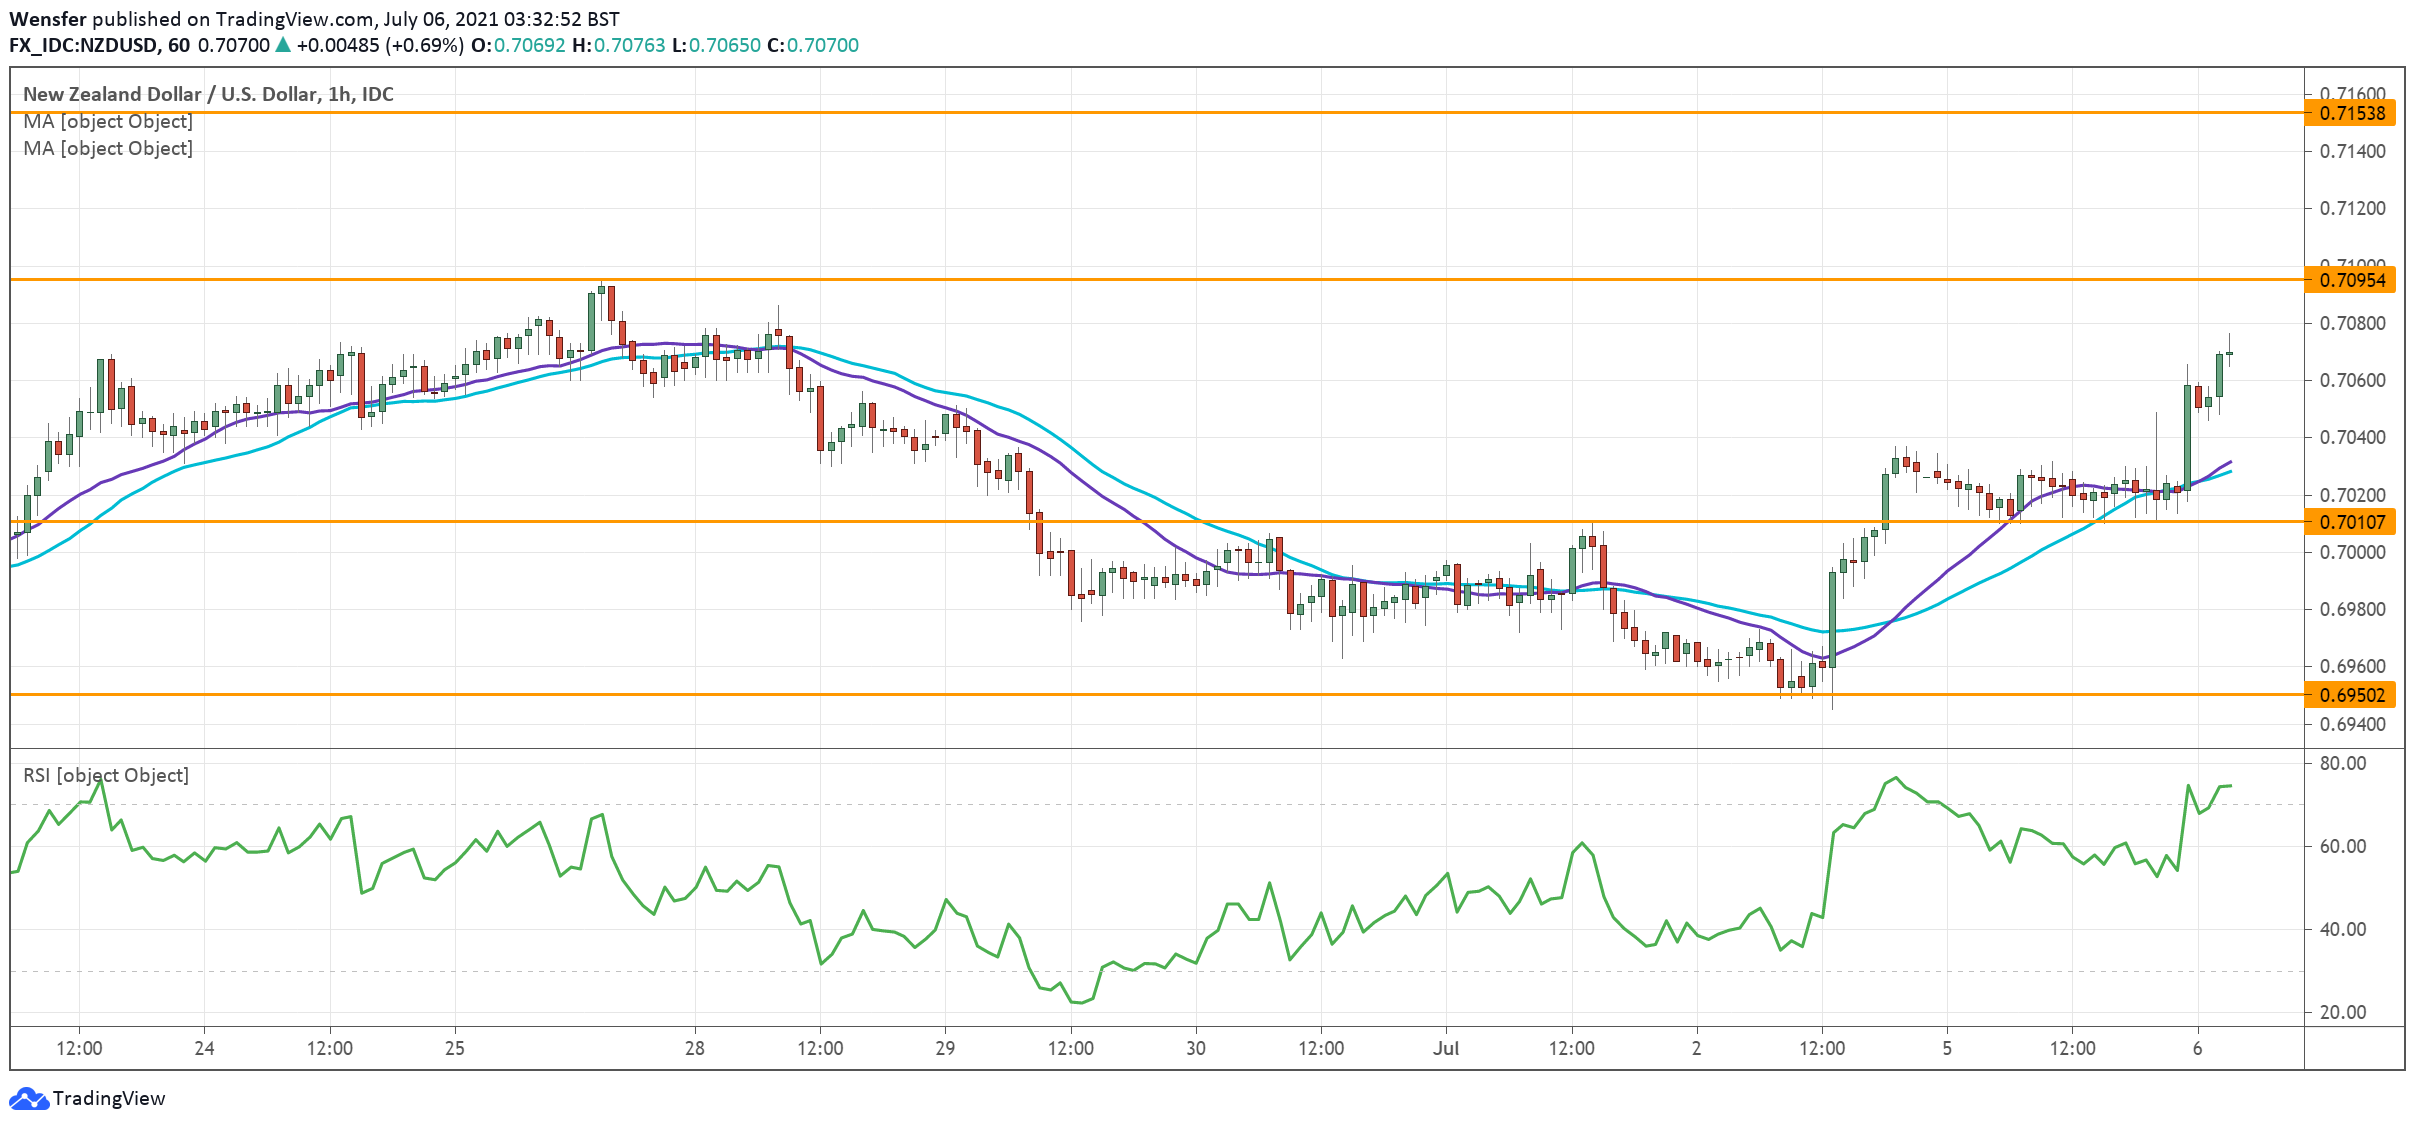
The New Zealand dollar consolidates recent gains as the market goes risk-on.
After giving up most of the recent gains, the kiwi found support at 0.6950. By clearing the psychological level of 0.7000 the bulls are sending the signal that there is still hope for a U-turn.
The RSI has again ventured into the overbought territory.
0.7095 remains a major hurdle ahead after a failed attempt. Its breach would make 0.7150 the next target. Below 0.7010 the pair could retest the base of the rebound at 0.6950.
GBP/USD Attempts Reversal
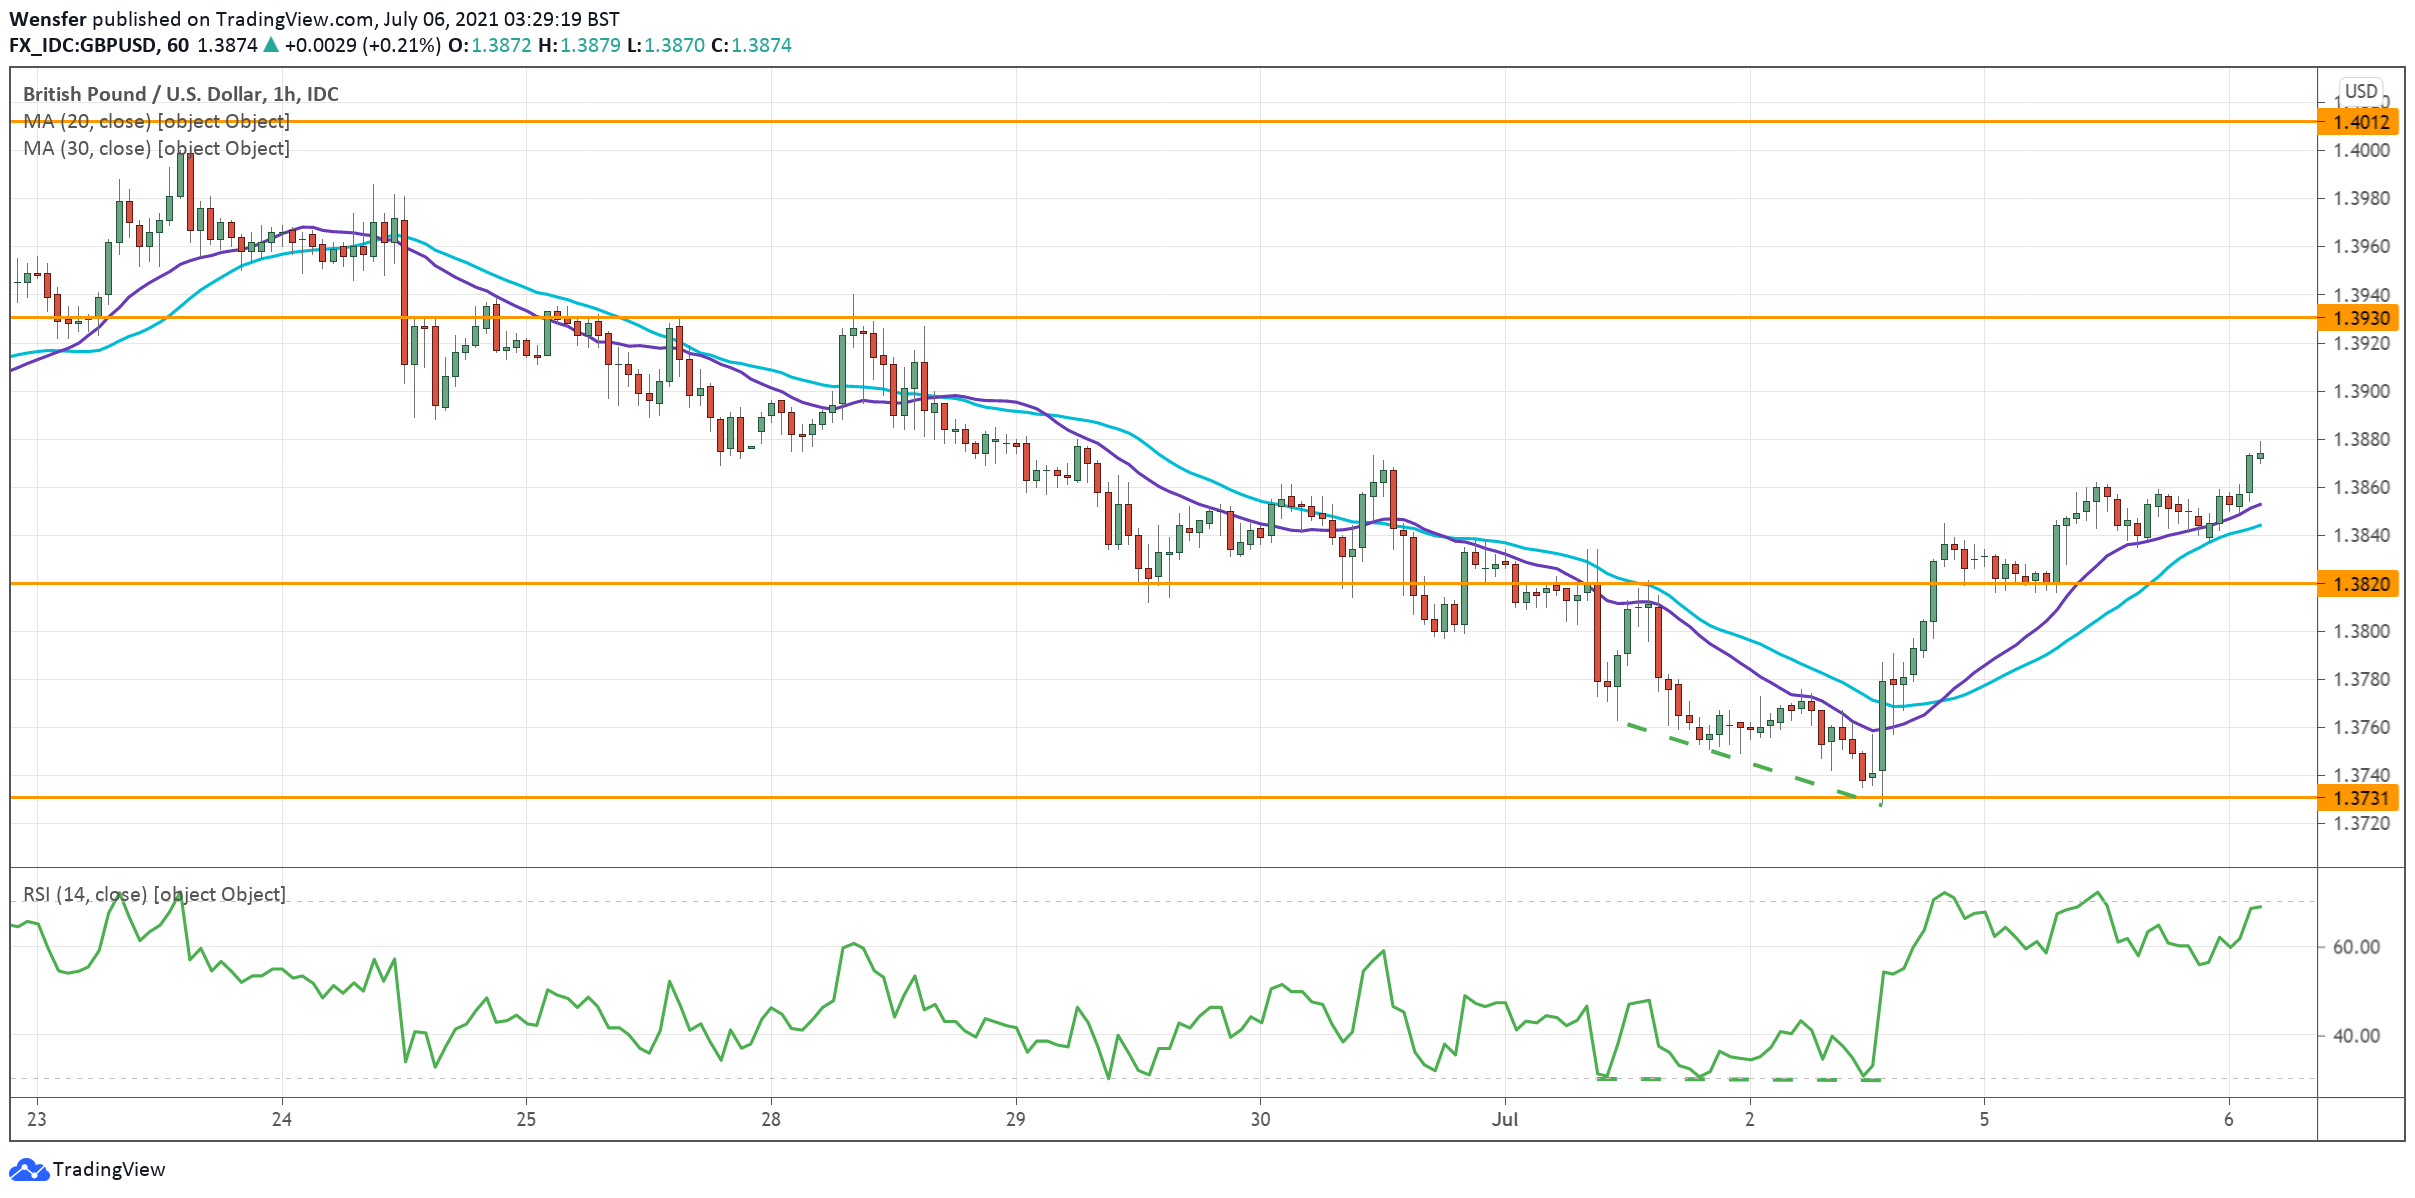
The pound jumps higher as the US dollar weakens across the board, post-NFP.
The bullish RSI divergence was a warning that the sell-off had lost steam.
The rally above 1.3820 suggests that sellers have started to take profit. Strong upward momentum is the first sign of a potential reversal. A bullish MA cross may attract more buyers to fuel the rebound.
The RSI is flirting with the overbought area. A break above 1.3930 would open the door to 1.4000. 1.3820 is the immediate support if the sterling falls back.
GBP/JPY Daily Outlook
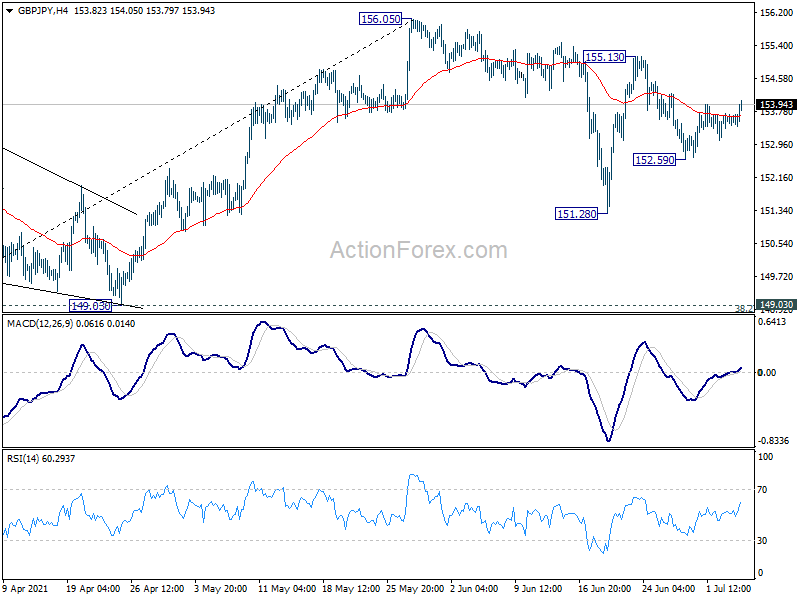
Daily Pivots: (S1) 153.50; (P) 153.63; (R1) 153.79; More...
Intraday bias in GBP/JPY remains neutral at this point and outlook is unchanged. On the downside, below 152.59 will likely extend the corrective pattern from 156.05 through 151.28 support. In this case, we'd expect strong support from 38.2% retracement of 136.96 to 156.05 at 148.75 to bring rebound. On the upside, above 155.13 will target a test on 156.05 high instead.
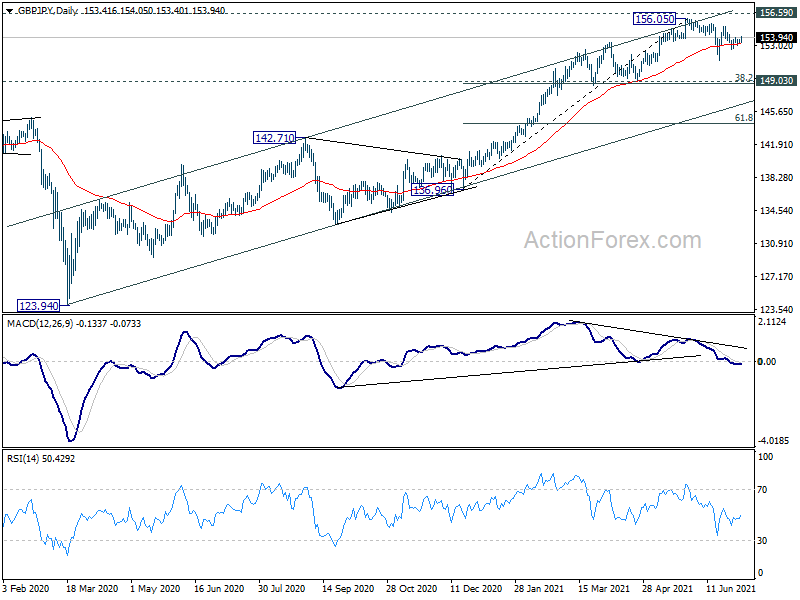
In the bigger picture, rise from 123.94 is seen as the third leg of the pattern from 122.75 (2016 low). Focus is now on 156.59 resistance (2018 high). Sustained break there should confirm long term bullish trend reversal. Next target is 61.8% retracement of 195.86 (2015 high) to 122.75 at 167.93. On the downside, break of 149.03 support is needed to be the first sign of completion of the rise from 123.94. Otherwise, outlook will remain bullish even in case of deep pull back.
GBPUSD Breaks Nearby Resistance, But A Stronger Rally Needed
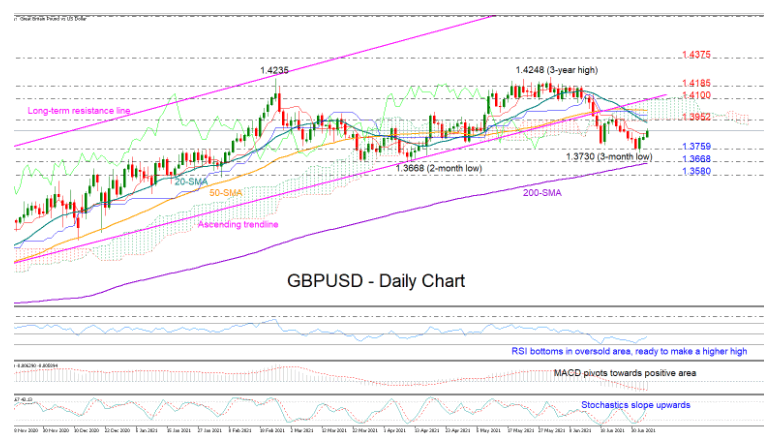
GBPUSD is gaining momentum within the 1.3800 area and above the red Tenkan-sen line, which kept the bulls under control over the past few weeks, marking its third consecutive green day.
The technical indicators endorse the ramping positive traction in the price. The RSI has bottomed in the oversold area and is set to print a new higher high, while the Stochastics is also making its way above its 20 oversold level. Adding to the encouraging signals is the MACD, which is pivoting towards the positive zone.
However, whether the latest rebound is just a correction in the short-term downward path, which paused near an almost three-month low of 1.3730, remains to be seen. The resistance area around 1.3952, where the bottom of the Ichimoku cloud is currently located, could immediately cool any bullish attempts towards the broken ascending trendline seen at 1.4100. A decisive close above that line, and more importantly an extension beyond the 1.4185 barrier, will bring the long-term uptrend back into play. Then, a clear step above the crucial 1.4235 hurdle will be needed for an outlook upgrade towards the 2018 top of 1.4375.
In the bearish scenario, if the bulls fail to breach the 1.3952 level, the price may reverse to seek support near 1.3759. Additional declines from here could experience a tougher battle near the previous low of 1.3668 and around the 200-day simple moving average (SMA), a break of which could motivate fresh selling towards 1.3580.
Summarizing, GBPUSD may recoup some of its previous losses in the short term, though a steeper rally is required above the 1.4100 - 1.4185 area to resume its positive outlook.
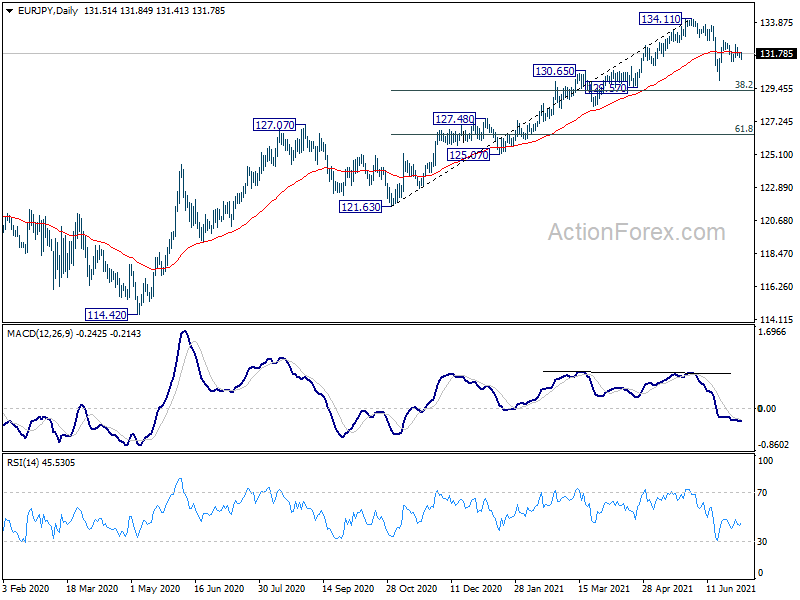
EUR/JPY Daily Outlook
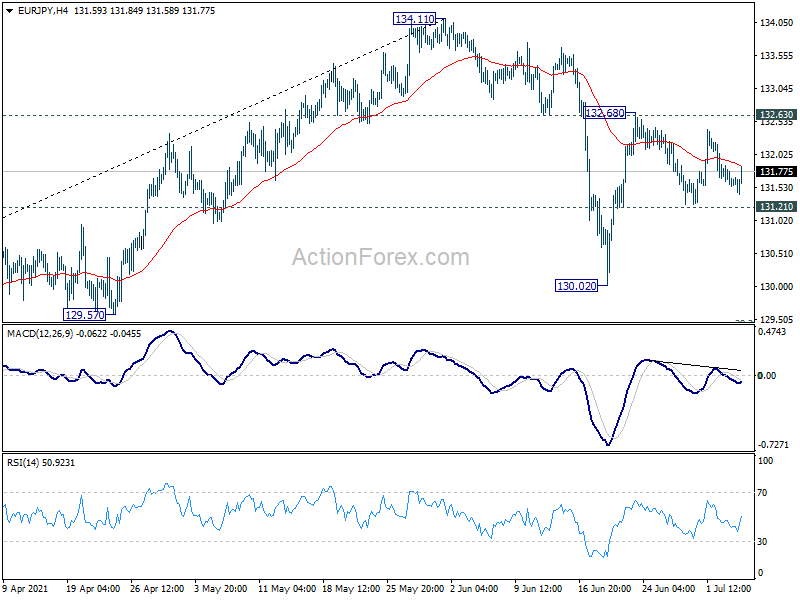
Daily Pivots: (S1) 131.52; (P) 131.69; (R1) 131.84; More....
Range trading continues in EUR/JPY and intraday bias remains neutral at this point. On the downside, break of 131.21 support will likely extend the correction from 134.11 through 130.02. But in this case, we'd expect strong support from 38.2% retracement of 121.63 to 134.11 at 129.34 to bring rebound. On the upside, break of 132.68 will bring retest of 134.11 high instead.
In the bigger picture, rise from 114.42 is seen as a medium term rising leg inside a long term sideway pattern. Next target is 137.49 (2018 high). Decisive break there will open up the possibility that it's indeed resuming the up trend from 94.11 (2012 low). For now, outlook will stay bullish as long as 127.07 resistance turned support holds, in case of pull back.
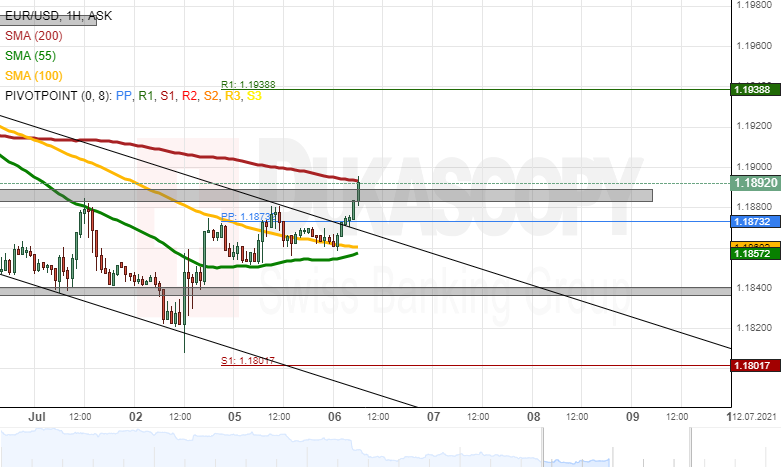
EUR/USD Analysis: Breakout Likely To Occur
The common European currency surged by 26 pips or 0.22% against the US Dollar on Monday. The surge was stopped by the weekly pivot point at 1.1873 during Monday's trading session.
Currently, the exchange rate is trading near the upper boundary of a descending channel pattern and could be set for a breakout.
If the breakout occurs, a surge towards the 1.1920 area could be expected within this session.
However, the 200– hour simple moving average at 1.1894 could provide resistance for the EUR/USD currency exchange rate today.
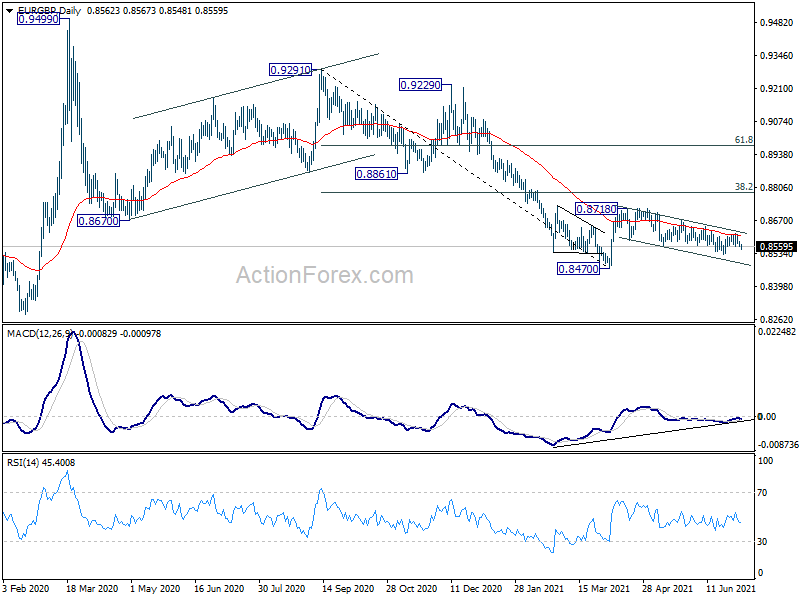
EUR/GBP Daily Outlook
Daily Pivots: (S1) 0.8559; (P) 0.8571; (R1) 0.8579; More...
Intraday bias in EUR/GBP remains neutral and outlook is unchanged. On the downside, break of of 0.8529 will resume the choppy decline towards retesting 0.8470 low. On the upside, decisive break of 0.8670 will confirm that corrective fall from 0.8718 has completed. Further rise would be seen to resume the rebound from 0.8470.
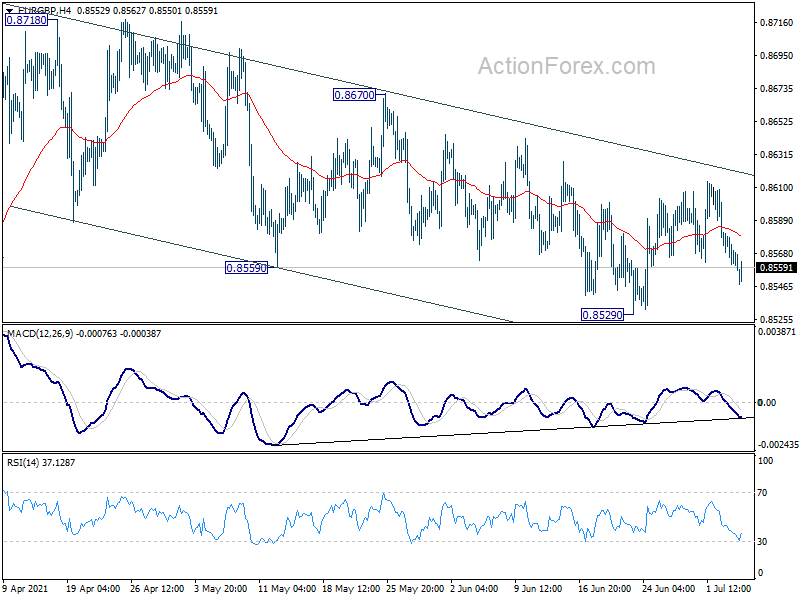
In the bigger picture, price actions from 0.9499 are still seen as developing into a corrective pattern. That is, up trend from 0.6935 (2015 low) would resume at a later stage. This will remain the favored case as long as 0.8276 support holds. However, firm break of 0.8276 support will suggest that rise from 0.6935 has completed and turn medium term outlook bearish.