Sample Category Title
Cliff Notes: Data Dependent
Key insights from the week that was.
This week, the RBA’s decision to leave the cash rate unchanged at 3.6% was widely expected, though the associated commentary struck a more cautious tone. The Board’s non-committal stance was echoed by Governor Bullock in the subsequent press conference, emphasising the greater degree of concern over the inflation outlook. This comes after August’s partial inflation data, which raised the risk that the full Q3 reading on underlying inflation may print above the RBA’s previous forecasts. Clearly, the Board is giving itself optionality as it continues to digest the data flow – but with policy still seen as “a bit restrictive”, we continue to expect the next rate cut to be delivered in November, though it is less assured than previously.
Another factor feeding into the RBA’s wariness to upside risks is consumer spending, given growth proved to be “stronger-than-expected” in Q2. However, this week’s household spending data provided more evidence that temporary factors – such as insurance payouts, holidays and discounting – played a significant role, as growth slowed to 0.1% in August following an average monthly gain of 0.5% in Q2. This was further corroborated by recent international trade data, which showed that consumption good imports are tracking a weaker pace over recent months. Growth remains positive even as households move past these one-offs, though the trend in consumer spending may remain ‘bumpy’ as households look toward discounting and sales periods in this early stage of the recovery.
This recovery in consumer spending is a key part of the ‘handover’ of growth from public to private demand, with the former now slowing more clearly. As far as the federal budget’s bottom line is concerned, the final outcome for 2024/25 revealed a better-than-expected cash deficit of $10bn (0.4% of nominal GDP) off the back of elevated commodity prices and stronger company and income tax receipts. Although growth in public spending has slowed recently, the higher level of public spending will see the budget remain in deficit over the next decade.
Before moving offshore, a final note on housing. The latest Cotality (formerly CoreLogic) data pointed to another pick-up in house price growth, lifting 0.9% in September. The combination of firmer homebuyer sentiment and RBA rate cuts to date have played a key role, as evinced by the commensurate lift in housing credit. Tight supply will also have a hand in supporting price growth near-term, with Westpac forecasting a 6% lift in 2025 overall. Looking further ahead, affordability constraints loom as a key risk that could temper price growth, and although recent data on dwelling approvals does not bode well for the front-end of the pipeline, continued progress on the large existing stock of dwelling projects should go some way to alleviating supply constraints medium-term.
Offshore markets once again focused on the US, where negotiations over government spending reached an impasse, resulting in a shutdown. A key implication is the delay of major data releases such as nonfarm payrolls and CPI, as outlined in the Department of Labor's Contingency Plan. The plan also states that “all active data collection activities for BLS surveys will cease,” raising the risk of data quality issues, the extent of which will depend on the shutdown’s duration.
Elsewhere in the US, the ISM Manufacturing PMI for September rose to 49.1pts. Within the details, the prices component fell 1.8pts to 61.9pts—still well above the five-year pre-COVID average of 55.8pts. The employment index edged up to 45.3pts, signalling a labour market that remains subdued in a “low hiring, low firing” environment.
Across the Pacific, China’s NBS Manufacturing PMI for September was slightly more upbeat at 49.8pts, with most sub-indicators improving. Overcapacity in the manufacturing sector was evident, with strong gains in production (+1.1pts) and inventory (+1.4pts), while output prices fell by 0.9pts. The impact of recent “involution” policies aimed at curbing overproduction has yet to materialise. Conversely, the Non-Manufacturing PMI slipped 0.3pts to 50.0pts, largely due to a 1.3pt drop in prices charged. Weak demand was reflected in declines in activity and new orders. These results strengthen the case for future stimulus measures focused on boosting household demand. China’s next Five-Year Plan (2026–30) will be discussed from 20–23 October, where additional demand-side stimulus could be announced.
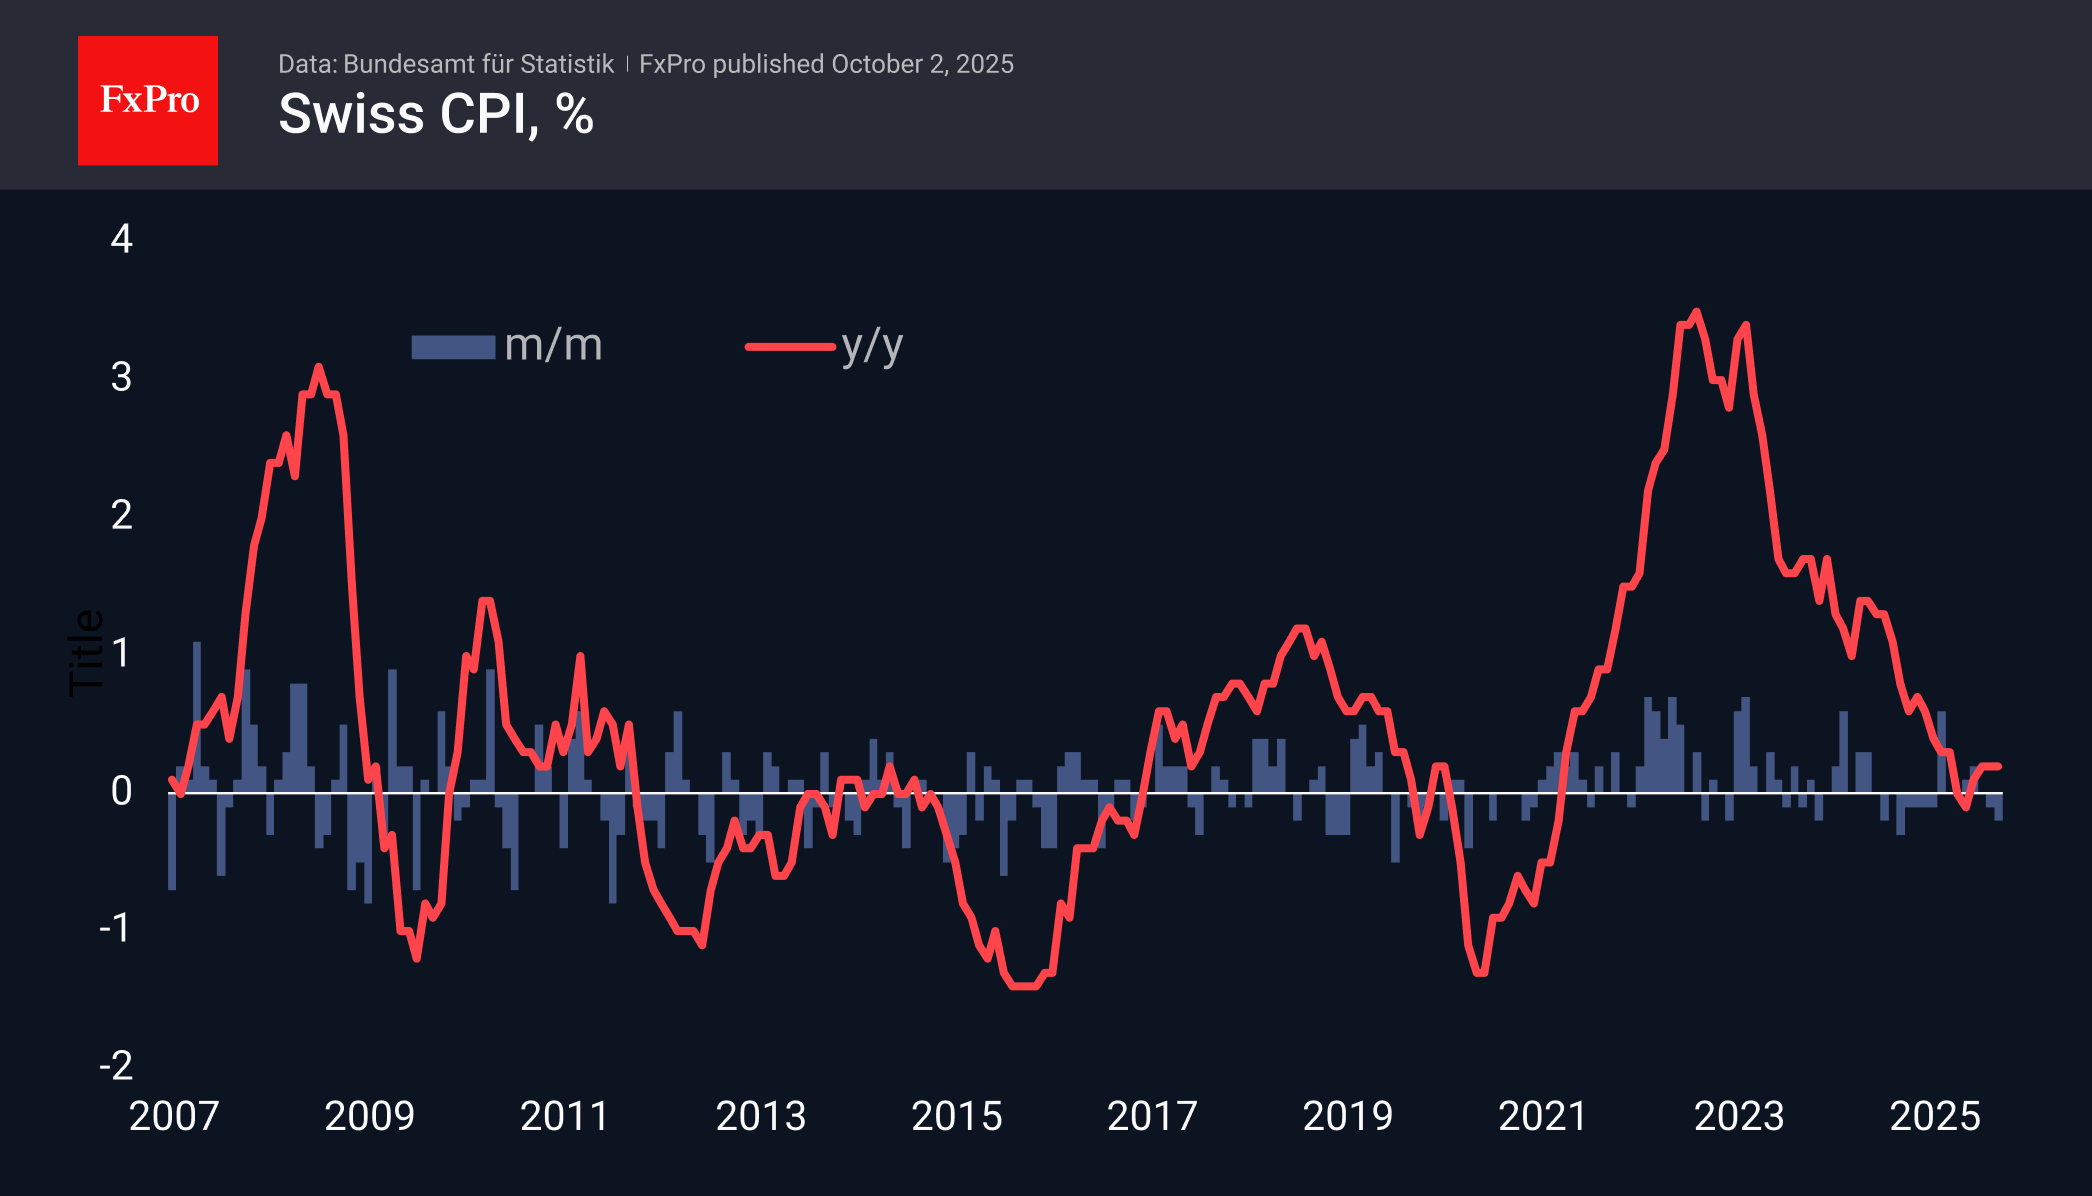
Low Inflation in Switzerland Confirms Strength of Franc
Consumer prices in Switzerland fell by 0.2% in September. Annual price growth was 0.2%, remaining at this level for the last three months and slightly below the average forecast of 0.3%.
The decline was due to the strengthening of the franc, which lowered prices for air and transport services. These data are further evidence that the Swiss National Bank had room to cut rates. However, at its last meeting, it preferred to keep them at zero, opting for more situational measures – currency interventions.
Earlier, it was reported that at the end of the month, the SNB conducted its most significant currency interventions in many years to weaken the franc. However, these measures were intended to maintain the exchange rate ceiling, not to scare market participants.
As a result, EURCHF has continued to trade just below 0.9350 for the last four weeks and within a 1.5% range symmetrically around this mark for the last five months. This does not look like a smooth reversal. Rather, it looks like the formation of a floor in the pair, like what happened from 2012 to 2014, but without official confirmation.
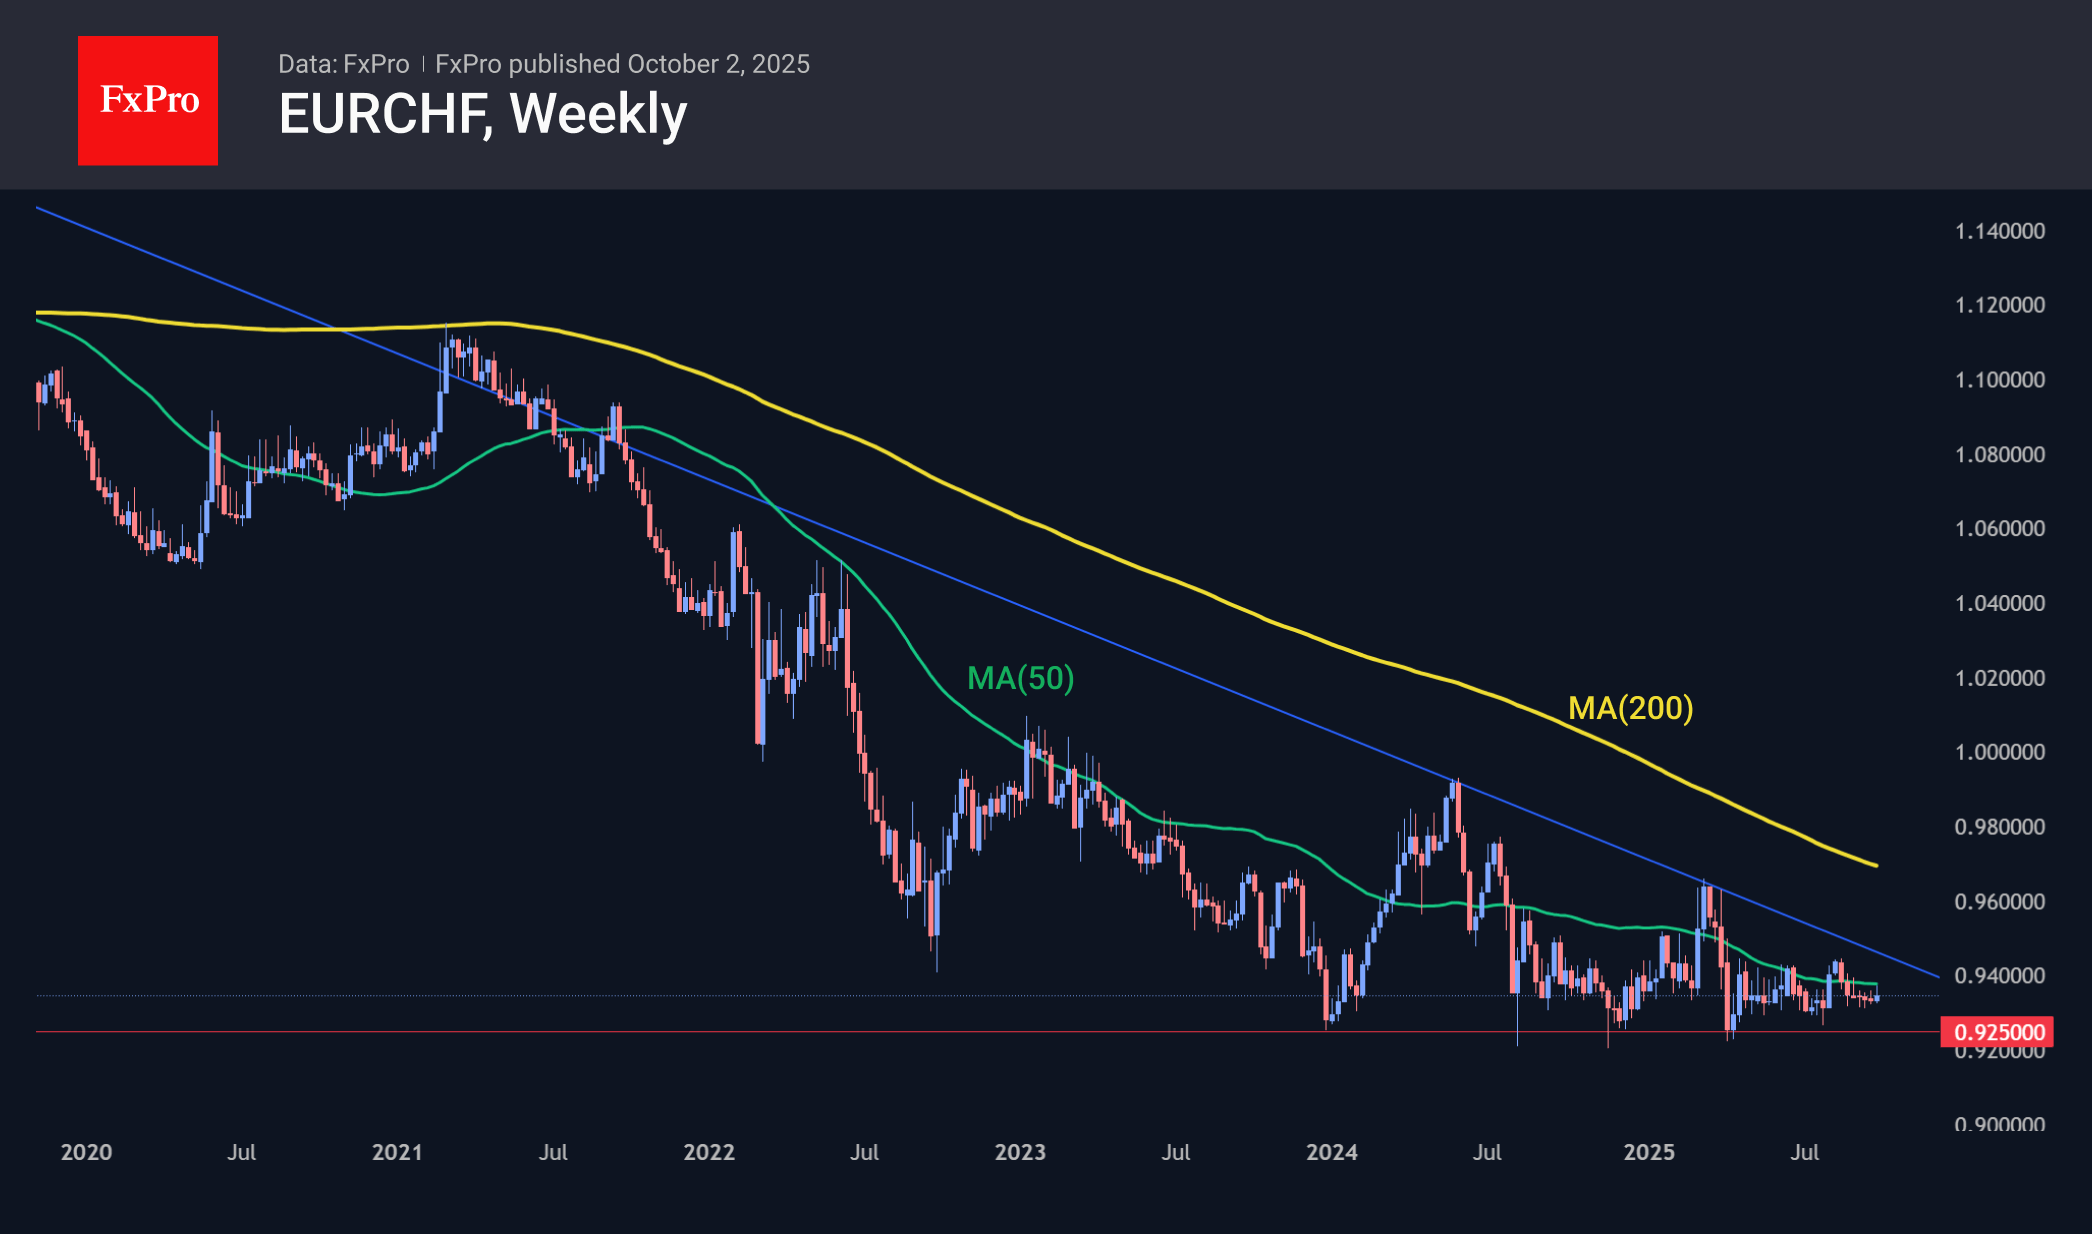
It is generally accepted that low inflation is bearish news for a currency. However, there is an important exception to this rule: it only works if the central bank is expected to ease monetary policy. This is not the case in Switzerland, which historically has lower inflation than its European neighbours and a long-standing trend of franc appreciation. Interestingly, Switzerland manages to maintain a foreign trade surplus and sustain capital inflows, which also works in favour of the currency in the long term.
Sunset Market Commentary
Markets
Bank of Japan Deputy Governor Uchida left little room for doubt in a brief speech at a financial conference in Tokyo. He said that “if the outlook for economic activity and prices is realized, the Bank of Japan will continue to raise the policy interest rate and adjust the degree of monetary accommodation”. Uchida commented on yesterday’s quarterly Tankan survey which indicated that business sentiment is at a favorable level. Large firms across all industries plan a capex increase of 12.5% on average in the fiscal year from April. Businesses also indicated that they expect inflation to be 2.4% Y/Y in 5 years’ time, more than the 2.3% in the Q2 survey and above the BoJ’s 2% inflation target. The Japanese central bank labelled this metric as a key one in interpreting longer term inflation expectations. Uchida furthermore mentioned that uncertainty regarding the outlook has eased following the US-Japanese trade deal. The market implied probability of a BoJ rate hike (0.5% to 0.75%; first since January) end this month remained broadly stable at around 2/3 after the Uchida comments. The likelihood has been rising steadily over the past month since two out of nine BoJ members already supported such action in September. A shift by dovish BoJ Noguchi and the Tankan survey added to that sentiment. Overnight, BoJ governor Ueda can seal the deal in a speech in Osaka. We think that markets don’t completely align with BoJ rhetoric yet because of this weekend’s leadership elections at the Liberal Democratic Party (LDP). Two frontrunners have different views on fiscal and monetary policy. Shinjiro Koizumi favors fiscal discipline and gradual monetary tightening. Sanae Takaichi on the other hand is an adept of Abenomics, combining continuous monetary and fiscal support. Especially if Takaichi wins, there’s a possibility that the BoJ opts for more domestic political clarity as snap elections before the end of the month can’t be ruled out. A 5-day JPY rally comes to an end today with USD/JPY steady at 147 and EUR/JPY at 172.50. Bullish risk sentiment tempers JPY-strength. The overall climate of low volatility, amplified by the stable ECB outlook and by the US government shutdown and absence of eco release, proved fertile ground for stock markets at the start of the new quarter. The EuroStoxx 50 gains 1.5% today, more than confirming yesterday’s technical break above the previous YtD/all-time top at 5568. US stock markets open a modest 0.15% higher.
News & Views
UK firms assessed that in the three months to September their annual realized price growth rose slightly, by 0.1% to 3.8%, according to the monthly Decision Making Survey of the Bank of England. Firms expect their year-ahead own-price inflation to be 3.7%, unchanged from the three months to July. Expectations for year-ahead CPI inflation rose by 0.1 percentage points to 3.4%. The corresponding measure for three-year ahead CPI inflation expectations was unchanged at 2.9%. All indicators thus stay well above the 2% BoE inflation target. Aside from the assessment on inflation, firms reported annual wage growth at 4.6% in the three months to September (unchanged). Expected year-ahead wage growth remained at 3.6%. Realized employment growth remained at a negative -0.5%. while expectations for employment growth over the next year weakened to 0.0% (from 0.2%). With respect to recruitment, 9% reported recruitment to be more difficult (idem average Feb/Apr). The average proportion of firms reporting that it was easier than normal to recruit staff was 19%, 1 ppt below the Feb/Apr average. 58% of firms reported that uncertainty facing their business was high or very high, a 1 ppt increase.
Swiss inflation remained low in September. CPI declined 0.2% M/M resulting in unchanged 0.2% Y/Y inflation. The market consensus expected a slight rise to 0.3% Y/Y. According to the Swiss Federal Statistical office, the 0.2% M/M decrease is due to several factors including lower prices for supplementary accommodation and hotels, along with those for international package holidays and air transport. Prices for domestic products printed at -0.3% M/M and +0.6% Y/Y. Prices of imported products declined 0.1% M/M to be 0.9% lower compared to the same month last year. Core inflation also declined 0.2 M/M with the Y/Y measure holding stable at 0.7%. The Swiss National Bank (SNB) in its September monetary policy assessment indicated that it expected inflation to be slightly higher short-term. This at least isn’t confirmed by today’s data. The bar for the SNB to return to a negative policy rate is quite high (but not excluded). At the same time, the SNB earlier this week published that it intervened in the FX market for an amount of CHF 5.1bn in Q2. Also this tool remains available if the SNB wants to avoid further deflationary impact from a strong franc. The franc today declined marginally against the euro after the CPI release (EUR/CHF 0.935).
EUR/USD Mid-Day Outlook
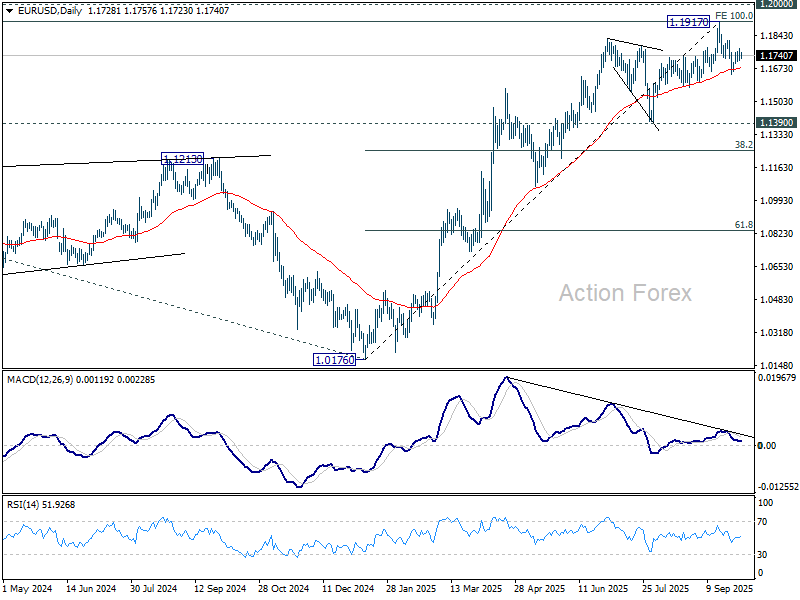
Daily Pivots: (S1) 1.1705; (P) 1.1742; (R1) 1.1768; More...
No change in EUR/USD's outlook and intraday bias remains neutral. Considering bearish divergence condition in D MACD, sustained trading below 55 D EMA (now at 1.1675) will argue that 1.1917 was already a medium term top. Deeper fall should then be seen to 1.1390 support next. Nevertheless, break of 1.1819 will bring retest of 1.1917 high instead.
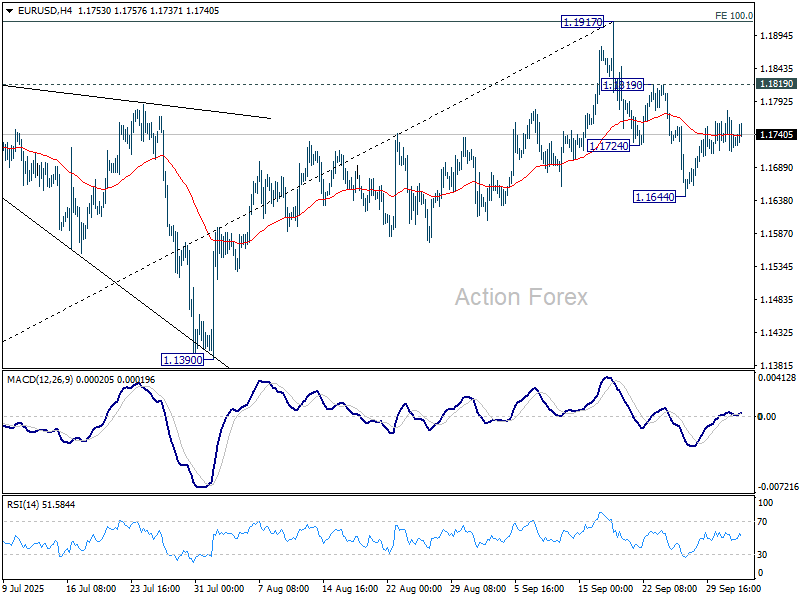
In the bigger picture, rise from 1.0176 (2025 low) is seen as the third leg of the pattern from 0.9534 (2022 low). 100% projection of 0.9534 to 1.1274 from 1.0176 at 1.1916 was already met. For now, further rally will remain in favor as long as 1.1390 support holds, and firm break of 1.2000 psychological level will carry larger bullish implications. However, firm break of 1.1390 will suggest that rise from 1.0176 has already completed and bring deeper fall to 55 W EMA (now at 1.1231).
GBP/USD Mid-Day Outlook
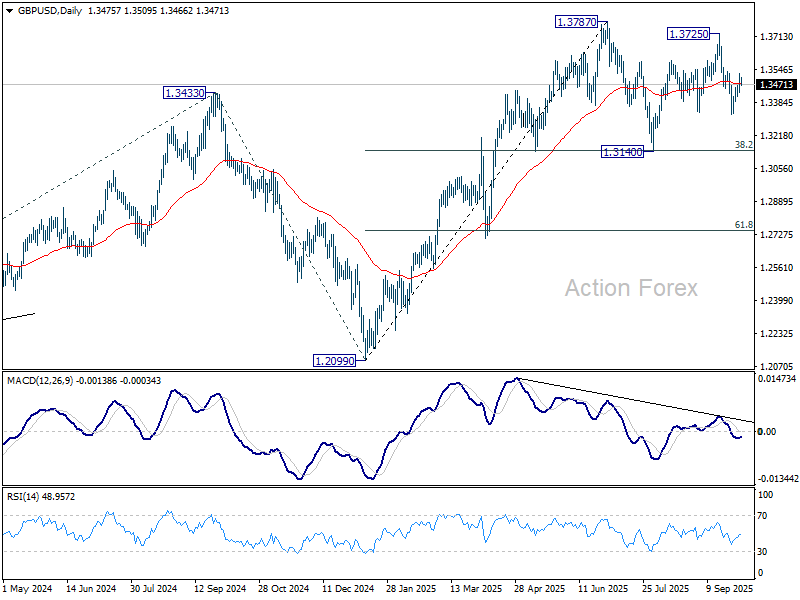
Daily Pivots: (S1) 1.3432; (P) 1.3479; (R1) 1.3524; More...
Intraday bias in GBP/USD remains neutral at this point. On the upside, firm break of 1.3535 resistance will suggest that pullback from 1.3725 has completed, and bring stronger rally to 1.3725/87 key resistance zone. On the downside, though, break of 1.3322 will resume the fall from 1.3725, as the third leg of the corrective pattern from 1.3787, and target 1.3140 support.
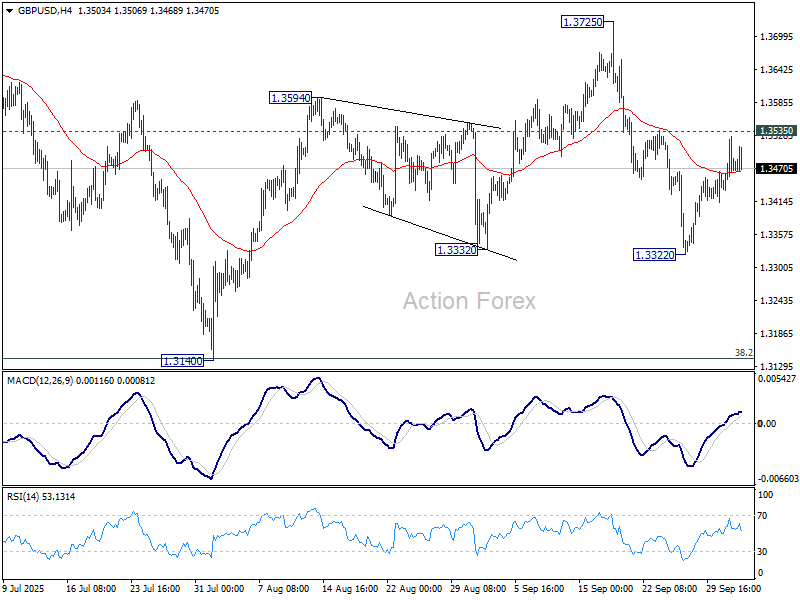
In the bigger picture, rise from 1.0351 (2022 low) is still seen as a corrective move. Further rally could be seen to 61.8% projection of 1.0351 to 1.3433 (2024 high) from 1.2099 (2025 low) at 1.4004. But strong resistance could be seen from 1.4248 (2021 high) to limit upside. Sustained break of 55 W EMA (now at 1.3155) will argue that a medium term top has already formed and bring deeper fall back to 1.2099.
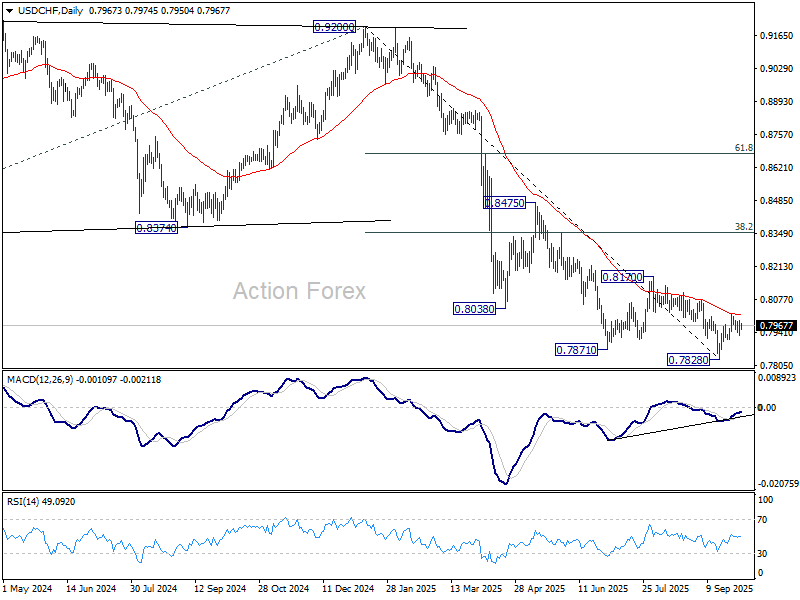
USD/CHF Mid-Day Outlook
Daily Pivots: (S1) 0.7937; (P) 0.7963; (R1) 0.7998; More…
Intraday bias in USD/CHF remains neutral and more sideway trading could be seen. On the upside, sustained trading above 55 D EMA (now at 0.8011) will suggest that rise from 0.7828 is already correcting whole fall from 0.9200. Further rise should the be seen to 0.8170 resistance and possibly above. However, break of 0.7908 will turn bias back to the downside for retesting 0.7828 low.
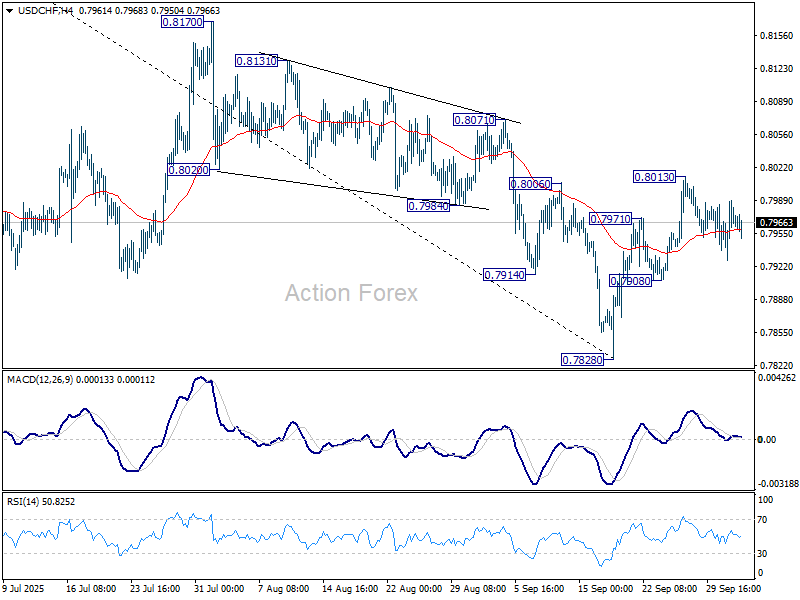
In the bigger picture, long term down trend from 1.0342 (2017 high) is still in progress. Next target is 100% projection of 1.0146 (2022 high) to 0.8332 from 0.9200 at 0.7382. In any case, outlook will stay bearish as long as 0.8332 support turned resistance holds (2023 low).
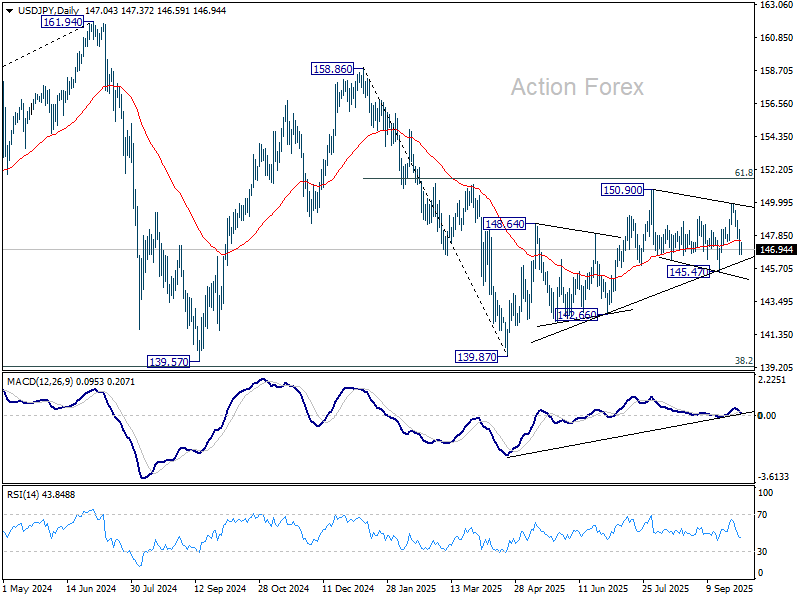
USD/JPY Mid-Day Outlook
Daily Pivots: (S1) 146.37; (P) 147.30; (R1) 148.01; More...
USD/JPY's fall from 149.95 continues today and intraday bias stays on the downside for 145.47. Strong support from there will keep the pattern from 150.90 corrective. That is, rise from 139.87 would still be in favor to resume at a later stage. On the upside, above 148.12 minor resistance will turn intraday bias neutral first. However, decisive break of 145.47 will indicate near term reversal, and bring deeper fall to 142.66 support next.
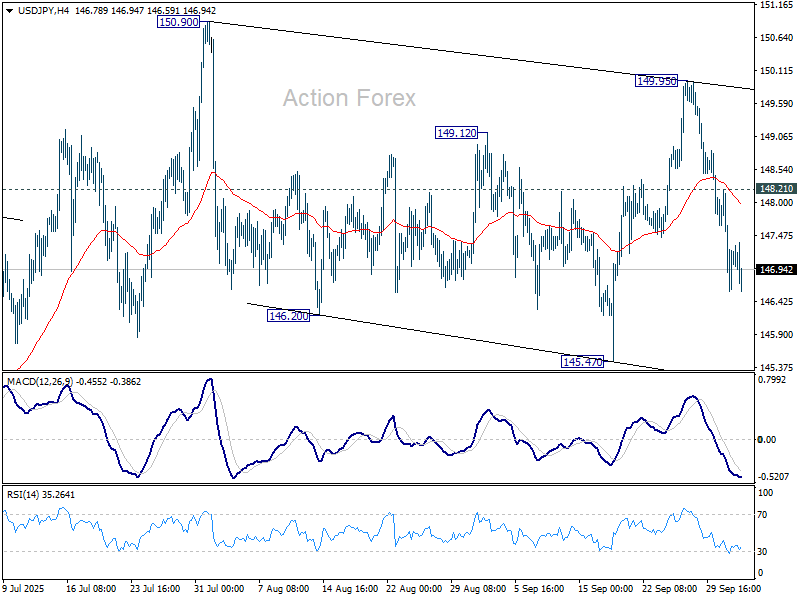
In the bigger picture, price actions from 161.94 (2024 high) are seen as a corrective pattern to rise from 102.58 (2021 low). Decisive break of 61.8% retracement of 158.86 to 139.87 at 151.22 will argue that it has already completed with three waves at 139.87. Larger up trend might then be ready to resume through 161.94 high. In case the corrective pattern extends with another fall, strong support is expected from 38.2% retracement of 102.58 to 161.94 at 139.26 to bring rebound.
Dollar Slightly Softer as Bessent Warns Shutdown Could Hit GDP
Dollar is slightly softer today but not under heavy selling pressure. US Treasury Secretary Scott Bessent cautioned in a CNBC interview that the current government shutdown could hurt economic performance. “We could see a hit to the GDP, a hit to growth and a hit to working America,” he warned, adding that such brinkmanship is “not the way to have a discussion.”
While the shutdown so far has had little direct impact on sentiment, the risk of delayed economic data releases, including nonfarm payrolls, continues to hang over markets. That uncertainty, combined with softer labor signals, has capped the Dollar’s upside.
Meanwhile, Yen’s broad-based strength extended, supported by remarks from BoJ Deputy Governor Shinichi Uchida. His comments were not groundbreaking but were interpreted as upbeat, particularly in his reference to receding uncertainty around US tariffs, which investors see as reinforcing the BoJ’s direction toward further rate hikes.
Still, Uchida offered no firm signal on timing, leaving markets uncertain about whether the BoJ will move as soon as this month. Traders are now looking ahead to Governor Kazuo Ueda’s speech tomorrow, which may provide clearer guidance on whether October or December is the more likely window for another hike.
In terms of weekly performance, Yen remains the strongest currency, followed by Aussie and Kiwi, both supported by risk-on sentiment in Asia-Pacific. Loonie and Dollar sit at the bottom of the table, while Euro, Sterling, and Swiss Franc are trading mixed in the middle.
In Europe, at the time of writing, FTSE is up 0.04%. DAX is up 1.38%. CAC is up 1.38%. Germany 10-year yield is down -0.003 at 2.715. UK 10-year yield is up 0.027 at 4.722. Earlier in Asia, Nikkei rose 0.87%. Hong Kong HSI rose 1.61%. China was on holiday. Singapore Strait Times rose 1.67%. Japan 10-year JGB yield rose 0.014 to 1.666.
BoE survey shows inflation expectations edge higher, uncertainty still elevated
UK firms reported a slight uptick in inflation expectations in September, according to the BoE’s Decision Maker Panel survey. Year-ahead CPI expectations rose by 0.1 percentage point to 3.4%, while three-year expectations were unchanged at 2.9%.
Wage growth expectations held steady at 3.6% on a three-month basis, though the single-month figure rose by 0.3 percentage points to 3.8%.
The survey highlighted ongoing concerns around the business outlook. Some 58% of firms judged overall uncertainty as high or very high, up slightly from 57% in August. That said, uncertainty surrounding year-ahead sales dipped marginally to 4.3%, while price uncertainty was unchanged at 1.7%, both far below the levels seen during past peaks.
Swiss CPI holds low 0.2% in September, core steady at 0.7%
Swiss consumer prices dipped -0.2% mom in September, in line with expectations. Core CPI also dropped -0.2% mom. Domestic product prices fell -0.3% mom while imported product prices slipped -0.1% mom.
On an annual basis, headline CPI was unchanged at 0.2% yoy, slightly below the 0.3% forecast but positive for a fourth straight month.
Core inflation, excluding fresh and seasonal items as well as energy, held steady at 0.7% yoy. Domestic prices were unchanged at 0.6% yoy. Imported prices swung higher, rising to -0.9% yoy from -1.3% previously.
BoJ’s Uchida: Economy resilient, inflation to re-accelerate gradually
BoJ Deputy Governor Shinichi Uchida highlighted resilience in Japan’s economy, pointing to positive corporate sentiment in the Tankan survey and improved manufacturer outlooks as trade uncertainty with the US has eased. He noted that despite tariff-related profit pressures for some firms, revenues remain elevated, capital expenditure is trending higher, and consumption is firm.
On inflation, Uchida said underlying price growth may stagnate in the near term but should re-accelerate gradually as expectations rise. This suggests the BoJ continues to see progress toward achieving its price stability goal, albeit at a measured pace.
Reaffirming the policy stance, Uchida said the BoJ will continue lifting rates if economic and price trends evolve as projected, while remaining data-dependent. He stressed that decisions will be guided by evidence, not pre-set commitments.
USD/JPY Mid-Day Outlook
Daily Pivots: (S1) 146.37; (P) 147.30; (R1) 148.01; More...
USD/JPY's fall from 149.95 continues today and intraday bias stays on the downside for 145.47. Strong support from there will keep the pattern from 150.90 corrective. That is, rise from 139.87 would still be in favor to resume at a later stage. On the upside, above 148.12 minor resistance will turn intraday bias neutral first. However, decisive break of 145.47 will indicate near term reversal, and bring deeper fall to 142.66 support next.
In the bigger picture, price actions from 161.94 (2024 high) are seen as a corrective pattern to rise from 102.58 (2021 low). Decisive break of 61.8% retracement of 158.86 to 139.87 at 151.22 will argue that it has already completed with three waves at 139.87. Larger up trend might then be ready to resume through 161.94 high. In case the corrective pattern extends with another fall, strong support is expected from 38.2% retracement of 102.58 to 161.94 at 139.26 to bring rebound.
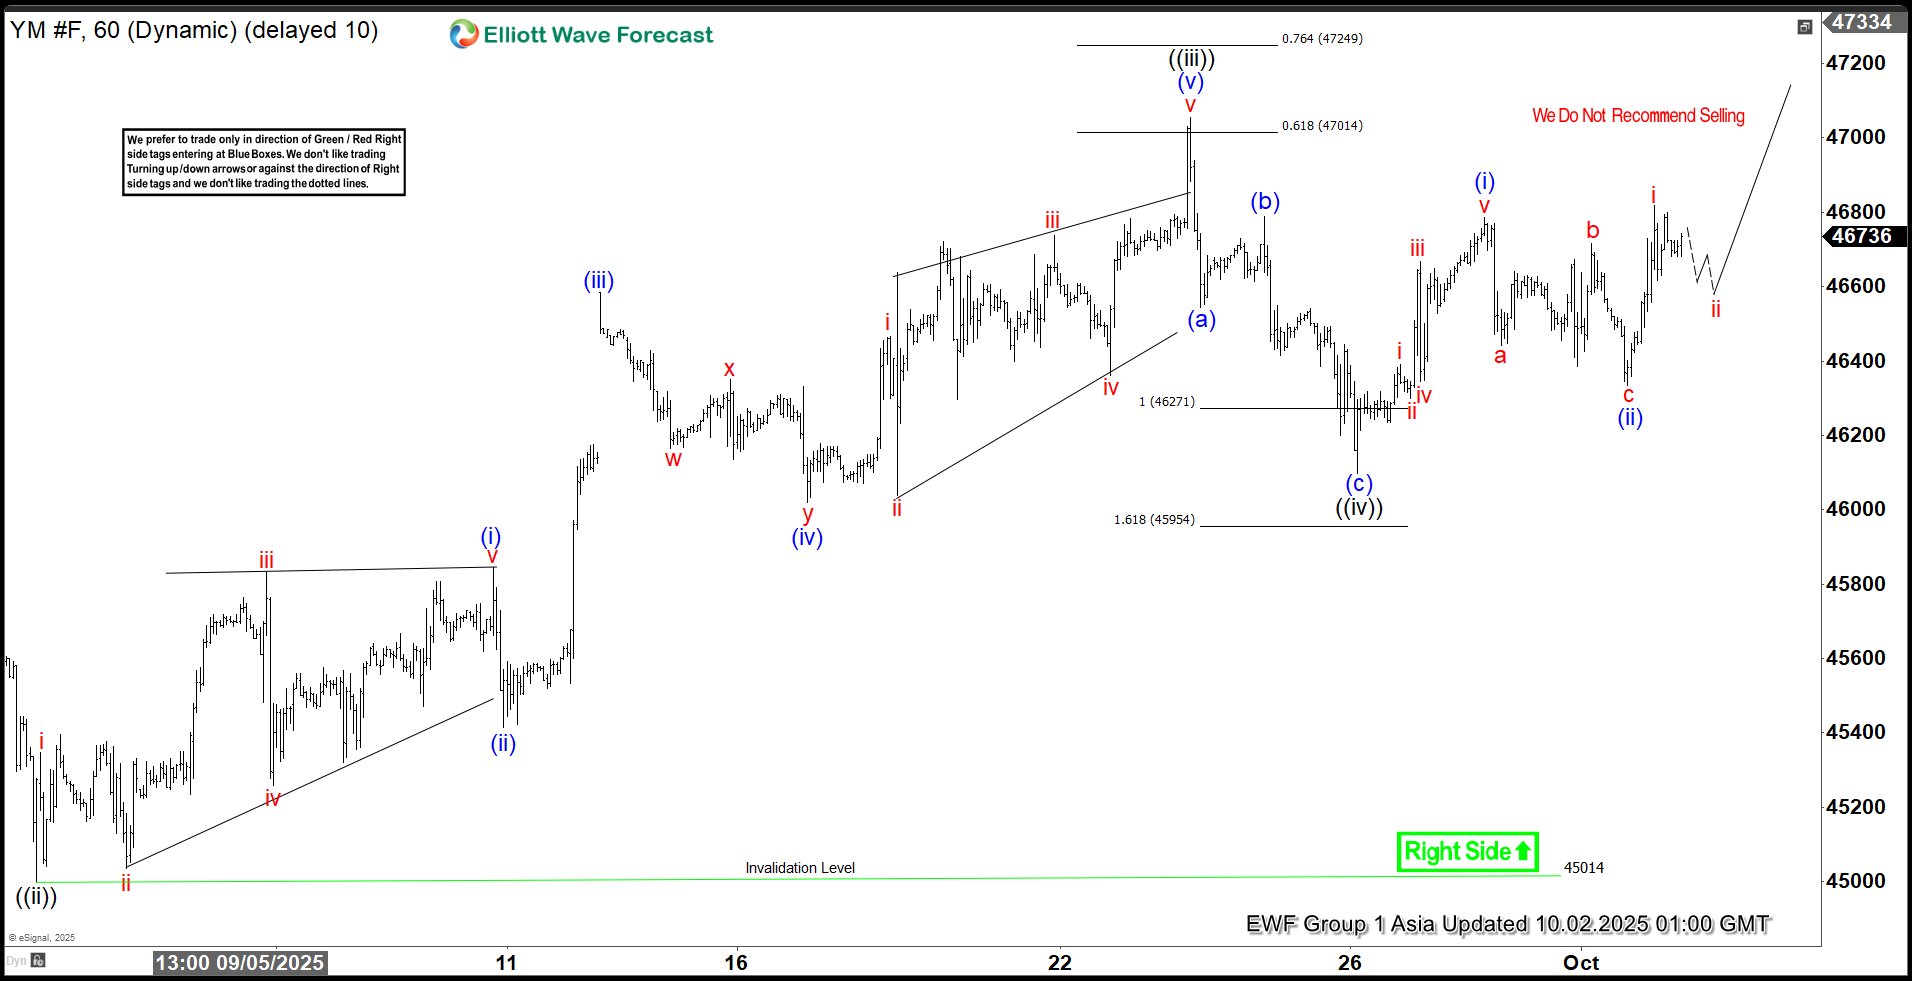
Dow Futures (YM_F) Elliott Wave Calling the Rally After 3 Waves Pull Back
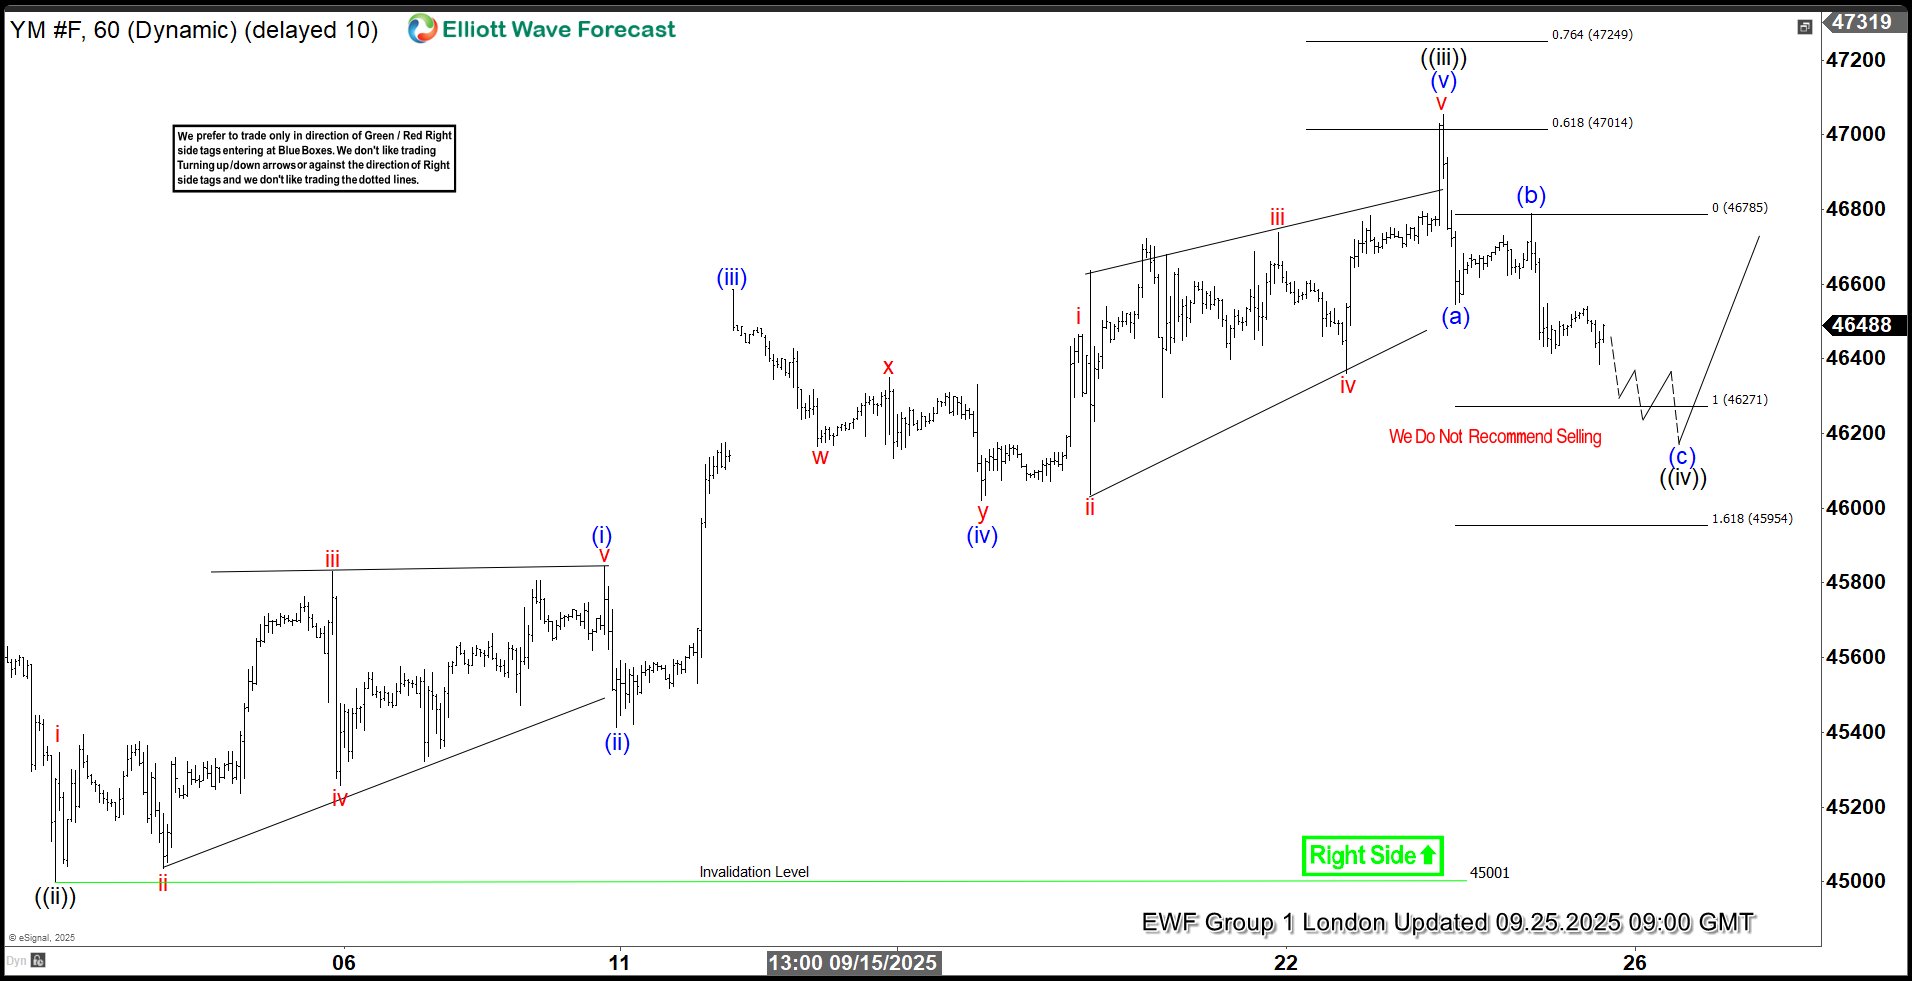
Hello fellow traders. In this technical article, we are going to present Elliott Wave charts of Dow Futures (YM_F) . As our members know, YM_F has been showing impulsive bullish sequences in the cycle from the August 43456 low, pointing to further strength ahead. We have been calling for a rally in Dow Futures. Recently we got an intraday pullback labeled wave ((iv)), which landed right in the equal‑legs zone. In the following section, we’ll explain our Elliott Wave count and present the target area for wave ((v)).
YM_F Elliott Wave 1 Hour Chart 09.25.2025
Dow futures is currently doing wave ((iv)) black pull back. The correction appears incomplete at this stage. We anticipate further short-term weakness toward the Equal Legs area at 46271-45954 . In that zone, we expect buyers to emerge and initiate another rally toward new highs. Therefore, we recommend avoiding short positions within this area.
YM_F Elliott Wave 1 Hour Chart 10.02.2025
The price extended downward into the marked equal legs area, where YM_F found buyers as expected and has already shown a reaction. At this stage, we count the pullback as wave ((iv)), completed at the 46100 low. As long as price remains above that level, we are likely in wave ((v)), targeting the 47281-47646 zone. Alternatively, if the 46,100 low is broken before a new high is made, we’ll likely see a deeper pullback. In that case, we’ll measure a new equal-legs zone to identify the next buying area and update our members in the 24H chat room about it.