
Sample Category Title
AUD/USD Daily Report
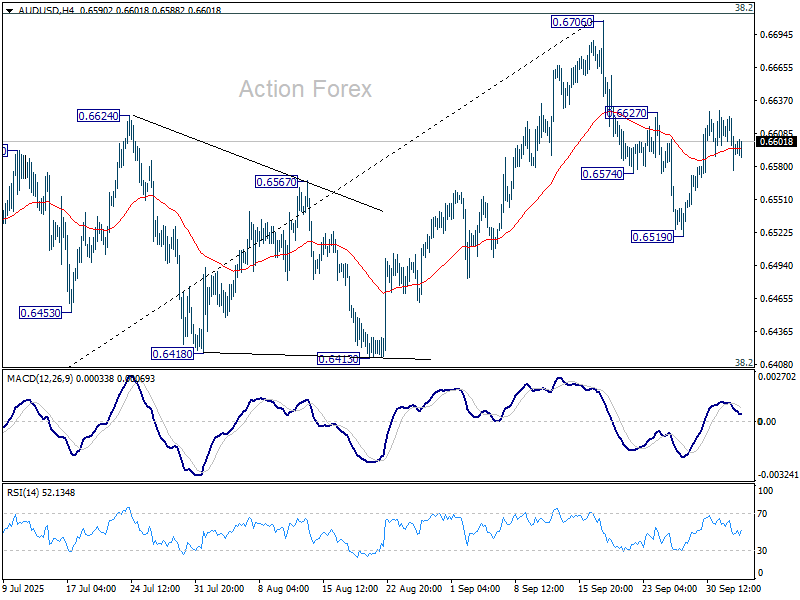
Daily Pivots: (S1) 0.6574; (P) 0.6599; (R1) 0.6622; More...
Intraday bias in AUD/USD remains neutral and outlook is unchanged. On the upside, firm break of 0.6627 resistance will suggest that pullback from 0.6706 has completed as correction, after drawing support from 55 D EMA (now at 0.6554). That will keep the larger rally from 0.5913 alive and bring retest of 0.6706 high. However, on the downside, sustained trading below 55 D EMA will confirm rejection by 0.6713 fibonacci resistance, and bring deeper fall to 0.6413 cluster support (38.2% retracement of 0.5913 to 0.6706 at 0.6403).
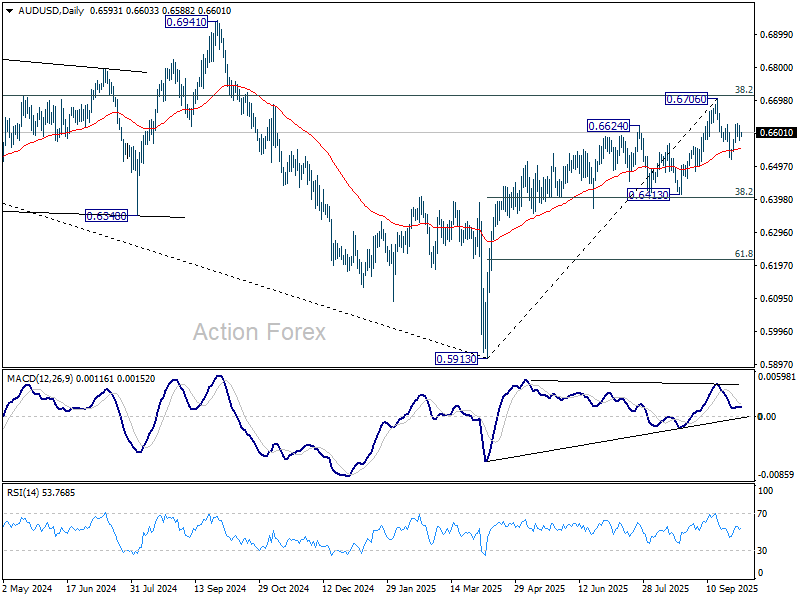
In the bigger picture, there is no clear sign that down trend from 0.8006 (2021 high) has completed. Rebound from 0.5913 is seen as a corrective move. Outlook will remain bearish as long as 38.2% retracement of 0.8006 to 0.5913 at 0.6713 holds. Nevertheless, considering bullish convergence condition in W MACD, sustained break of 0.6713 will be a strong sign of bullish trend reversal, and pave the way to 0.6941 structural resistance for confirmation.
EUR/USD Daily Outlook
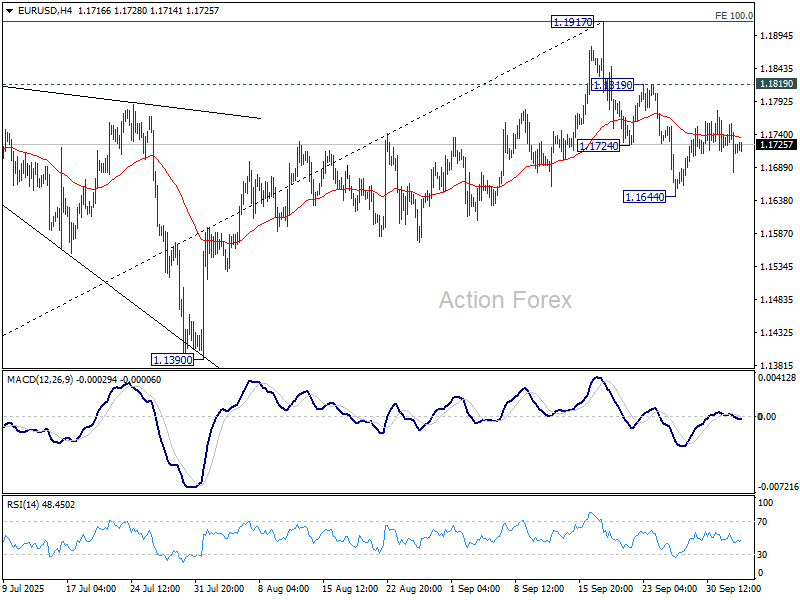
Daily Pivots: (S1) 1.1680; (P) 1.1720; (R1) 1.1756; More...
Intraday bias in EUR/USD remains neutral and outlook is unchanged. Considering bearish divergence condition in D MACD, sustained trading below 55 D EMA (now at 1.1675) will argue that 1.1917 was already a medium term top. Deeper fall should then be seen to 1.1390 support next. Nevertheless, break of 1.1819 will bring retest of 1.1917 high instead.
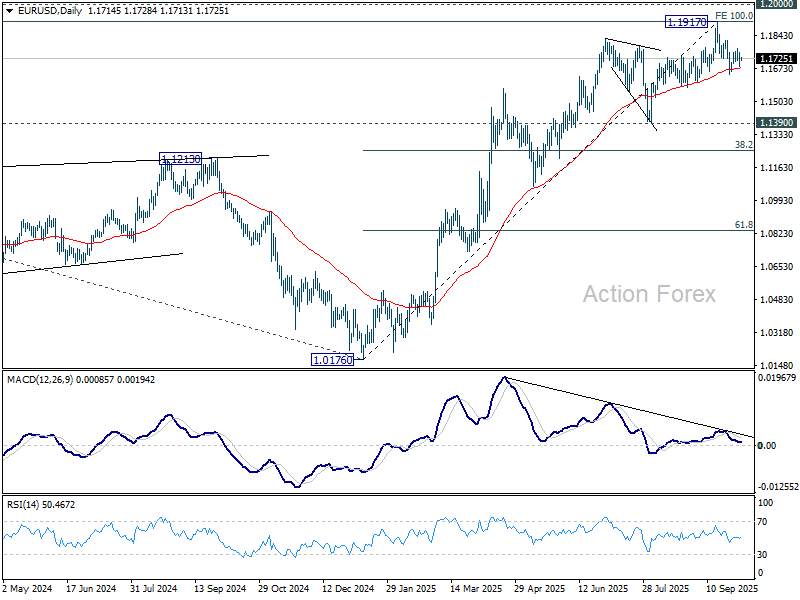
In the bigger picture, rise from 1.0176 (2025 low) is seen as the third leg of the pattern from 0.9534 (2022 low). 100% projection of 0.9534 to 1.1274 from 1.0176 at 1.1916 was already met. For now, further rally will remain in favor as long as 1.1390 support holds, and firm break of 1.2000 psychological level will carry larger bullish implications. However, firm break of 1.1390 will suggest that rise from 1.0176 has already completed and bring deeper fall to 55 W EMA (now at 1.1231).
GBP/USD Daily Outlook
Daily Pivots: (S1) 1.3391; (P) 1.3451; (R1) 1.3501; More...
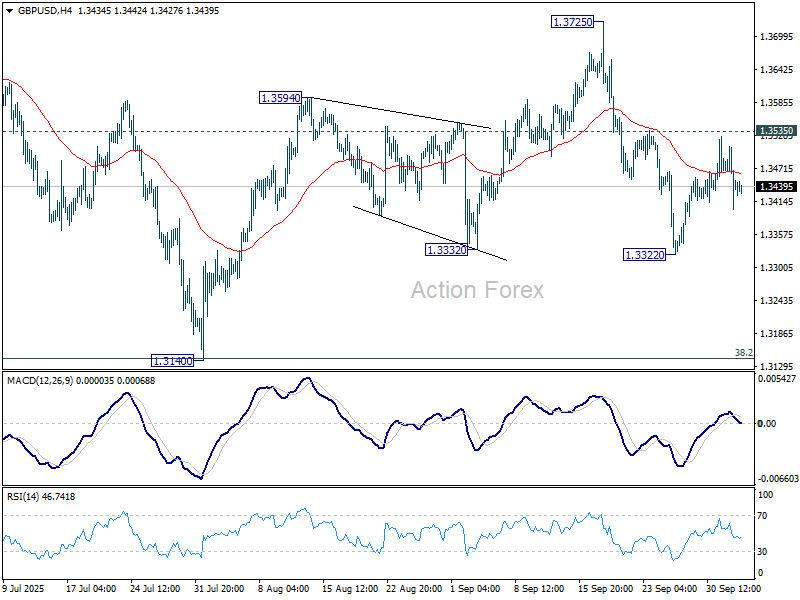
Intraday bias in GBP/USD remains neutral and outlook is unchanged. On the upside, firm break of 1.3535 resistance will suggest that pullback from 1.3725 has completed, and bring stronger rally to 1.3725/87 key resistance zone. On the downside, though, break of 1.3322 will resume the fall from 1.3725, as the third leg of the corrective pattern from 1.3787, and target 1.3140 support.
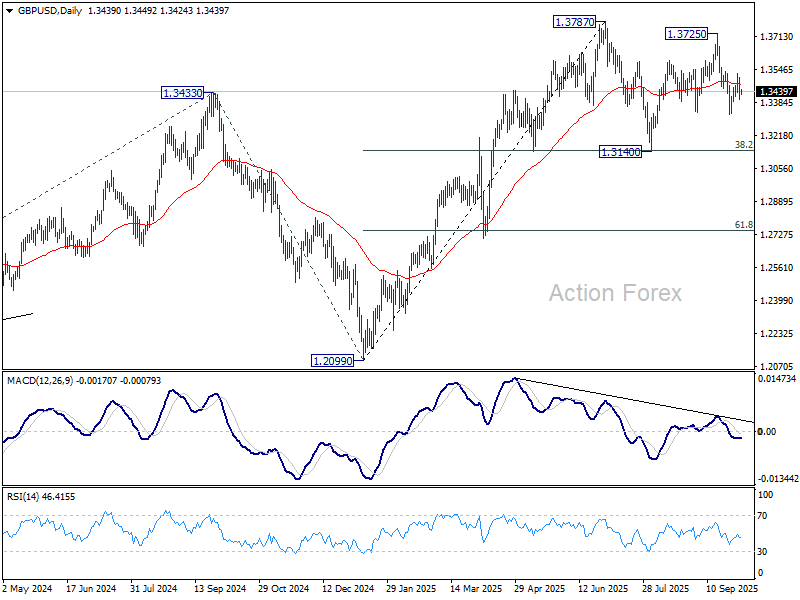
In the bigger picture, rise from 1.0351 (2022 low) is still seen as a corrective move. Further rally could be seen to 61.8% projection of 1.0351 to 1.3433 (2024 high) from 1.2099 (2025 low) at 1.4004. But strong resistance could be seen from 1.4248 (2021 high) to limit upside. Sustained break of 55 W EMA (now at 1.3155) will argue that a medium term top has already formed and bring deeper fall back to 1.2099.
USD/CHF Daily Outlook
Daily Pivots: (S1) 0.7953; (P) 0.7977; (R1) 0.8002; More…
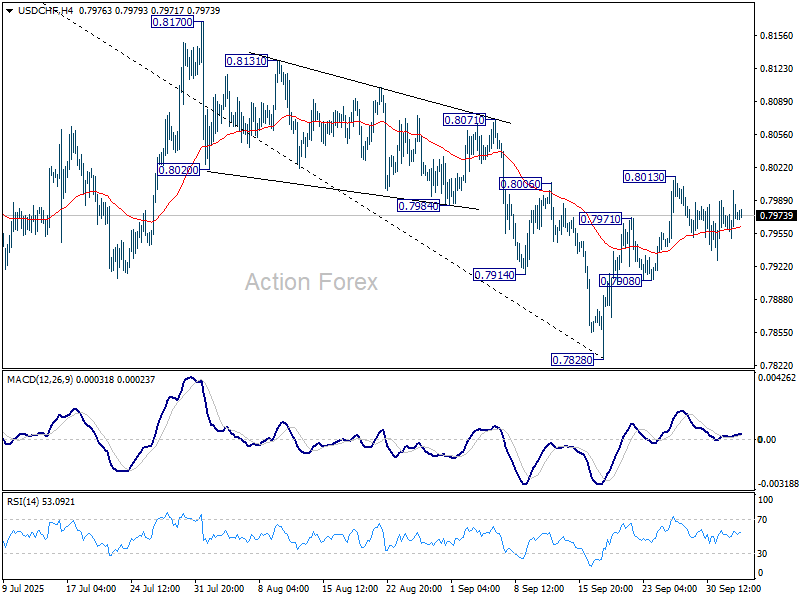
USD/CHF is still bounded in sideway trading and intraday bias stays neutral. On the upside, sustained trading above 55 D EMA (now at 0.8011) will suggest that rise from 0.7828 is already correcting whole fall from 0.9200. Further rise should the be seen to 0.8170 resistance and possibly above. However, break of 0.7908 will turn bias back to the downside for retesting 0.7828 low.
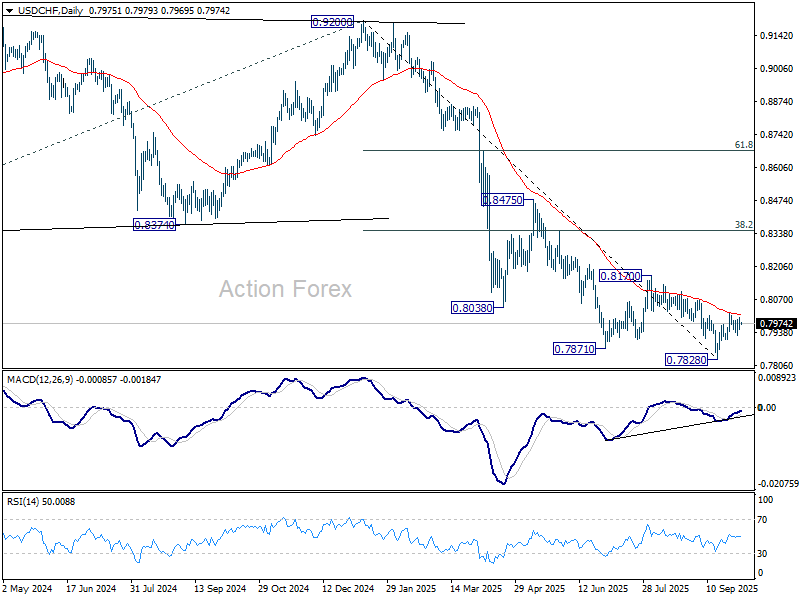
In the bigger picture, long term down trend from 1.0342 (2017 high) is still in progress. Next target is 100% projection of 1.0146 (2022 high) to 0.8332 from 0.9200 at 0.7382. In any case, outlook will stay bearish as long as 0.8332 support turned resistance holds (2023 low).
AI Doesn’t Care About Shutdowns
Yesterday was yet another day investors swung between political shenanigans in the US and AI hype. Mood was not necessarily great in the early hours of trading across the Pacific after Trump’s threat to fire thousands of federal employees if the government shutdown drags on. And the government shutdown doesn’t sound like it will end soon, as Democrats are pushing for the extension of Affordable Care Act subsidies that will expire in a few months, while Republicans don’t want to move ahead without securing funding. Bets on Polymarket suggest that this shutdown could last between 10 to 29 days – potentially becoming the second-longest in US government history – something you could barely guess by looking at the market’s performance.
Yes, the US 10-year yield flirted with the 4% mark on some safe-haven inflows and the US dollar remains offered into its 50-DMA, but the major US indices barely blinked! The S&P 500 and Nasdaq both hit fresh ATHs yesterday, boosted by OpenAI’s secondary share sale that pushed the company’s valuation to around $500bn. Employees were allowed to sell up to $10bn worth of shares, but they only sold $6.6bn – meaning a large chunk of shareholders preferred to hold rather than sell at current prices. That signals they expect the company to grow bigger – which is understandable.
As such, OpenAI has become one of the world’s most valuable startup (overtaking Elon Musk’s SpaceX). The company reportedly expects to make about $20bn in recurring revenue by the end of the year, giving it a valuation of ~25x sales. That’s high, but not shocking given its reach and potential, and lower than many tech startups trade at.
Since OpenAI isn’t listed, the news echoed across related sectors. Microsoft and Nvidia both have exposure to OpenAI – and Nvidia will also supply chips for its massive data center project. Appetite for Microsoft was soft yesterday, but Nvidia notched another record high – following rallies in SK Hynix and Samsung on similar news that OpenAI will use their chips in upcoming US data centers. Elsewhere, AMD jumped 3.5% on news of teaming up with Intel. As such, VanEck’s Semiconductor ETF hit a fresh high. Happy days.
Valuations are high, and some investors wonder whether this is another tech bubble. But a bubble – by definition – isn’t a bubble until it bursts. That leaves global investors with an unbearable FOMO – fear of missing out on a further rally – which keeps valuations elevated. Prospects of multiple Federal Reserve (Fed) rate cuts in the coming months also help support risk assets.
Now speaking of that, markets are pricing in two more Fed rate cuts before year-end, but the Fed needs data to confirm that the US economy requires these cuts. The data that will determine this is the jobs data – because that’s where weakness is most apparent as GDP grew 3.8% last quarter and the Fed’s preferred inflation gauge is still trending near 3% (above its 2% target). So it’s a bit of a shame that the BLS won’t release the September jobs report today because the government is shut down.
Instead, private data fills the gap. ADP reported job losses of 32k on Wednesday, keeping Fed doves in charge of the market. Meanwhile, Challenger job cuts fell 25% YoY, giving mixed signals about the labour market’s heath. Consequently, the weak ADP euphoria will soon fade, and official data should arrive sooner rather than later to tell investors whether the US really needs those two rate cuts.
In the meantime, ISM non-manufacturing data will be in focus before the weekly closing bell. It won’t replace the good, old jobs report, but a softer-than-expected set could give Fed doves a hand, keeping US yields and the dollar under pressure while supporting equities. A strong print could give some support to US yields and the dollar and weigh on equities – but the market’s tilt suggests bad news will likely move markets more than good news.
In FX: the US dollar may have spent the week under pressure, but EURUSD will likely end the week without having successfully cleared the 1.18 resistance, suggesting that the shutdown and dovish Fed bets are fully priced in, and a fresh catalyst will be needed for the pair to reach the 1.20 mark. The same is true for sterling: Cable is back below 1.35 and remains unappealing due to budget pressures. The UK 10-year gilt yield is not only near Liz Truss “mini-budget” crisis levels but is also diverging undesirably from the US 10-year yield. That’s a drag on sterling, as higher yields narrow fiscal headroom, raise the chance of further tax hikes or spending cuts, and lower UK growth expectations.
Elsewhere in commodities, gold consolidates near its ATH while US crude broke below the $62pb support, snapping a floor that had held since August, on expectations of more OPEC supply. Trend and momentum indicators remain comfortably negative, and the RSI is not yet flashing oversold conditions – meaning bears may be tempted to test the $60pb level. That should act as solid support.
Key Jobs Report Likely Delayed by US Shutdown
In focus today
- The US September Jobs Report scheduled for today will most likely not be released due to the government shutdown, which also affects the Bureau of Labor Statistics. The ISM Services Index for September will still be released.
- In Norway, we expect the September unemployment rate (s.a.) to remain at 2.1%, despite slowing employment growth and declining job vacancies signalling reduced labour demand. We will also look for new vacancies as a proxy for labour demand.
- In Sweden, we receive the services PMI, which has fluctuated throughout the year but recorded an increase in September. However, the employment subindex paints a concerning picture, aligning with the low number of new job openings in the services sector, as indicated by data from the Swedish Public Employment Service.
- In Japan, attention will be on the LDP-leadership election scheduled for Saturday. The ruling LDP currently operates as a fragile minority government, with little differentiation among the candidates so far. Key aspects to watch include their positions on fiscal stimulus and BoJ policies. If the new president calls for a snap parliament election, it could delay a potential BoJ rate hike in October. However, we consider it more likely that the LDP will avoid this scenario.
Economic and market news
What happened yesterday
In the euro area, the unemployment rate rose slightly to 6.3% in August from 6.2% in July, though the number of unemployed remained largely stable at 10.8 million, rising by just 10,000. France and Spain saw declines in unemployment, while Germany and Italy reported marginal increases. The unemployment rate has hovered around these levels over the past year, often subject to revisions, so we do not interpret this minor uptick as a sign of labour market weakness. While the euro area labour market is cooling with slower employment growth, we view this as a normalisation rather than an indication that additional stimulus is required to boost demand.
In the US, the Challenger report revealed 56,064 job cuts in September. Although not typically a closely monitored release it has drawn attention due to uncertainty surrounding the September jobs report. The data showed a continued decline in layoff announcements compared to August, which is good news. However, firms' hiring plans have fallen sharply, weakening the optimism.
Equities: Equities extended their gains on Thursday, with European and Nordic markets outperforming the US. Semiconductor stocks led the gains, supported by positive news flow on faster expanded chip capacity. As such, investor preference shifted from software to hardware, driving strong moves in names such as Atlas Copco and ASML, which rose 4-5% compared to a more modest 1% gain for Nvidia in yesterday's session. Historically, the semiconductor cycle has been closely linked to inventory cycle, making this development a positive signal for the broader industrial recovery story. Meanwhile, pharmaceuticals paused after recent strength, alongside other defensive sectors such as consumer staples and telecoms. Futures point to modestly higher equities again this morning.
FI and FX: US yields were little changed across the curve yesterday. Both the 2-year and 10-year Treasury yields have declined around 10bp so far this week, leaving a 25bp Fed cut later this month fully priced. Today's release of the September payrolls report is likely to be delayed due to the government shutdown. In the euro area, moves were similarly contained, with Bund yields edging 1-2bp lower across the curve. The unemployment rate rose to 6.3% in August from 6.2% in July, against expectations for no change. EUR/USD traded remarkably steady throughout yesterday's session while NOK, SEK and GBP reversed yesterday's gains.
USD/JPY Daily Outlook
Daily Pivots: (S1) 146.73; (P) 147.13; (R1) 147.65; More...
Intraday bias in USD/JPY is turned neutral first with current recovery. For now, price actions from 150.90 are still seen as a corrective pattern. On the upside, above 148.12 minor resistance will bring stronger rally to 149.95 first. Firm break there should resume larger rally from 139.87 through 150.90. On the downside, though, below 146.58 will bring deeper fall to 145.47 support. Decisive break of 145.47 will indicate near term reversal, and bring deeper fall to 142.66 support next.
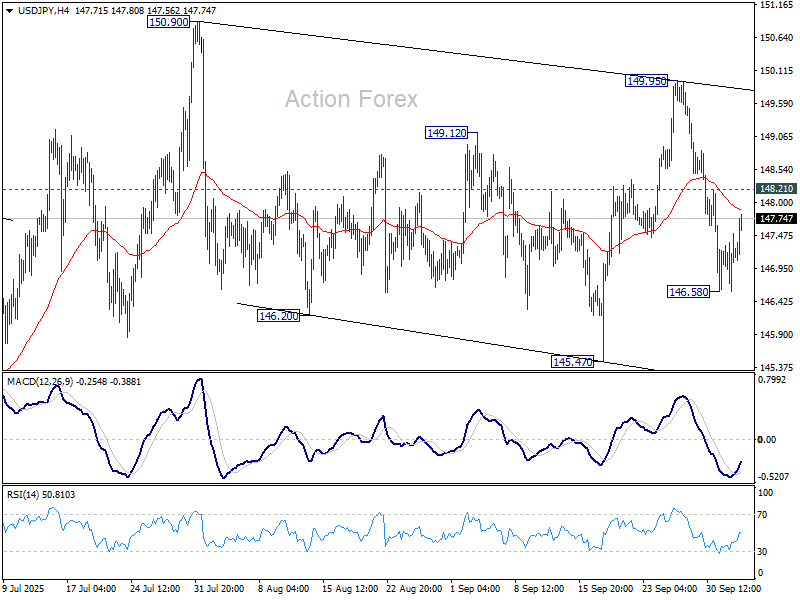
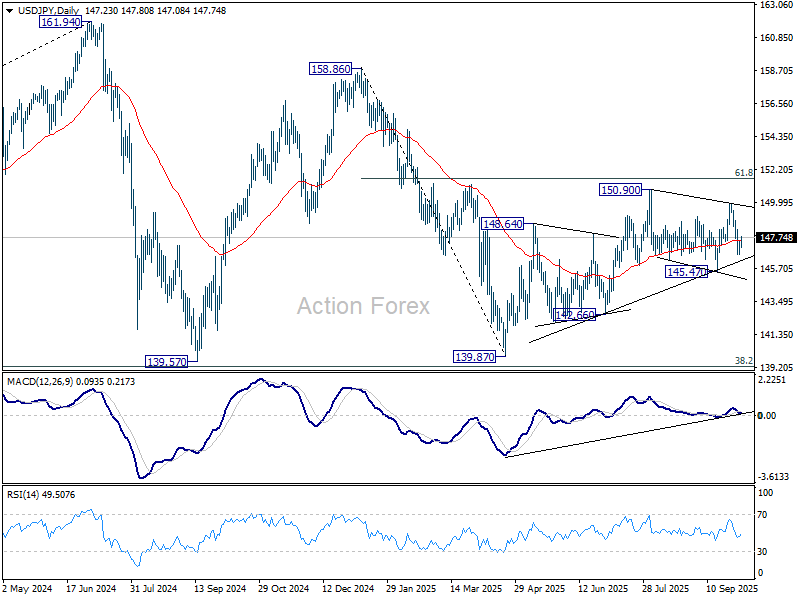
In the bigger picture, price actions from 161.94 (2024 high) are seen as a corrective pattern to rise from 102.58 (2021 low). Decisive break of 61.8% retracement of 158.86 to 139.87 at 151.22 will argue that it has already completed with three waves at 139.87. Larger up trend might then be ready to resume through 161.94 high. In case the corrective pattern extends with another fall, strong support is expected from 38.2% retracement of 102.58 to 161.94 at 139.26 to bring rebound.
Yen Pulls Back on Profit-Taking Ahead of LDP Vote, Dollar Steadies
Yen is paring back after a week of strong gains, as profit-taking sets in and domestic risk appetite strengthens. Japanese equities rallied sharply, driven by Hitachi’s announcement of a partnership with OpenAI to build AI data centers globally, bolstering optimism in the local market and easing demand for safe-haven flows.
BoJ Governor Kazuo Ueda added to the softer tone, giving no indication in his latest remarks that a rate hike is imminent. Combined with a surprise rise in Japan’s unemployment rate, this has cooled speculation that the central bank could act as soon as October.
Attention is also turning to politics, with the LDP’s presidential election on Saturday set to determine the ruling party’s next leader. Shinjiro Koizumi and Sanae Takaichi are seen as the main contenders, though polling has painted a mixed picture of support between the two, highlighting the uncertainty surrounding the outcome.
Kyodo News reported Takaichi ahead with 34.4% support versus Koizumi’s 29.3%, while a Yomiuri Shimbun survey showed Koizumi in the lead at 40% compared to Takaichi’s 25%. With the race finely balanced, traders have opted to scale back positions, awaiting clarity before driving the Yen further.
In the US, Dollar is modestly firmer, particularly against the Loonie, as equity markets continue to perform strongly despite the ongoing government shutdown. All three major indices — the Dow, S&P 500, and Nasdaq — touched new intraday record highs, reflecting investor confidence that shutdowns cause only temporary drags on growth.
Even so, weekly performance still shows the Yen leading the pack, followed by Kiwi and Aussie. At the weaker end, Loonie, Dollar, and Swiss Franc are lagging, while Sterling and Euro sit mid-table.
In Asia, at the time of writing, Nikkei is up 1.72%. Hong Kong HSI is down -0.80%. China is still on holiday. Singapore Strait Times is up 0.27%. Japan 10-year JGB yield yield is up 0.001 at 1.667. Overnight, DOW rose 0.17%. S&P 500 rose 0.06%. NASDAQ rose 0.39%. 10-year yield fell -0.018 to 4.088.
BoJ's Ueda reiterates further hikes if baseline holds, flags three uncertainties
BoJ Governor Kazuo Ueda said in a speech today that Japan’s real interest rates remain “significantly low,” and if the Bank’s baseline scenario holds, policy rates will continue to rise. He highlighted that rising labor shortages and firmer medium- to long-term inflation expectations should eventually push underlying CPI toward 2% in the second half of the Bank’s forecast horizon.
Ueda acknowledged, however, that uncertainties remain significant. Chief among them are US economic developments, tariff impact on Japan, and food price inflation.
He warned that tariffs could hurt US firms’ profits and in turn slow employment and income growth — risks that may already be showing in weaker US job data. If firms pass on costs instead, higher consumer prices could sap private demand.
At home, the Tankan survey suggested resilience in services, where the tariff impact is limited, but profit projections for export-heavy industries such as autos showed steep declines.
Food prices are another area of concern. While much of the recent rise has been driven by temporary factors, Ueda cautioned that wage and distribution cost pass-through is increasingly evident. That raises the possibility of more persistent inflation in food.
Japan unemployment rate rises to 2.6%, highest in over a year
Japan’s unemployment rate rose more than expected in August, climbing to 2.6% from 2.3% a month earlier. That marked the highest reading since July 2024 and exceeded expectations of 2.4%.
Number of unemployed increased by 150k to 1.79 million, a 13-month high, while employment fell by -210k to 68.10 million. The labor force edged down by -40k to 69.89 million, though the participation rate improved to 64.0% from 63.9%. Still, the data underscored growing strain in the labor market as job creation weakens and unemployment rises.
Complementary data from the labor ministry showed the job-to-applicant ratio slipping to 1.20 from 1.22, its lowest since January 2022. The decline points to waning demand for labor.
USD/JPY Daily Outlook
Daily Pivots: (S1) 146.73; (P) 147.13; (R1) 147.65; More...
Intraday bias in USD/JPY is turned neutral first with current recovery. For now, price actions from 150.90 are still seen as a corrective pattern. On the upside, above 148.12 minor resistance will bring stronger rally to 149.95 first. Firm break there should resume larger rally from 139.87 through 150.90. On the downside, though, below 146.58 will bring deeper fall to 145.47 support. Decisive break of 145.47 will indicate near term reversal, and bring deeper fall to 142.66 support next.
In the bigger picture, price actions from 161.94 (2024 high) are seen as a corrective pattern to rise from 102.58 (2021 low). Decisive break of 61.8% retracement of 158.86 to 139.87 at 151.22 will argue that it has already completed with three waves at 139.87. Larger up trend might then be ready to resume through 161.94 high. In case the corrective pattern extends with another fall, strong support is expected from 38.2% retracement of 102.58 to 161.94 at 139.26 to bring rebound.
USD/JPY Attempts Comeback – Traders Wonder If Strength Can Really Hold?
Key Highlights
- USD/JPY declined and tested the 146.60 support zone
- It cleared a key bearish trend line with resistance near 147.20 on the 4-hour chart.
- EUR/USD is showing a few bearish signs and might decline again to 1.1620.
- Bitcoin extended gains and rallied above $118,000.
USD/JPY Technical Analysis
The US Dollar declined heavily below 148.00 against the Japanese Yen before the bulls appeared. USD/JPY tested 146.60 and recently corrected some losses.
Looking at the 4-hour chart, the pair cleared a key bearish trend line with resistance near 147.20. The pair even spiked above the 23.6% Fib retracement level of the downward move from the 149.95 swing high to the 146.58 low.
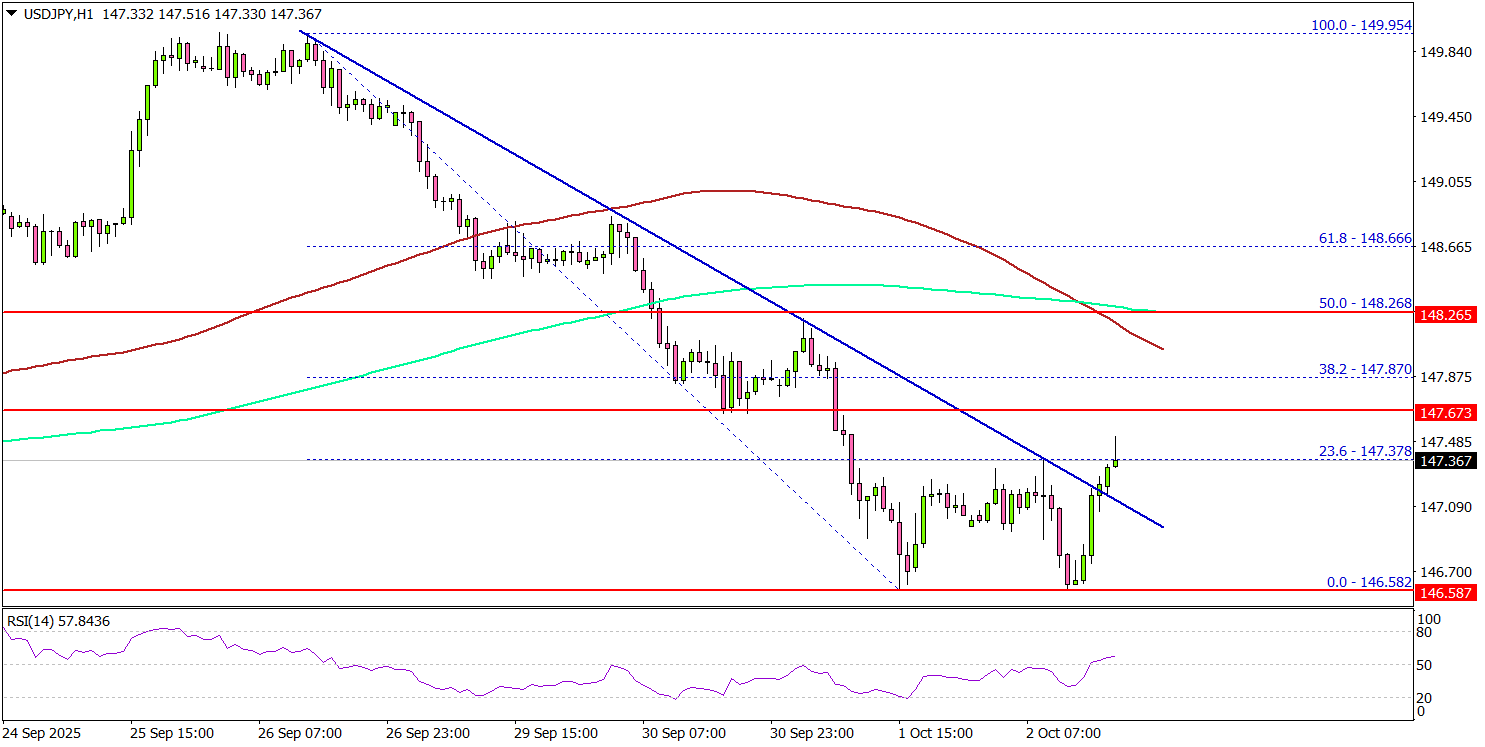
Immediate resistance could be 147.65. A clear move above 147.65 could send the pair toward the 148.00 resistance and the 100 simple moving average (red, 4-hour).
The main hurdle could be near the 200 simple moving average (green, 4-hour) and the 50% Fib retracement level of the downward move from the 149.95 swing high to the 146.58 low at 148.25.
A close above 148.25 could open the doors for a fresh increase. If not, USD/JPY could decline again. On the downside, there is key support at 146.80.
The next area of interest might be 146.60. The main support could be 146.20. Any more losses might increase selling pressure and send the pair toward 141.50.
Looking at EUR/USD, the pair attempted to recover, but the bears are still active below the 1.1780 resistance level.
Upcoming Key Economic Events:
- US ISM Services Index for Sep 2025 – Forecast 51.7, versus 52 previous.
- US nonfarm payrolls for Sep 2025 – Forecast 50K, versus 22K previous.
- US Unemployment Rate for Sep 2025 - Forecast 4.3%, versus 4.3% previous.
BoJ’s Ueda reiterates further hikes if baseline holds, flags three uncertainties
BoJ Governor Kazuo Ueda said in a speech today that Japan’s real interest rates remain “significantly low,” and if the Bank’s baseline scenario holds, policy rates will continue to rise. He highlighted that rising labor shortages and firmer medium- to long-term inflation expectations should eventually push underlying CPI toward 2% in the second half of the Bank’s forecast horizon.
Ueda acknowledged, however, that uncertainties remain significant. Chief among them are US economic developments, tariff impact on Japan, and food price inflation.
He warned that tariffs could hurt US firms’ profits and in turn slow employment and income growth — risks that may already be showing in weaker US job data. If firms pass on costs instead, higher consumer prices could sap private demand.
At home, the Tankan survey suggested resilience in services, where the tariff impact is limited, but profit projections for export-heavy industries such as autos showed steep declines.
Food prices are another area of concern. While much of the recent rise has been driven by temporary factors, Ueda cautioned that wage and distribution cost pass-through is increasingly evident. That raises the possibility of more persistent inflation in food.