
Sample Category Title
Dow Futures (YM_F) Elliott Wave Calling the Rally After 3 Waves Pull Back
Hello fellow traders. In this technical article, we are going to present Elliott Wave charts of Dow Futures (YM_F) . As our members know, YM_F has been showing impulsive bullish sequences in the cycle from the August 43456 low, pointing to further strength ahead. We have been calling for a rally in Dow Futures. Recently we got an intraday pullback labeled wave ((iv)), which landed right in the equal‑legs zone. In the following section, we’ll explain our Elliott Wave count and present the target area for wave ((v)).
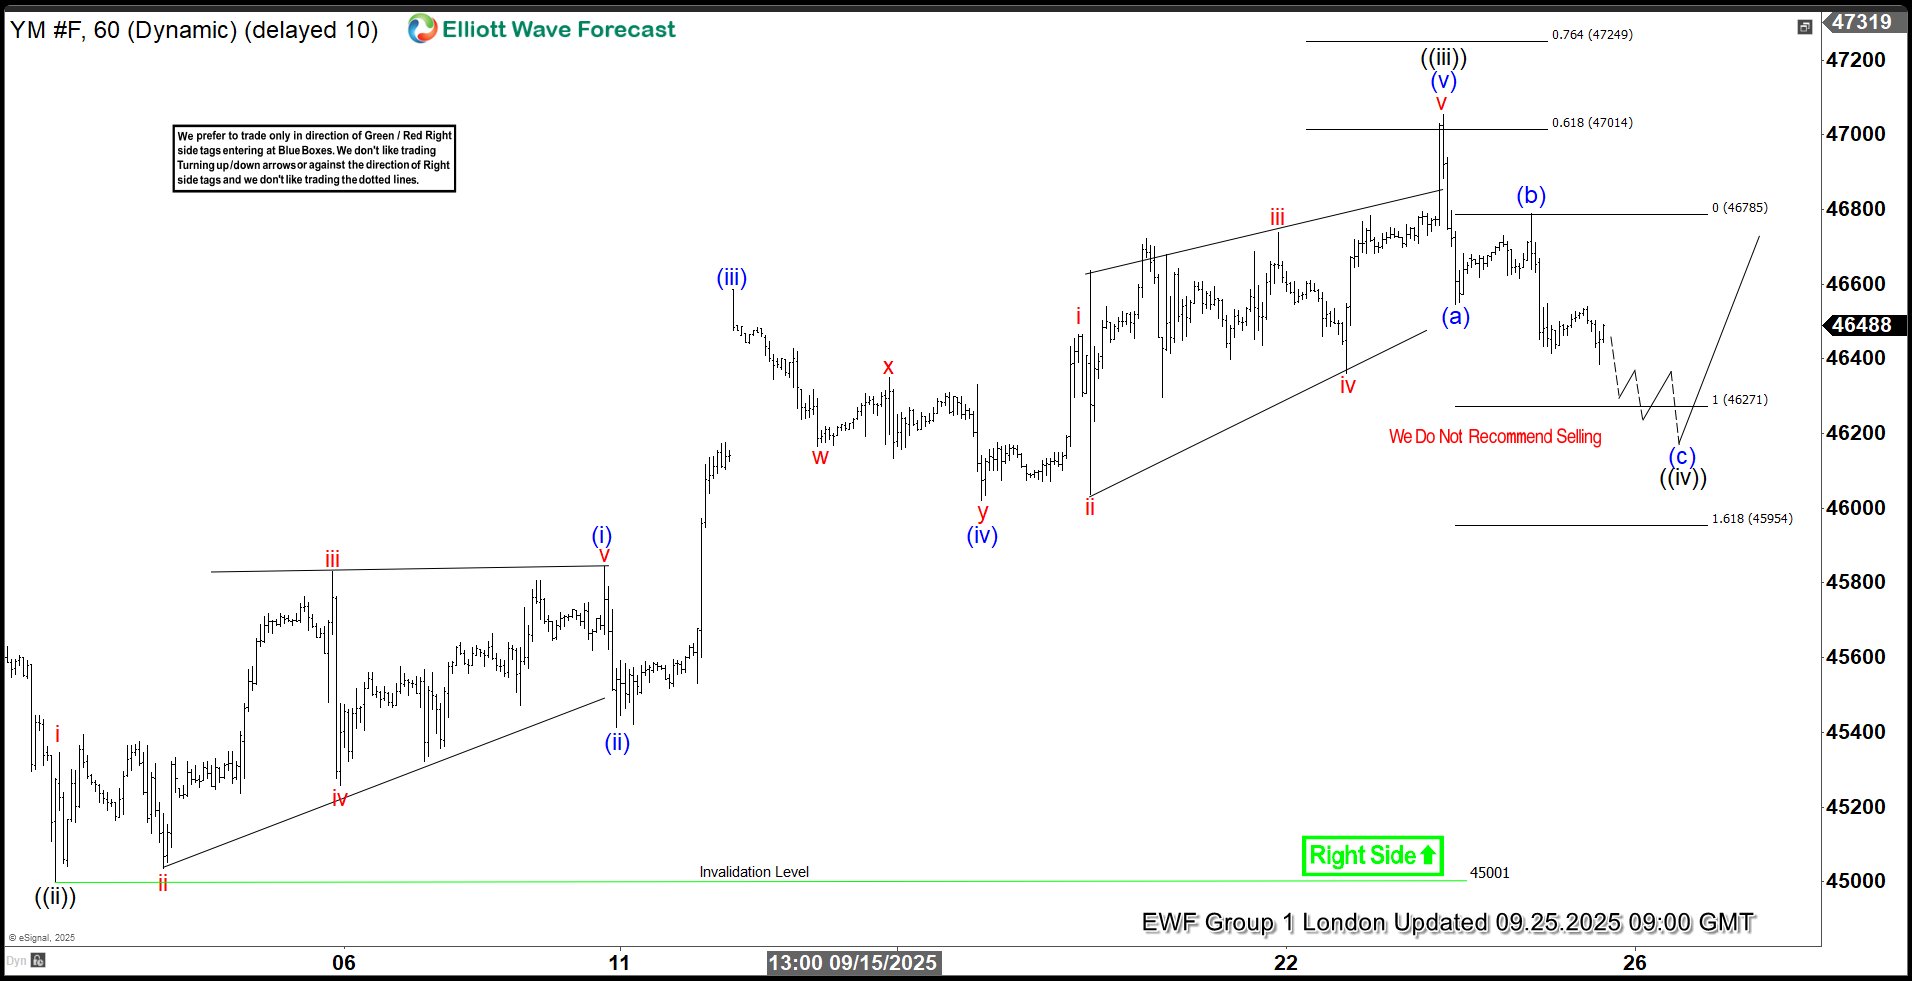
YM_F Elliott Wave 1 Hour Chart 09.25.2025
Dow futures is currently doing wave ((iv)) black pull back. The correction appears incomplete at this stage. We anticipate further short-term weakness toward the Equal Legs area at 46271-45954 . In that zone, we expect buyers to emerge and initiate another rally toward new highs. Therefore, we recommend avoiding short positions within this area.
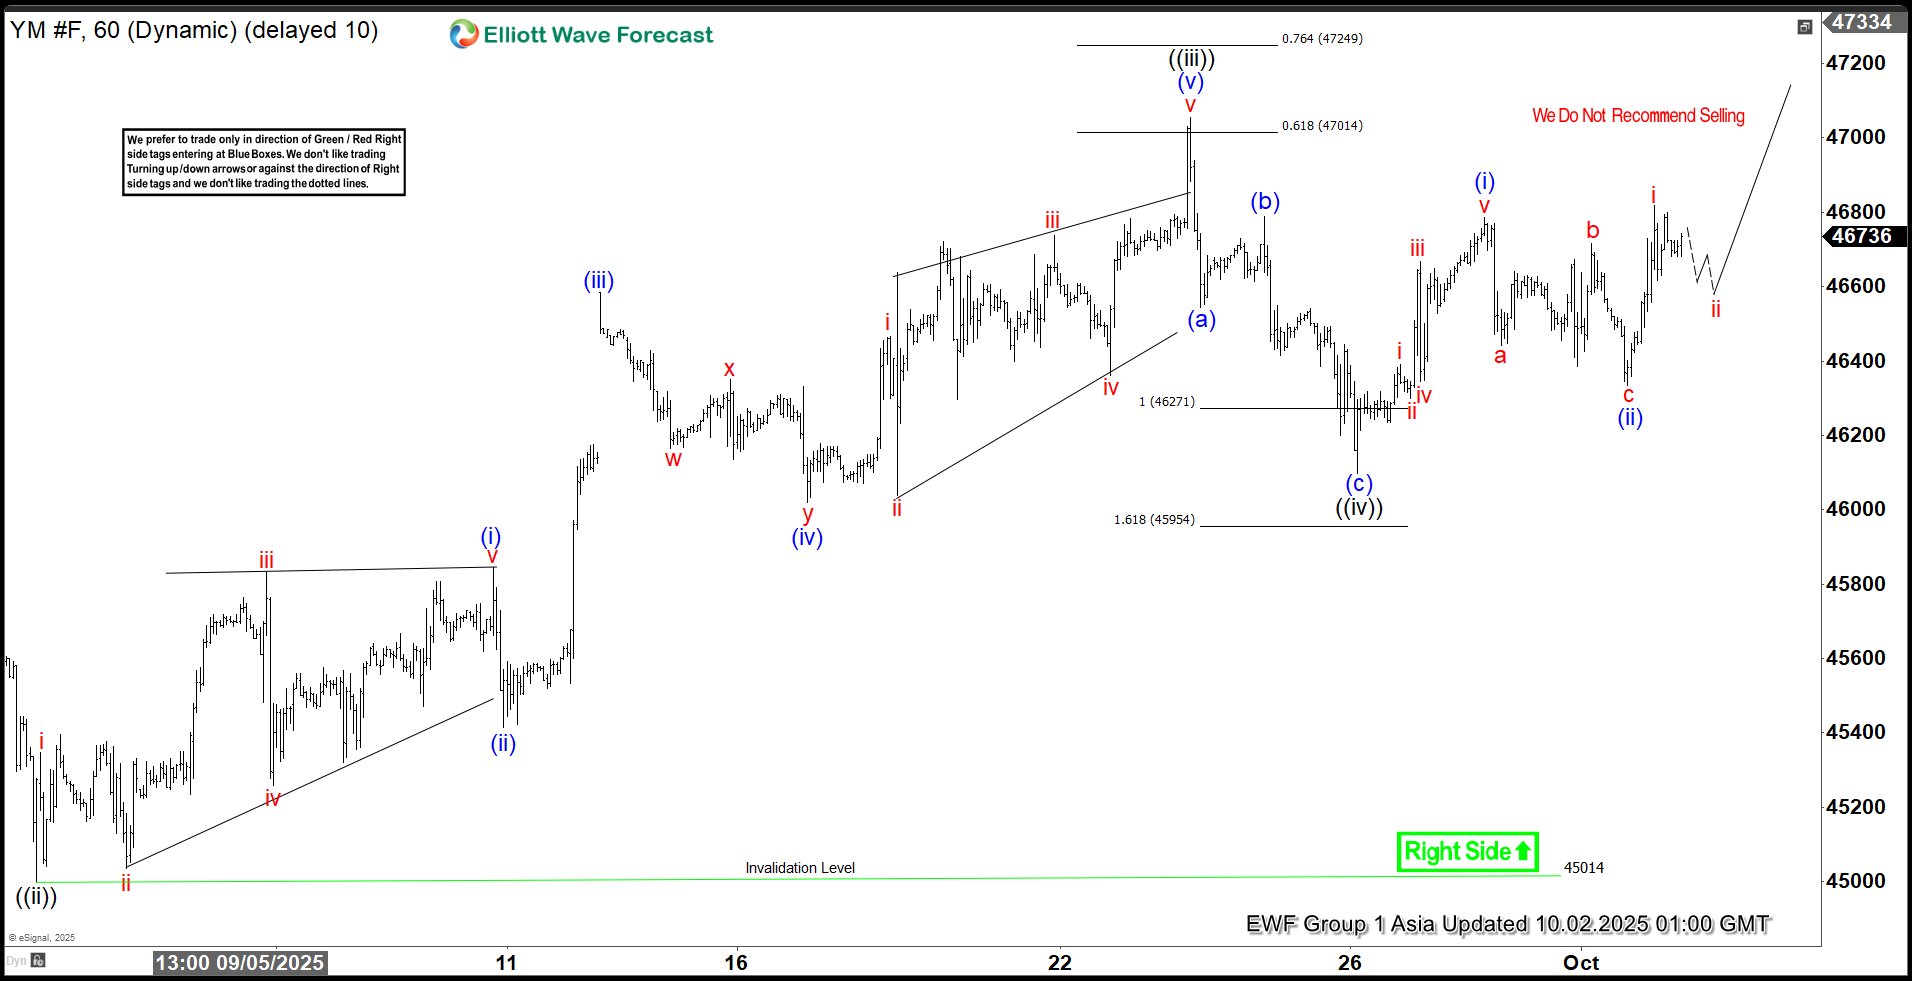
YM_F Elliott Wave 1 Hour Chart 10.02.2025
The price extended downward into the marked equal legs area, where YM_F found buyers as expected and has already shown a reaction. At this stage, we count the pullback as wave ((iv)), completed at the 46100 low. As long as price remains above that level, we are likely in wave ((v)), targeting the 47281-47646 zone. Alternatively, if the 46,100 low is broken before a new high is made, we’ll likely see a deeper pullback. In that case, we’ll measure a new equal-legs zone to identify the next buying area and update our members in the 24H chat room about it.
Cryptocurrency Market Soared to Extremes
Market Picture
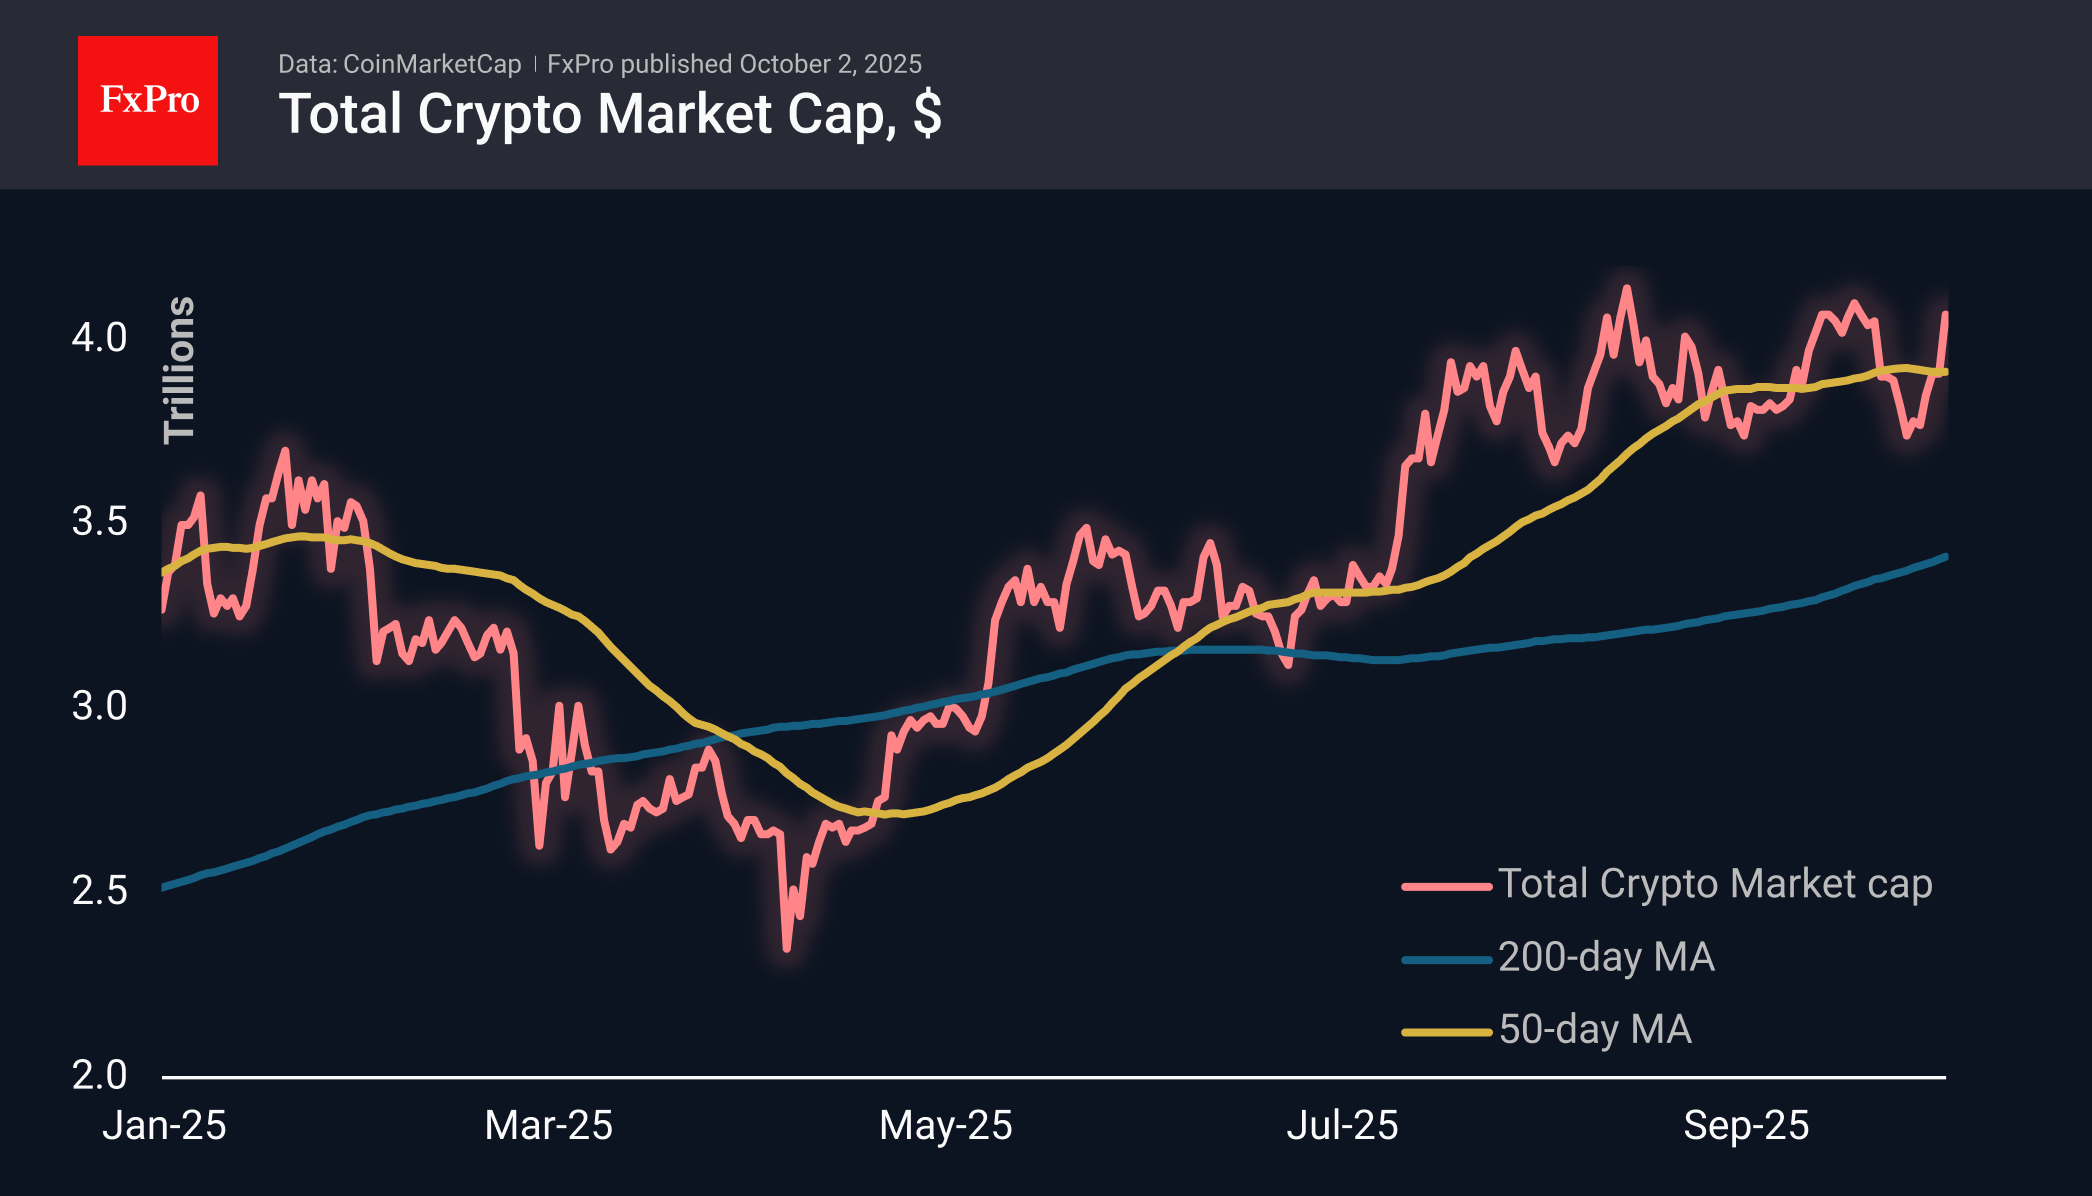
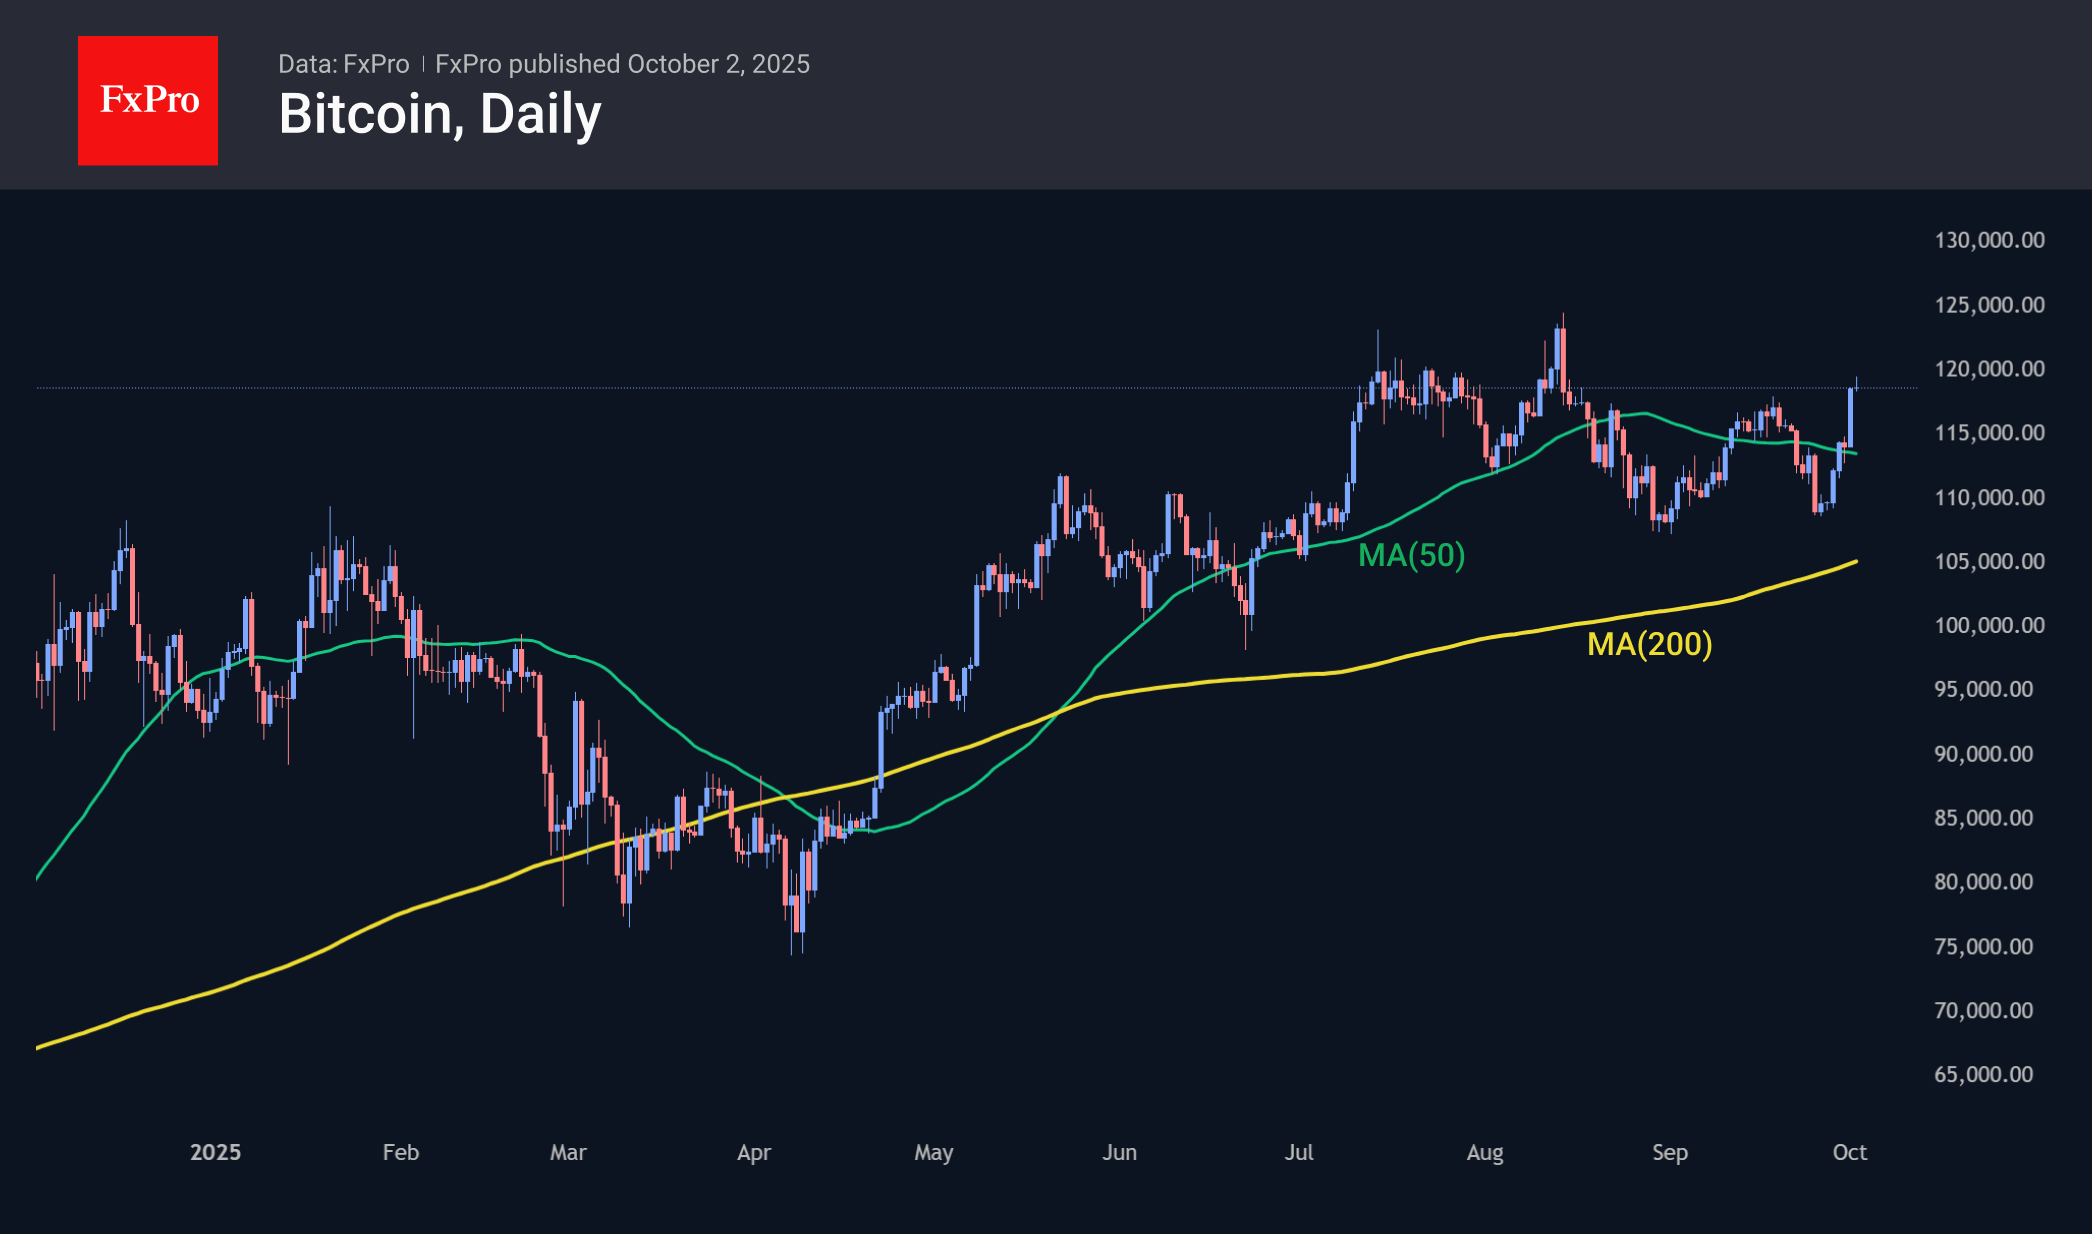
The cryptocurrency market capitalisation soared by 4% over the past day to $4.07 trillion. The capitalisation has soared into the extreme zone, above which it was only briefly in mid-August and mid-September. Cryptocurrency investors are convinced that the US government shutdown is not dampening risk appetite, and macroeconomic data is pushing the Fed to ease its policy further.
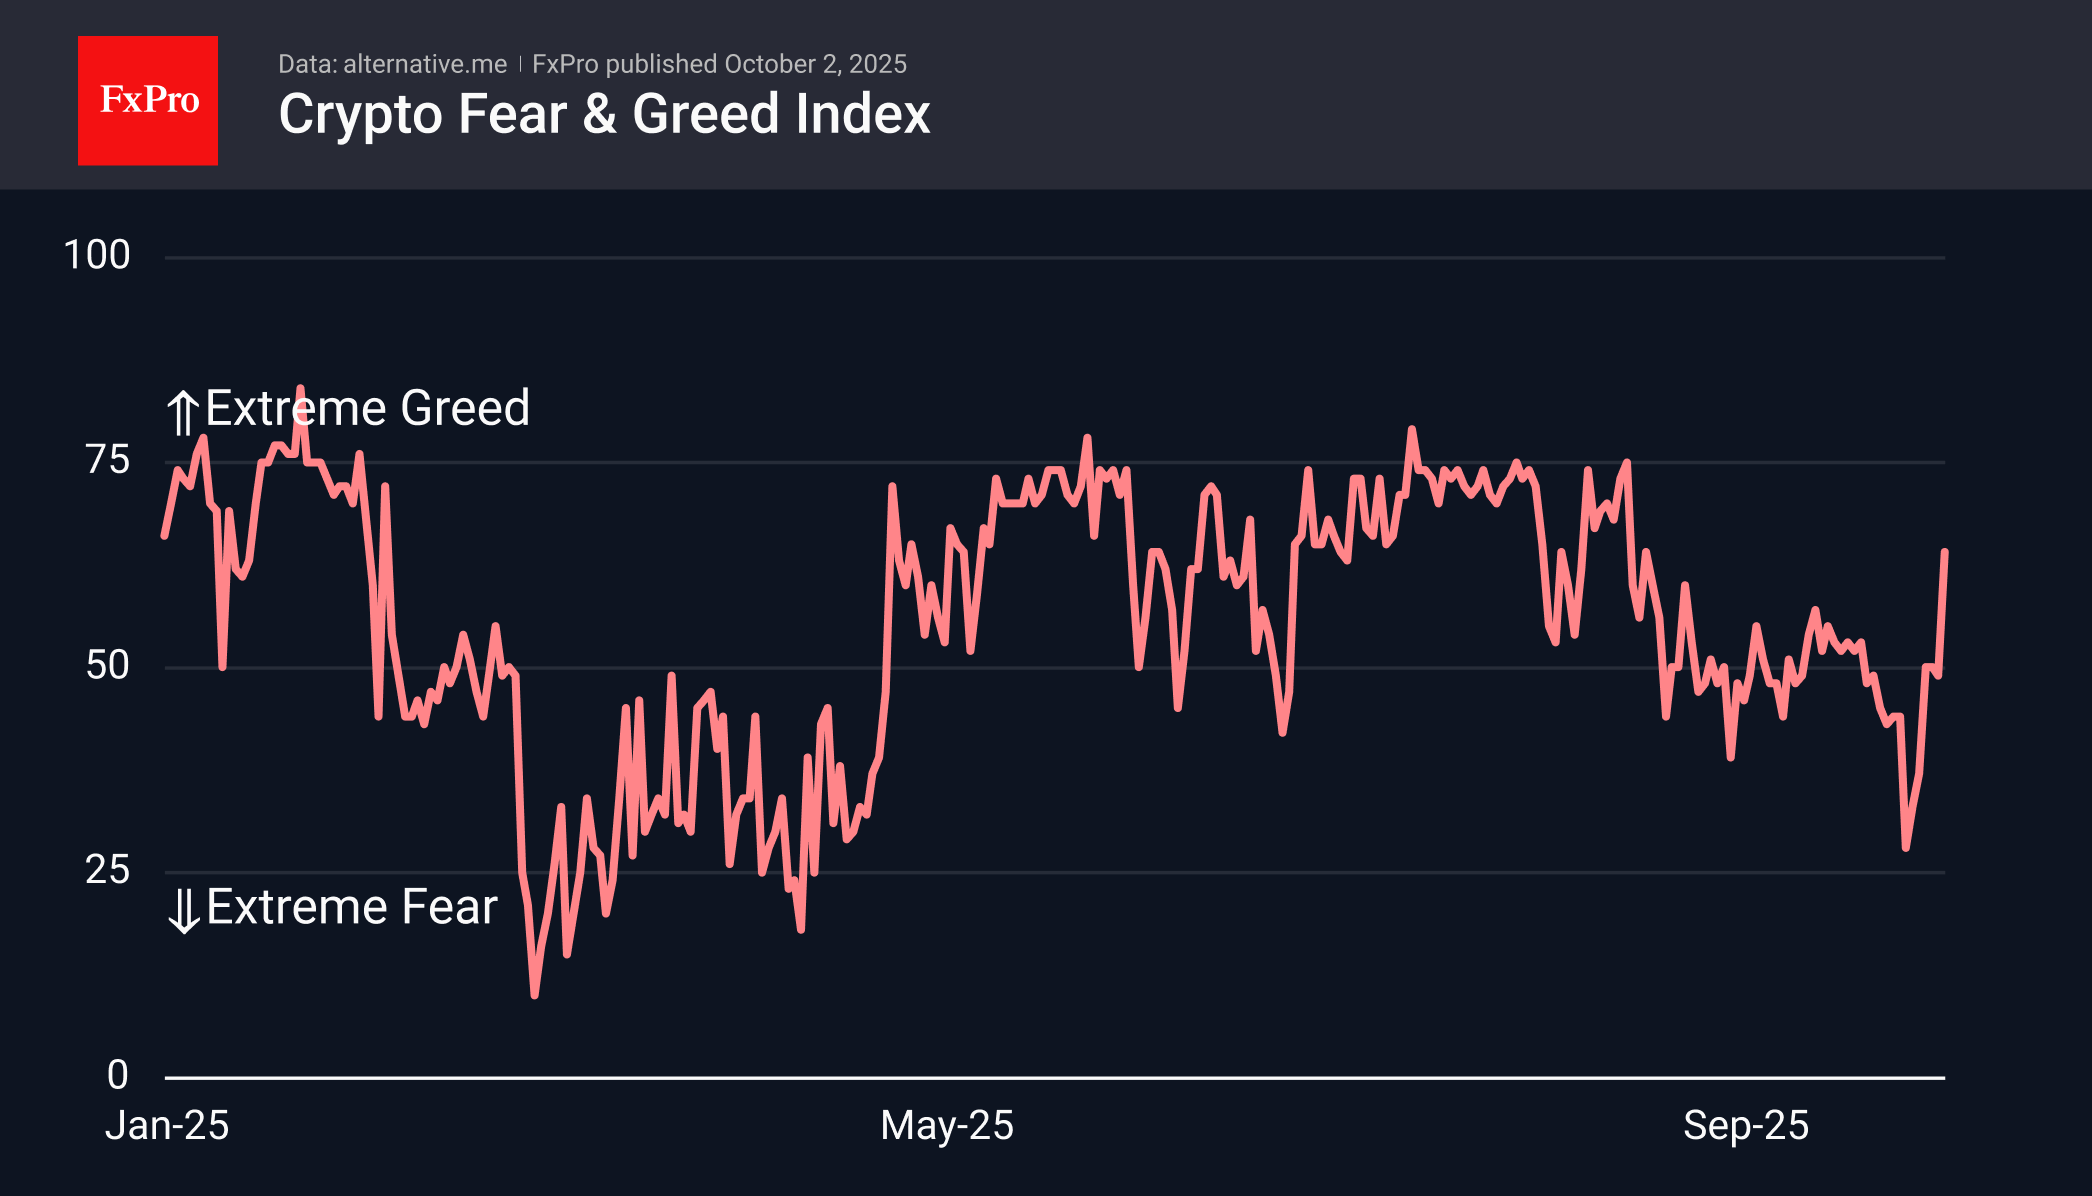
The sentiment index rose to 64 (greed), reaching its highest level in the last six weeks. However, the index is far from extreme greed, leaving significant potential for further strengthening.
On Thursday morning, Bitcoin exceeded $118K, surpassing the previous highs, which indicates an important technical breakthrough of the established range. The next step could well be an attempt to update historical highs approaching $125K. At the same time, it is worth paying attention to the activity of long-term sellers, who have been actively selling near these levels since July: we may see a new episode of selling on the rise.
News Background
The total supply of stablecoins grew by a record $45 billion in the third quarter, according to CEX.io. At the same time, 69% of the ‘printed’ volume was issued on the main Ethereum network.
According to CryptoQuant, the growth in the supply of stablecoins creates a powerful foundation for a bull market. Historically, Bitcoin has rallied not only in October but throughout the last quarter of the year.
The main factors that could trigger a crypto market rally in the fourth quarter could be changes in digital asset regulation in the US and expanded access to the crypto market through products on stock exchanges, according to Grayscale.
The total Bitcoin reserves of Japanese company Metaplanet reached 30,823 coins, placing it in fourth place among all corporate BTC holders.
According to Onchain Lens, Tether, the issuer of USDT, has replenished its Bitcoin reserve with 8,889 BTC worth $1 billion. Since May 2023, the company has been allocating 15% of its net profit to the purchase of BTC as part of its long-term asset diversification strategy.
Stani Kulechov, founder of leading lending platform Aave, said lower interest rates by global central banks will create favourable conditions for yield growth in the DeFi sector and may drive renewed interest in decentralised finance.
USD/JPY on Hold, But Yen Rally Could Resume at Any Moment
The USD/JPY pair has paused its recent decline, stabilising around 147.16 on Thursday.
The yen continues to find support from its status as a safe-haven asset, with demand bolstered by a weaker US dollar amid the ongoing US government shutdown. The political impasse in Washington, which could last for at least several days, has delayed the release of critical macroeconomic data, including the key September non-farm payrolls (NFP) report.
Domestically, the yen is gaining momentum from growing market expectations that the Bank of Japan (BoJ) could resume policy normalisation this year. Markets are currently pricing in a 40% probability of a 0.25 percentage point rate hike as early as the October meeting.
Supporting this hawkish tilt, the latest Tankan survey showed large manufacturers' sentiment improved in the third quarter, reaching its highest level since late 2022. However, the economic outlook remains clouded by persistent pressure from US tariff measures.
Market participants are now turning their attention to the upcoming consumer confidence index, which may offer fresh clues on the economy's trajectory.
Technical Analysis: USD/JPY
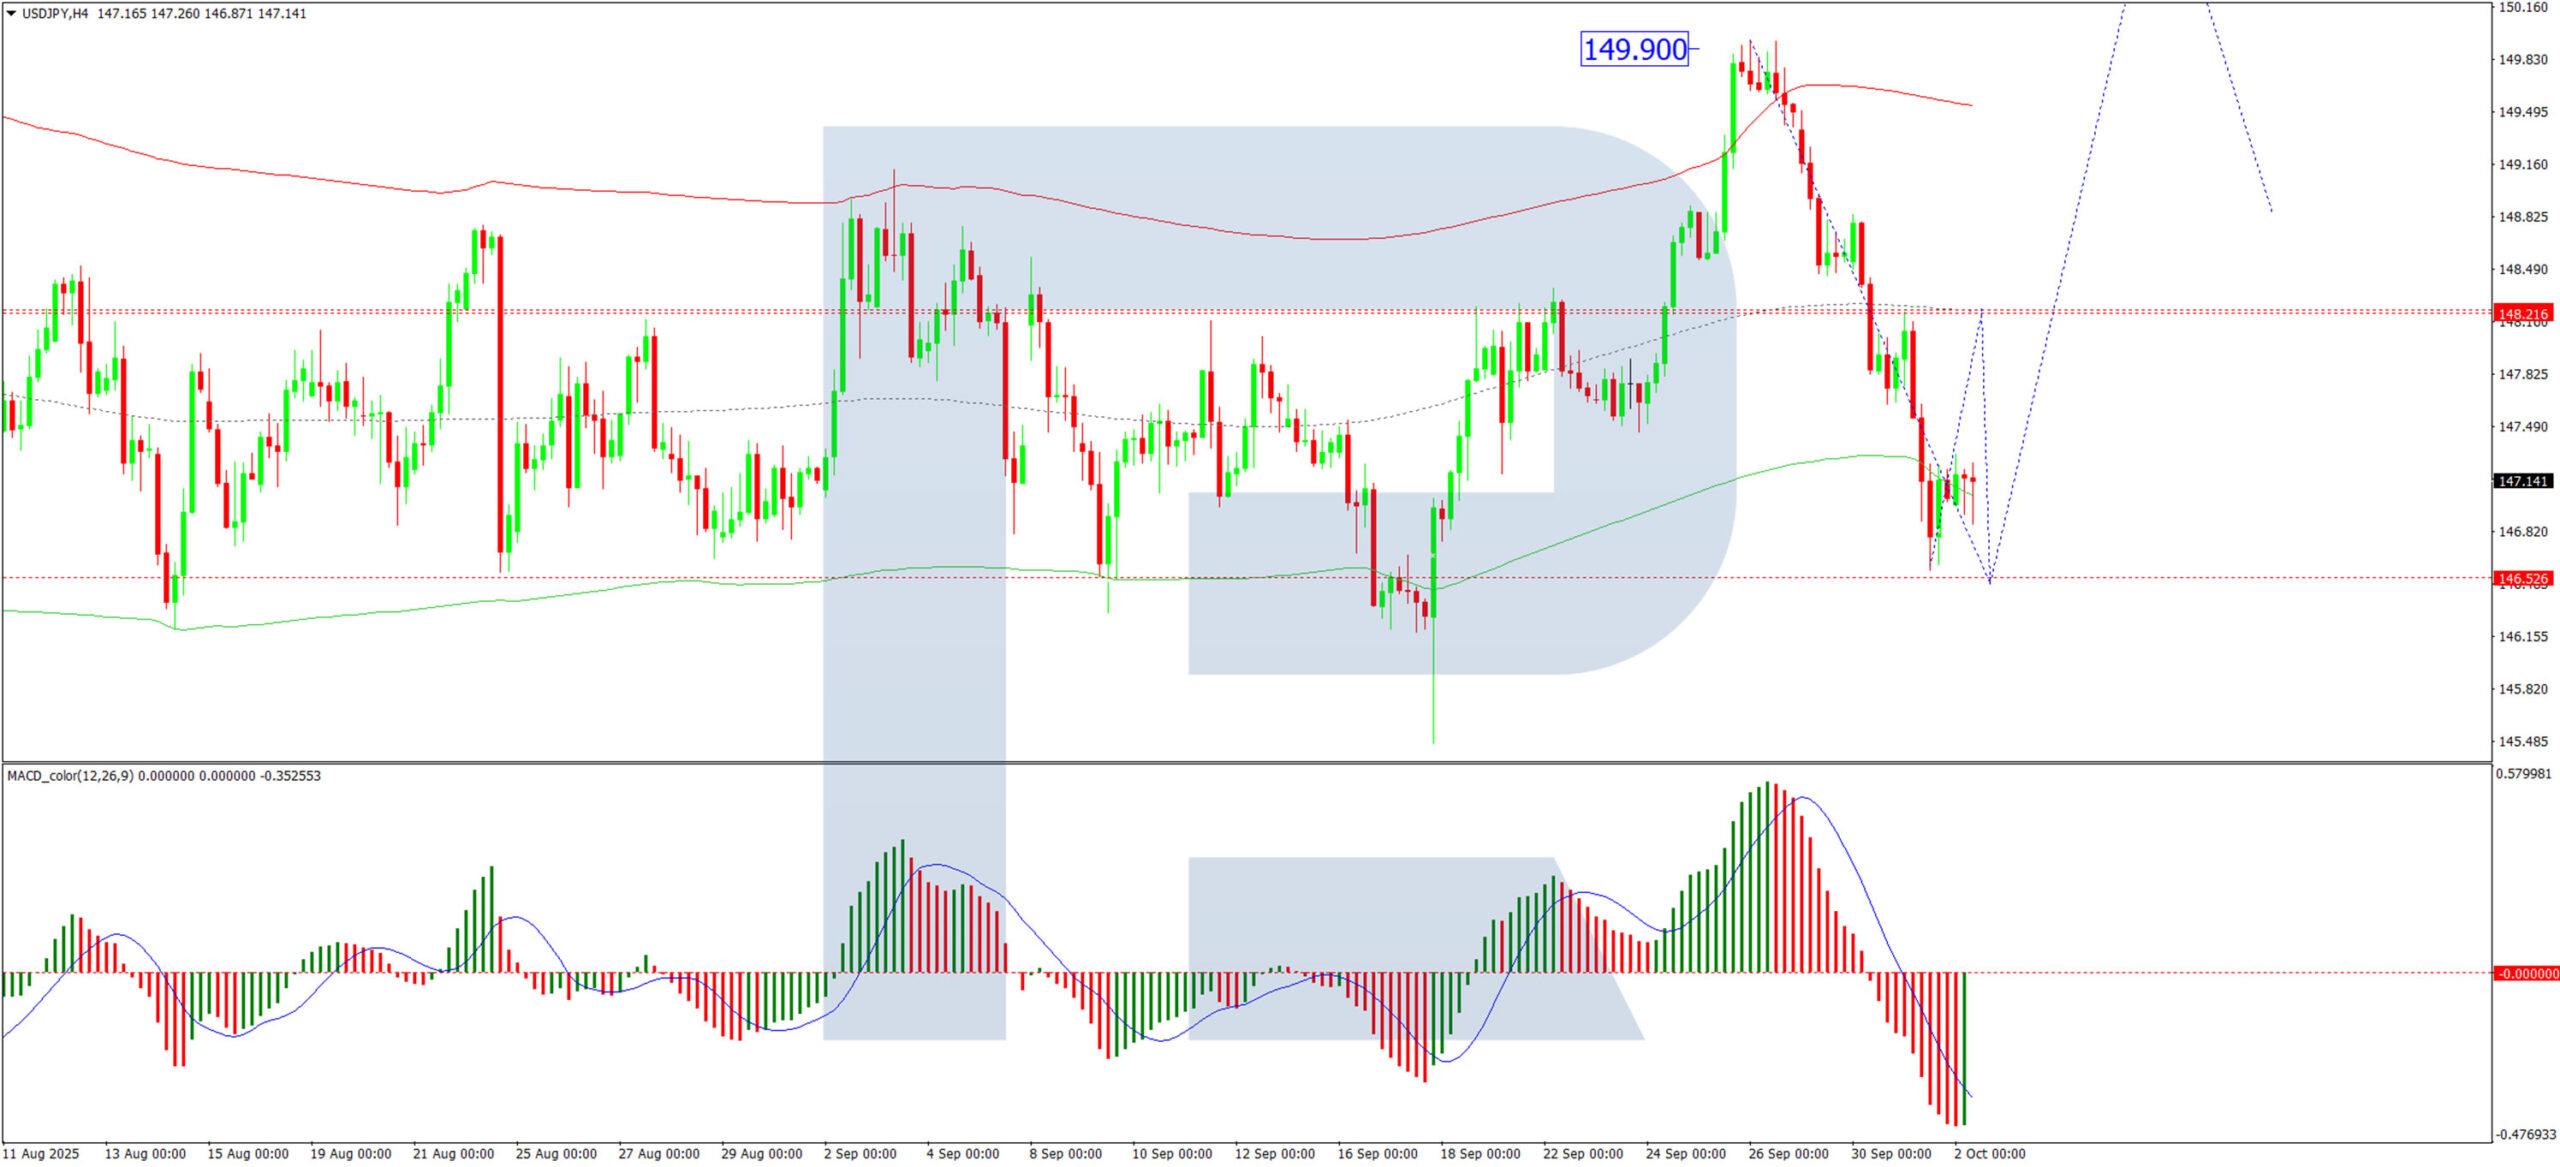
H4 Chart:
On the H4 chart, USD/JPY completed a correction to 146.62 and is now forming a narrow consolidation range above this level. A downside breakout would likely lead to an extension of the decline towards 146.50. Conversely, an upside breakout would open the potential for a growth wave towards 148.22, to be followed by a decline back to 146.50. Once this corrective phase is complete, the stage would be set for a new upward wave targeting 151.15. This scenario is technically supported by the MACD indicator, whose signal line is at lows below zero but appears poised to reverse upwards.
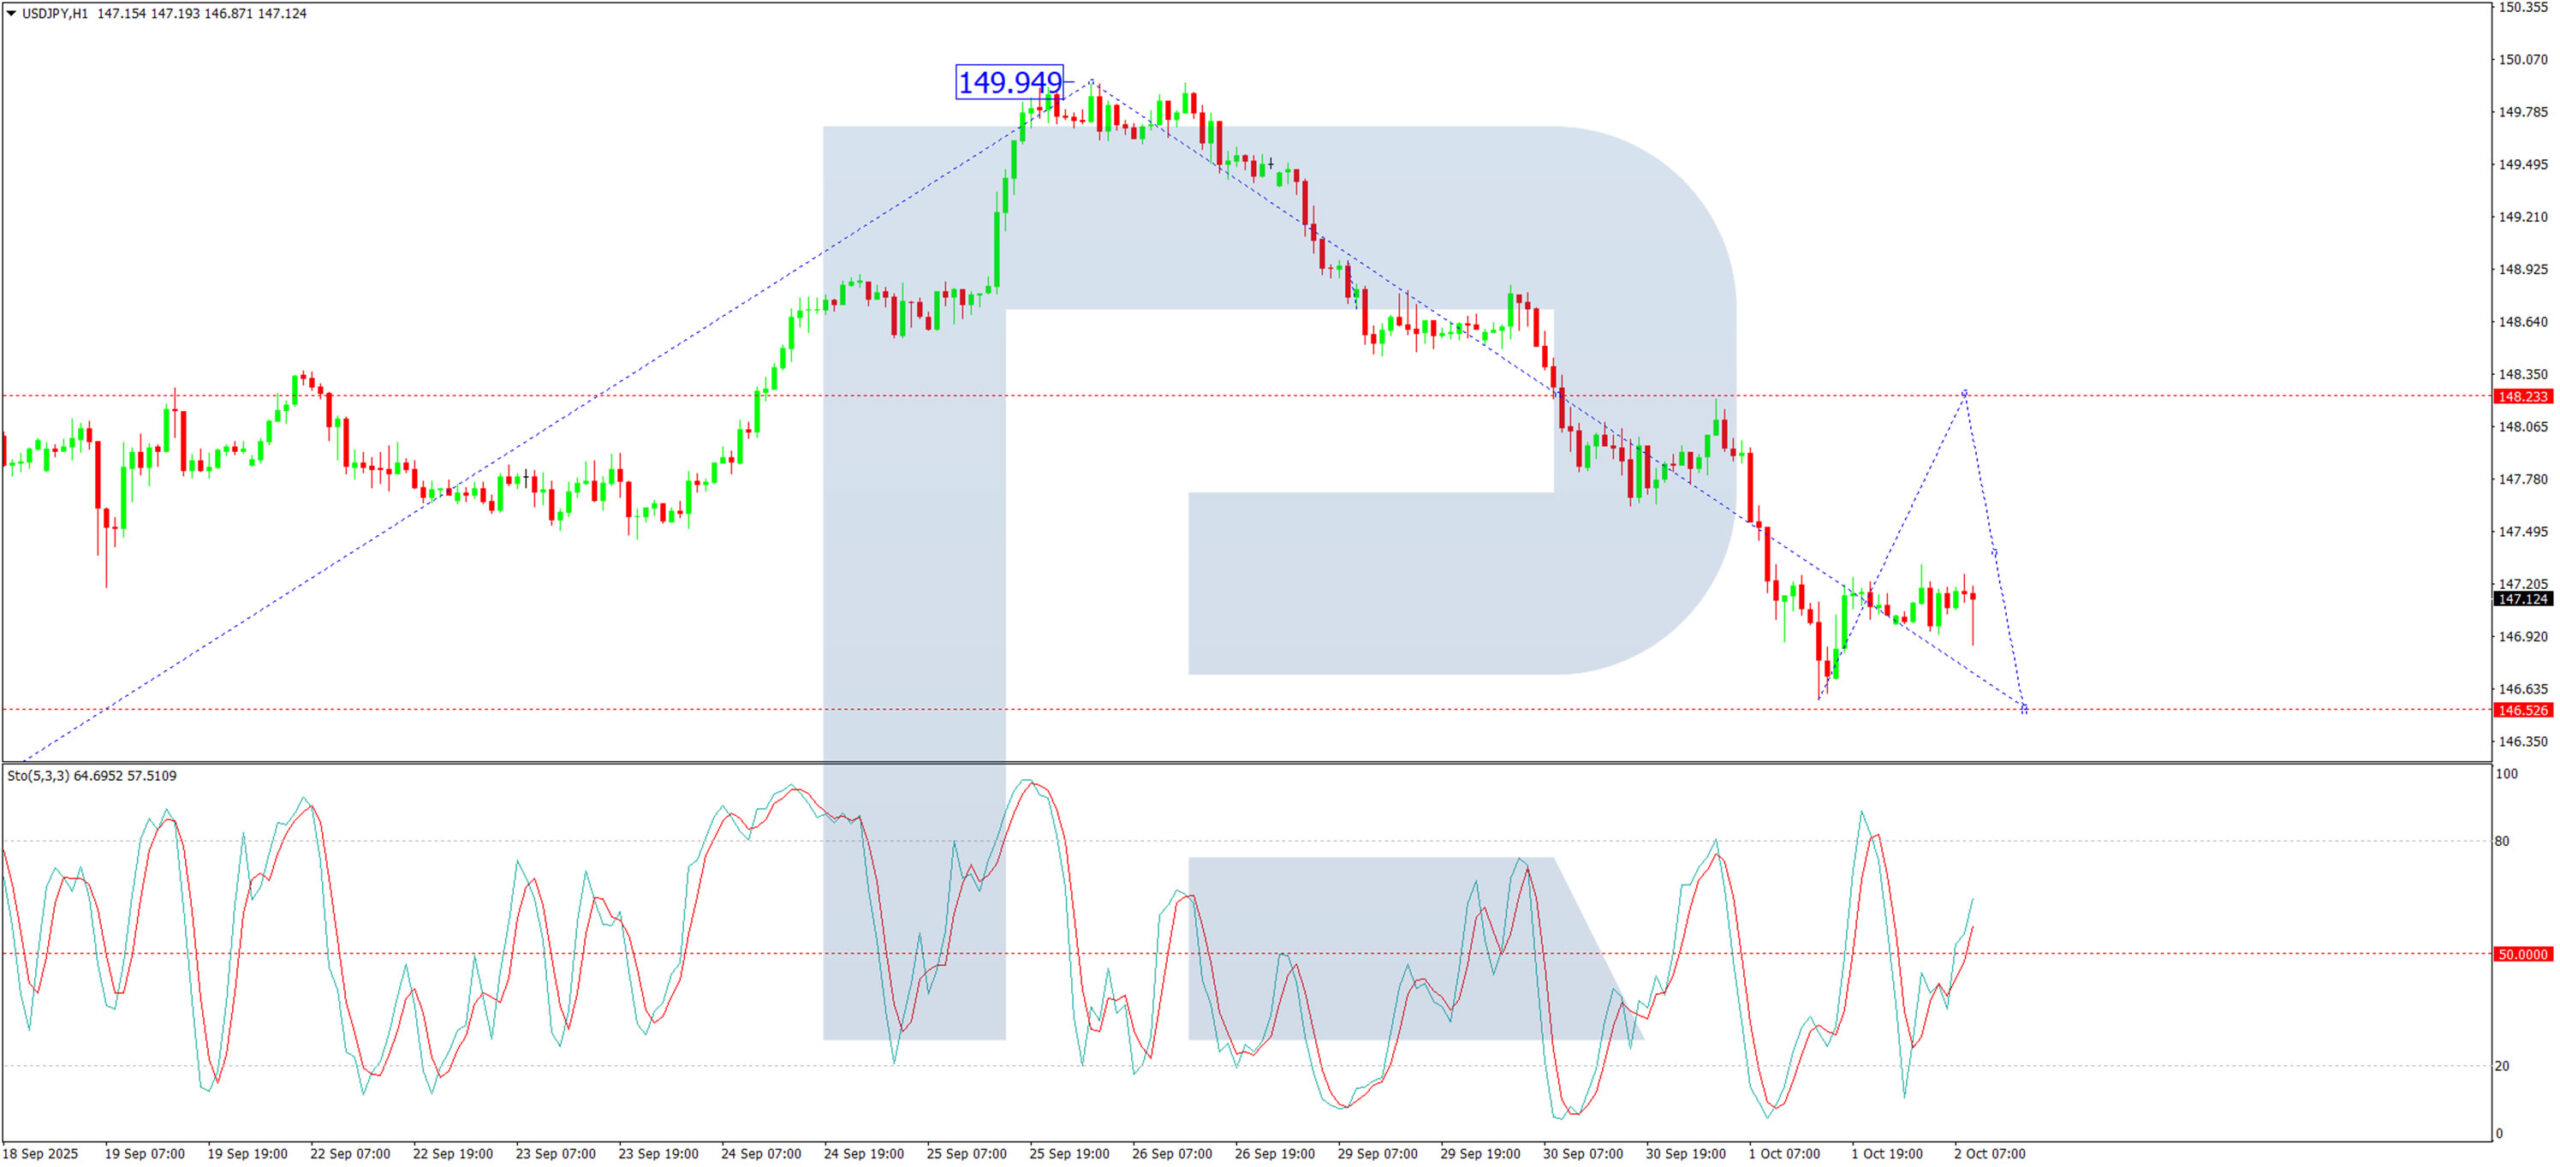
H1 Chart:
The H1 chart shows the pair achieving its local downside target at 146.60 and forming a consolidation range above it. An upward breakout from this range would initiate a growth wave towards 148.22, after which a corrective decline to 146.50 is expected. The Stochastic oscillator confirms this outlook, with its signal line above 50 and rising sharply towards 80.
Conclusion
While USD/JPY has entered a period of consolidation, the yen's underlying drivers—safe-haven demand and BoJ policy speculation—remain potent. The technical structure suggests a near-term bounce is possible, but the potential for a resumption of the yen's rally remains high, making the current pause a potentially temporary one.
BoE survey shows inflation expectations edge higher, uncertainty still elevated
UK firms reported a slight uptick in inflation expectations in September, according to the BoE’s Decision Maker Panel survey. Year-ahead CPI expectations rose by 0.1 percentage point to 3.4%, while three-year expectations were unchanged at 2.9%.
Wage growth expectations held steady at 3.6% on a three-month basis, though the single-month figure rose by 0.3 percentage points to 3.8%.
The survey highlighted ongoing concerns around the business outlook. Some 58% of firms judged overall uncertainty as high or very high, up slightly from 57% in August. That said, uncertainty surrounding year-ahead sales dipped marginally to 4.3%, while price uncertainty was unchanged at 1.7%, both far below the levels seen during past peaks.
Natural Gas Price Hits 2.5-Month High
As the XNG/USD chart shows today, natural gas prices have risen above $3.600/MMBtu for the first time since mid-July.
According to media reports, the rise in gas prices has been driven by:
→ Weather models forecasting colder conditions, suggesting the heating season may begin earlier than expected;
→ An EBW Analytics Group note highlighting short-covering activity in the market, which has accelerated the rally (a short squeeze effect).
At the same time, chart analysis suggests that the upside potential may be limited.
Technical Analysis of the XNG/USD Chart
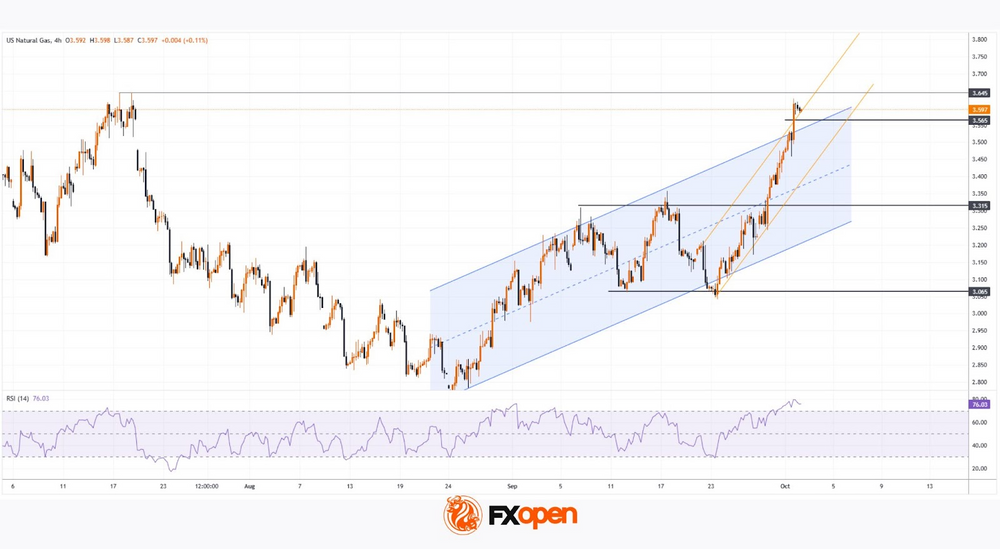
Three factors might restrict further price growth:
→ The RSI indicator signals extreme overbought conditions.
→ Price has moved above the upper boundary of the channel (which has been in place since August), indicating that natural gas may be overvalued.
→ If we view September’s moves as a 3.065–3.315 range, then the target following the breakout on 29 September should be calculated based on the range height — pointing to 3.645. This target has already been reached.
Thus, we could assume that the market is vulnerable to a pullback (for example, towards the median of the blue channel). At the same time, the steep upward trajectory (highlighted in orange) remains intact.
Therefore, we may see an attempt at a bullish breakout of the July high near the 3.65 level — although, given the factors mentioned above, such a breakout could well prove to be a false one.
Start trading commodity CFDs with tight spreads. Open your trading account now or learn more about trading commodity CFDs with FXOpen.
This article represents the opinion of the Companies operating under the FXOpen brand only. It is not to be construed as an offer, solicitation, or recommendation with respect to products and services provided by the Companies operating under the FXOpen brand, nor is it to be considered financial advice.
Hang Seng Index Hits 4-Year High
As the chart shows, Hong Kong’s Hang Seng Index (Hong Kong 50 on FXOpen) climbed above the 27,300 mark today – for the first time since summer 2021. The bullish momentum has been supported in part by corporate news. According to media reports:
→ Shares of Chinese EV maker NIO Inc. rose by around 5% following news that vehicle deliveries had increased by 64.1% year-on-year.
→ Shares of Ascletis Pharma Inc. jumped 12.8% after the company announced a share buyback programme.
→ Alibaba shares surged 4% after JPMorgan raised its price target by more than 40%, citing AI industry development and strong user engagement.
Since 1 September, the Hang Seng Index (Hong Kong 50 on FXOpen) has gained over 7%.
Technical Analysis of the Hang Seng Index Chart
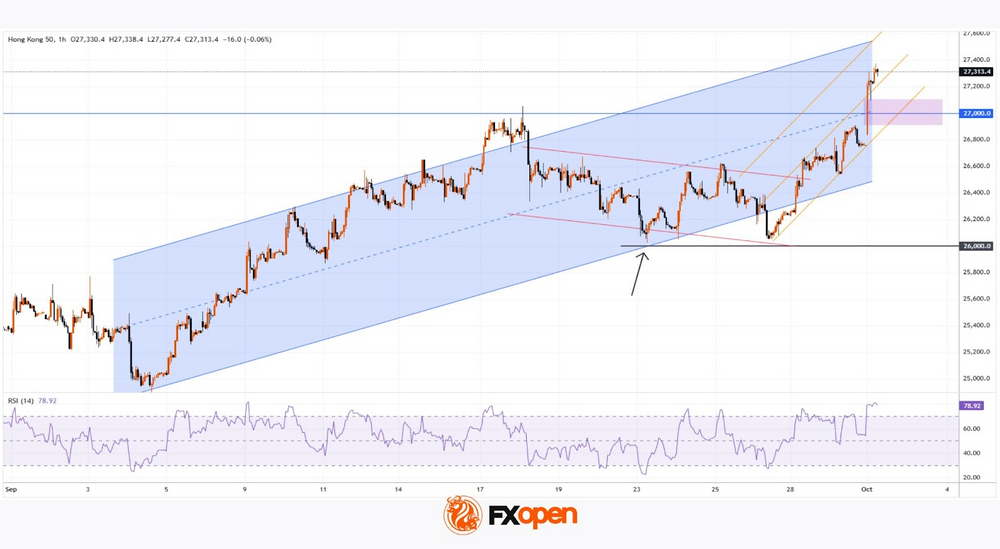
In our 23 September review of the index chart, we:
→ highlighted that the price had fallen to the lower boundary of the blue ascending channel;
→ noted signs of demand emerging around the psychological 26,000 level.
Since then (as shown by the arrow), price action has been supported by these levels. On 26 September, bears attempted once more to break below 26k, but failed – giving bulls the opportunity to seize control. This resulted in the formation of a steep upward trajectory, highlighted in orange.
From an optimistic perspective:
→ The market has resumed its uptrend, breaking above the corrective bull flag pattern (shown in red).
→ The September high near the psychological 27,000 level was broken decisively — the long candlestick points to a demand–supply imbalance favouring buyers, reinforcing the relevance of the bullish Fair Value Gap pattern highlighted in purple.
→ The price is now trading in the upper half of the blue channel (a sign of strong demand).
At the same time, the RSI indicator has entered the overbought zone. Once the first wave of positive sentiment fades, a bout of profit-taking could happen, which might trigger a correction — potentially involving a retest of the 27k level or the lower orange line.
Trade global index CFDs with zero commission and tight spreads. Open your FXOpen account now or learn more about trading index CFDs with FXOpen.
This article represents the opinion of the Companies operating under the FXOpen brand only. It is not to be construed as an offer, solicitation, or recommendation with respect to products and services provided by the Companies operating under the FXOpen brand, nor is it to be considered financial advice.
BoJ’s Uchida: Economy resilient, inflation to re-accelerate gradually
BoJ Deputy Governor Shinichi Uchida highlighted resilience in Japan’s economy, pointing to positive corporate sentiment in the Tankan survey and improved manufacturer outlooks as trade uncertainty with the US has eased. He noted that despite tariff-related profit pressures for some firms, revenues remain elevated, capital expenditure is trending higher, and consumption is firm.
On inflation, Uchida said underlying price growth may stagnate in the near term but should re-accelerate gradually as expectations rise. This suggests the BoJ continues to see progress toward achieving its price stability goal, albeit at a measured pace.
Reaffirming the policy stance, Uchida said the BoJ will continue lifting rates if economic and price trends evolve as projected, while remaining data-dependent. He stressed that decisions will be guided by evidence, not pre-set commitments.
Dollar Trades Mixed: ADP Disappoints, Shutdown Adds Risks
The US dollar showed a mixed performance: a weak ADP employment report (-32k versus the forecast of growth) heightened doubts over the resilience of the labour market, while uncertainty surrounding a US government shutdown added further pressure on the greenback. Markets are pricing in risks of delayed publication of key economic data, including the nonfarm payrolls report, which could complicate the Federal Reserve’s policy decisions in the coming months.
In the USD/JPY pair, the dollar continues to lose ground, falling towards the 147.00 level, where short-term support is located. The pressure is reinforced by a combination of weak US data and stronger demand for the yen as a so-called safe-haven asset. Meanwhile, USD/CAD is consolidating after climbing to 1.3950: the Canadian dollar found support amid the release of business activity data and fluctuations in oil prices, which remain a key driver for the pair.
Near-term moves in the major currency pairs will largely depend on the balance of the news flow and investor reaction to political uncertainty in the United States.
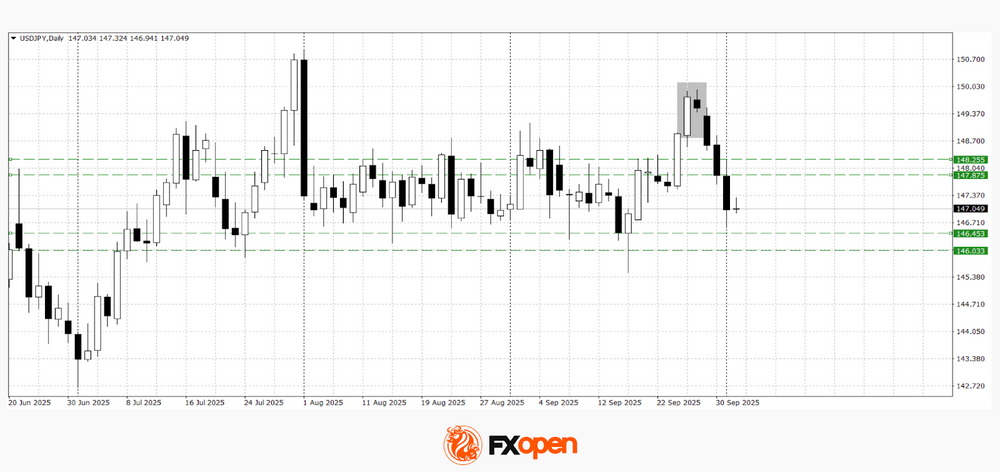
USD/JPY
At the end of September, dollar buyers in the USD/JPY pair almost managed to test the critical resistance level near 150.00. However, the slowdown in bullish momentum allowed dollar bears to seize the initiative, forming a bearish harami candlestick pattern on the daily timeframe. Technical analysis of USD/JPY suggests a potential continuation of the downward movement towards the key range of 146.00–146.50. Bulls, however, may attempt to push the pair back into the 147.90–148.20 zone.
Key events that could influence USD/JPY movements:
- Today at 17:00 (GMT+3): US factory orders;
- Today at 17:30 (GMT+3): Speech by Dallas Fed President Lorie K. Logan;
- Today at 23:30 (GMT+3): Federal Reserve balance sheet.
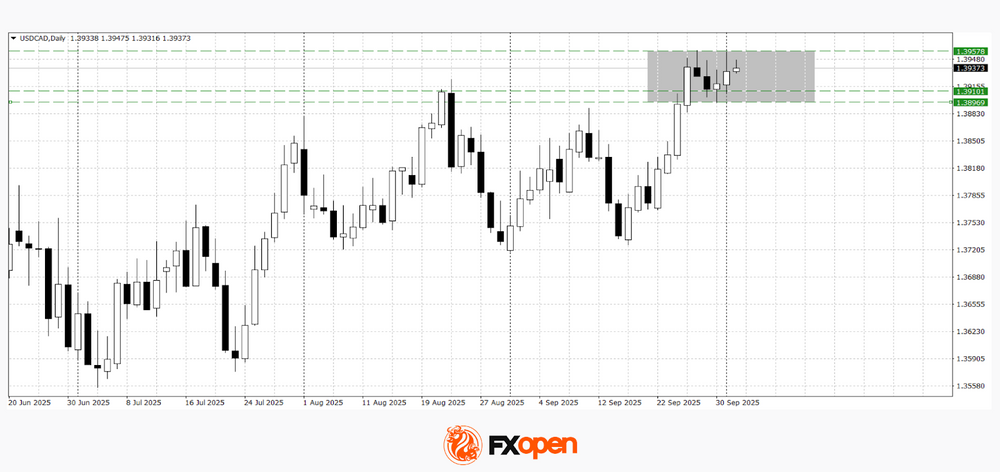
USD/CAD
Despite the negative backdrop for the dollar, buyers in the USD/CAD pair are confidently holding prices near 1.3900. Yesterday, the pair once again tested 1.3960, but there has been no renewed bullish momentum so far. Technical analysis of USD/CAD points to a sideways trading pattern within the 1.3890–1.3960 range. A breakout beyond this corridor could determine the medium-term trading direction of the pair.
Key events that could influence USD/CAD movements:
- Tomorrow at 16:30 (GMT+3): Canada Services PMI;
- Tomorrow at 16:45 (GMT+3): US Services PMI;
- Tomorrow at 17:00 (GMT+3): US ISM Non-Manufacturing PMI.
Trade over 50 forex markets 24 hours a day with FXOpen. Take advantage of low commissions, deep liquidity, and spreads from 0.0 pips. Open your FXOpen account now or learn more about trading forex with FXOpen.
This article represents the opinion of the Companies operating under the FXOpen brand only. It is not to be construed as an offer, solicitation, or recommendation with respect to products and services provided by the Companies operating under the FXOpen brand, nor is it to be considered financial advice.
Nasdaq (NQ) on Track for Higher Wave 5 Finish
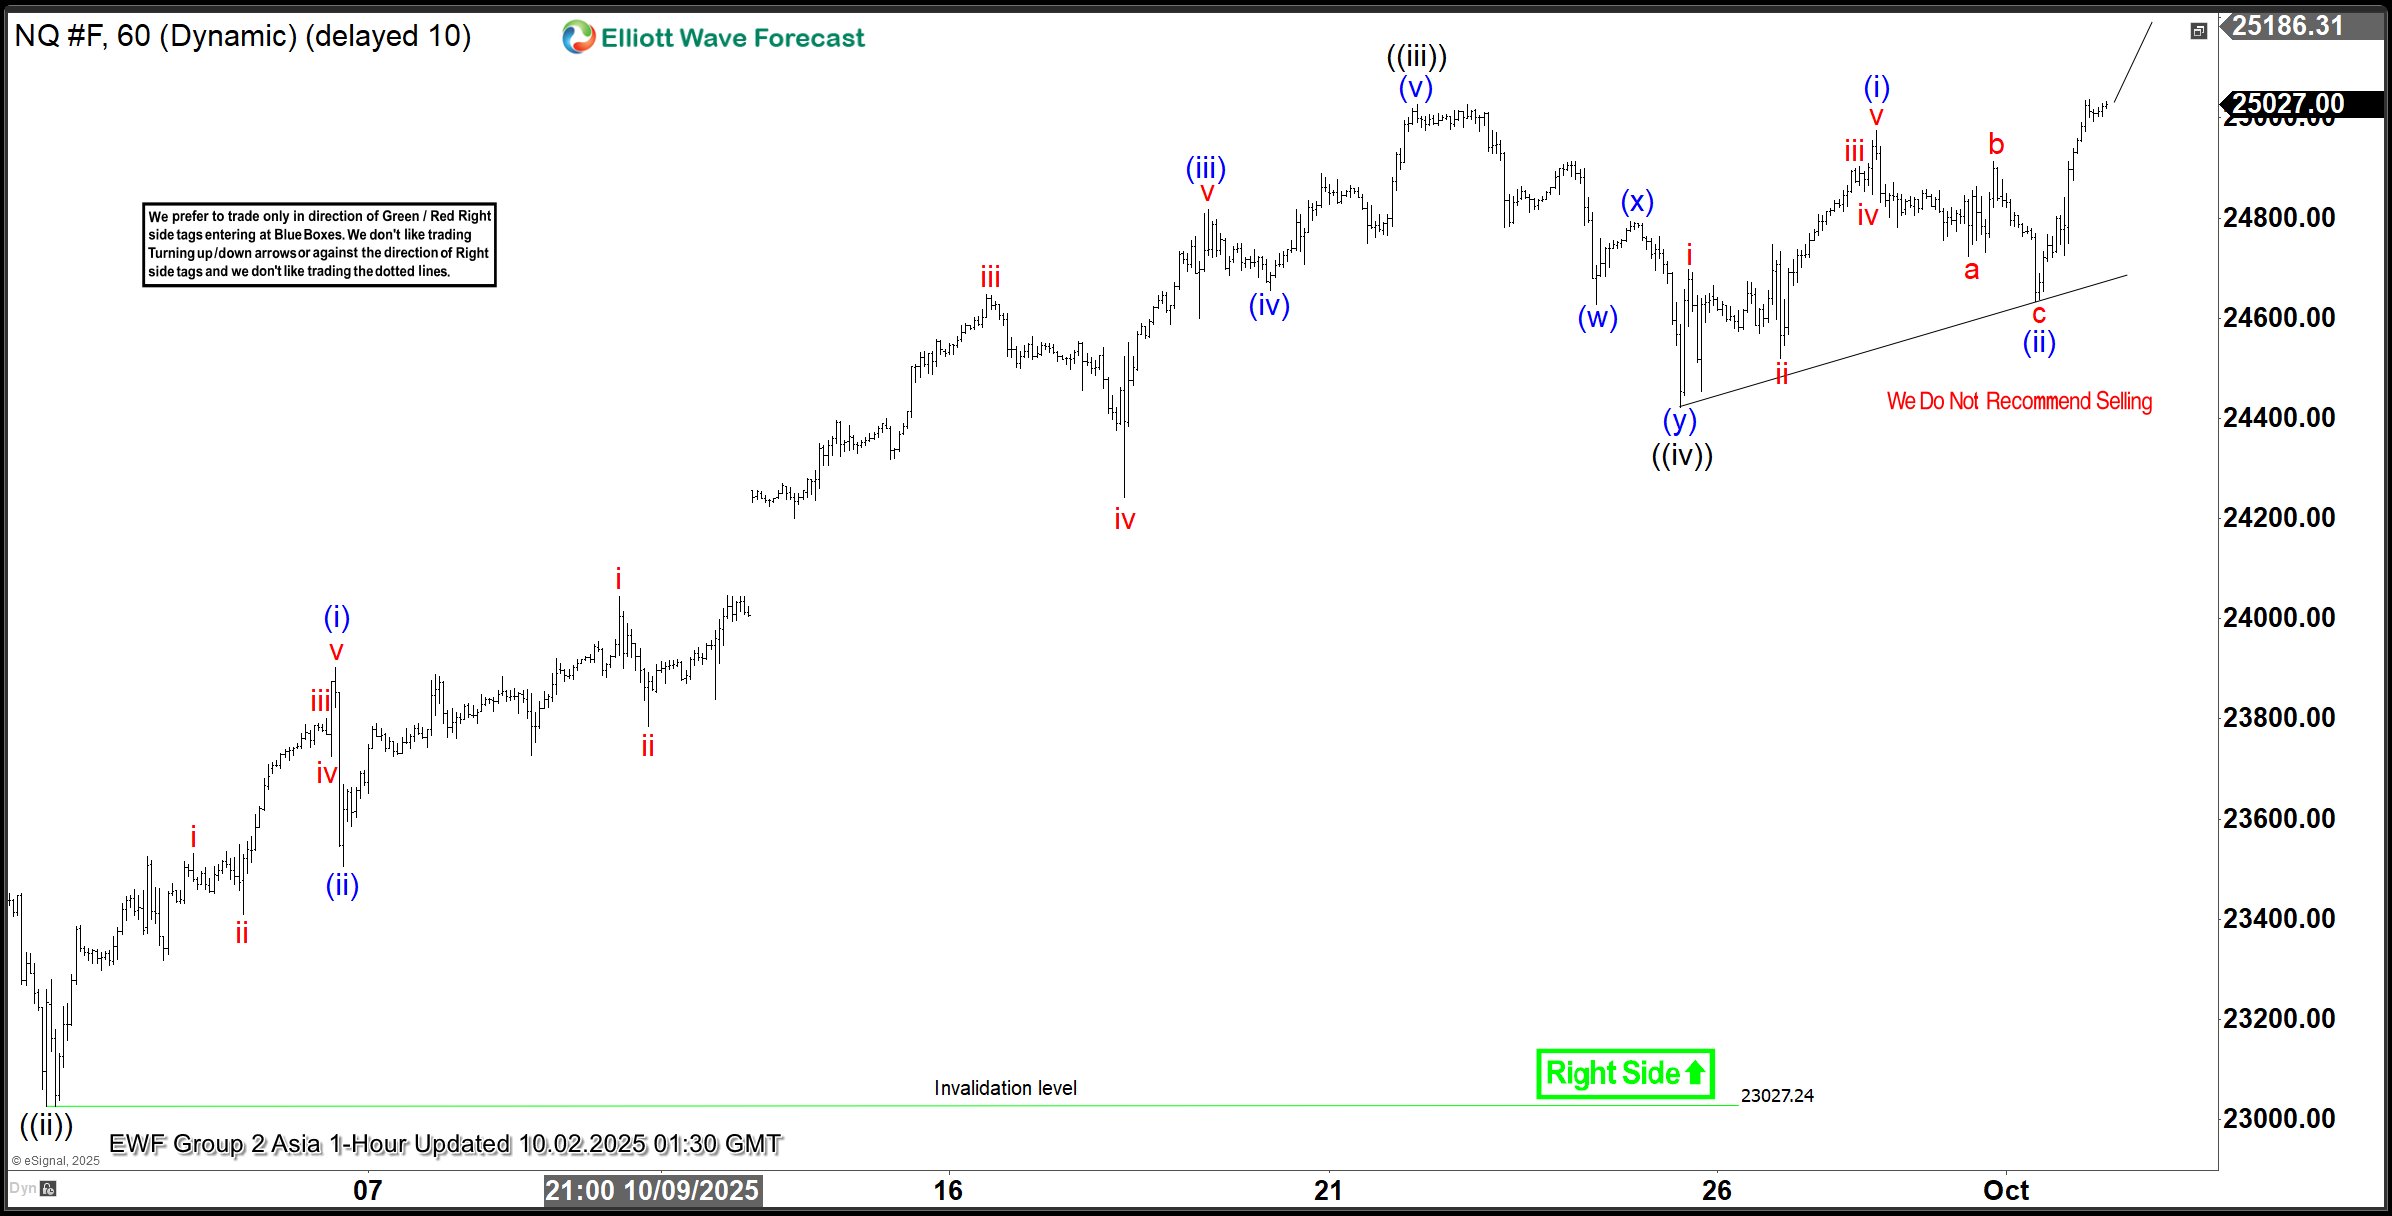
The short-term Elliott Wave analysis for the Nasdaq (NQ) reveals a bullish cycle initiated from the August 2, 2025, low, progressing as a five-wave impulse structure. Wave ((i)) surged to 24,068.5. The corrective wave ((ii)) concluded at 23,025.25, as depicted in the one-hour chart. The Index then advanced in wave ((iii)) to 25,027.25. This wave developed as an impulse in a lesser degree, showcasing robust bullish momentum in the market.
From the wave ((ii)) low, wave (i) climbed to 23,902. A brief dip in wave (ii) stabilized at 23,505. Wave (iii) rallied to 24,816. A minor pullback in wave (iv) ended at 24,655. The final leg, wave (v), reached 25,027.25, completing wave ((iii)) in the higher degree. The subsequent wave ((iv)) correction unfolded as a double-three Elliott Wave structure, a common pattern in such cycles. From wave ((iii)), wave (w) declined to 24,627. Wave (x) recovered to 24,793.50. Wave (y) then dropped to 24,422.5, finalizing wave ((iv)).
As long as the pivotal low at 23,027.2 remains intact, the Index is expected to extend higher in wave ((v)). This outlook supports continued upside in the near term, consistent with the impulsive structure’s progression and market dynamics.
Nasdaq (NQ) – 60 Minute Elliott Wave Technical Chart:
NQ – Elliott Wave Technical Video:
https://www.youtube.com/watch?v=oPh344P248E
USD/JPY: A Medium-Term Yen Bullish Breakout Looms, Watch 146.30
Key takeaways
- BoJ policy shift intact: Japan’s central bank is still moving gradually toward policy normalization, supporting renewed yen strength.
- Tankan survey improvement: Q3 2025 Tankan survey for large manufacturers improved to 14, its highest since Q4 2024, boosting economic confidence.
- Yield spread narrowing: US-Japan yield differentials are shrinking, making US Treasuries less attractive versus JGBs, pressuring USD/JPY lower.
- Technical setup: A break below 146.30 may trigger a medium-term bearish breakout, exposing deeper downside targets.
After trading in a choppy sideways range for almost five months since late April 2025, the Japanese yen is likely on the brink of undergoing a medium-term (multi-week) appreciation against the US dollar.
Several macro/fundamental and momentum factors support this potential impending Japanese yen strength revival view, coupled with the Bank of Japan (BoJ)’s ongoing path of monetary policy normalization (increasing interest rates gradually).
Let’s review them in greater detail.
Further improvement in the Tankan survey with narrowing of US-Japan implied policy rate curve spread
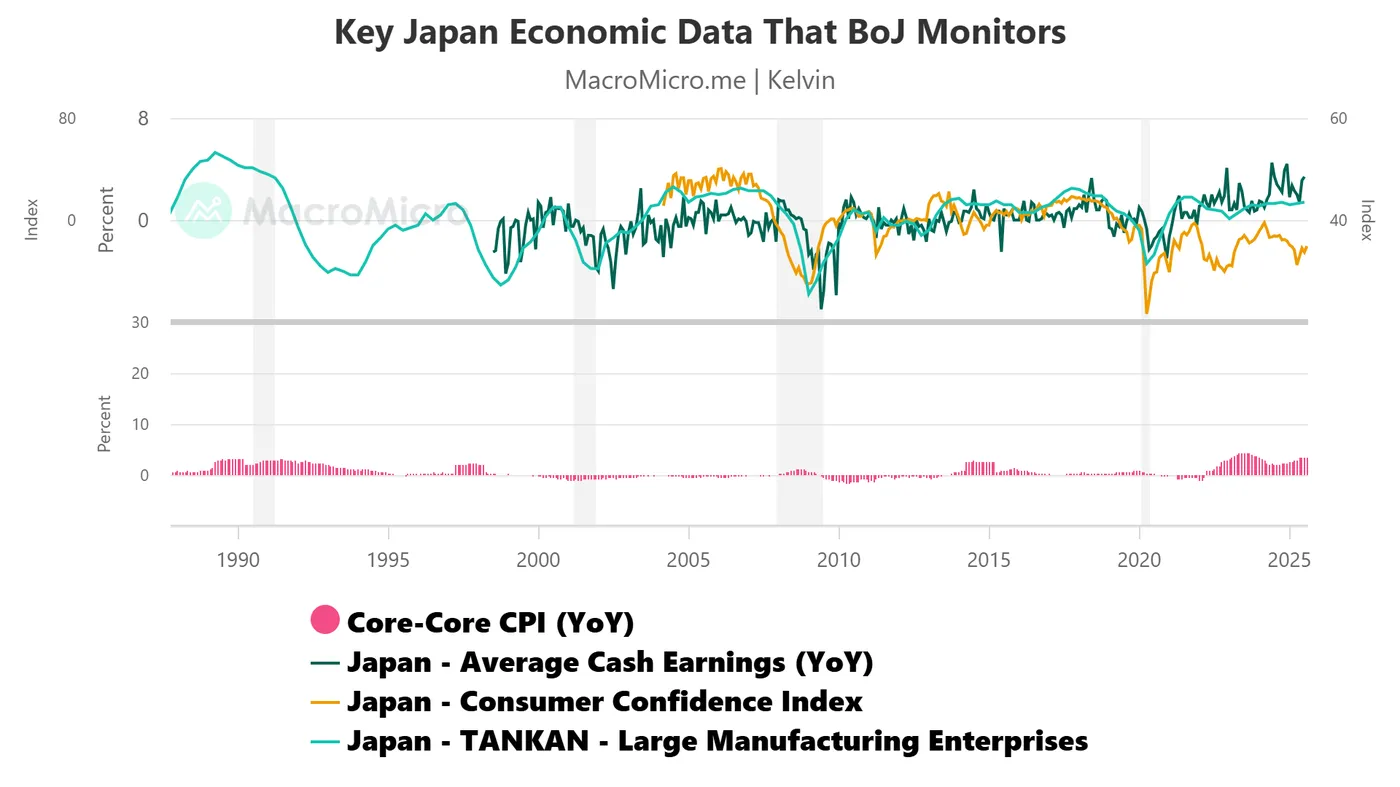
Fig. 1: Japan core-core CPI, Average Cash Earnings, Tankan Survey, Consumer Confidence as of Sep 2025 (Source: MacroMicro)
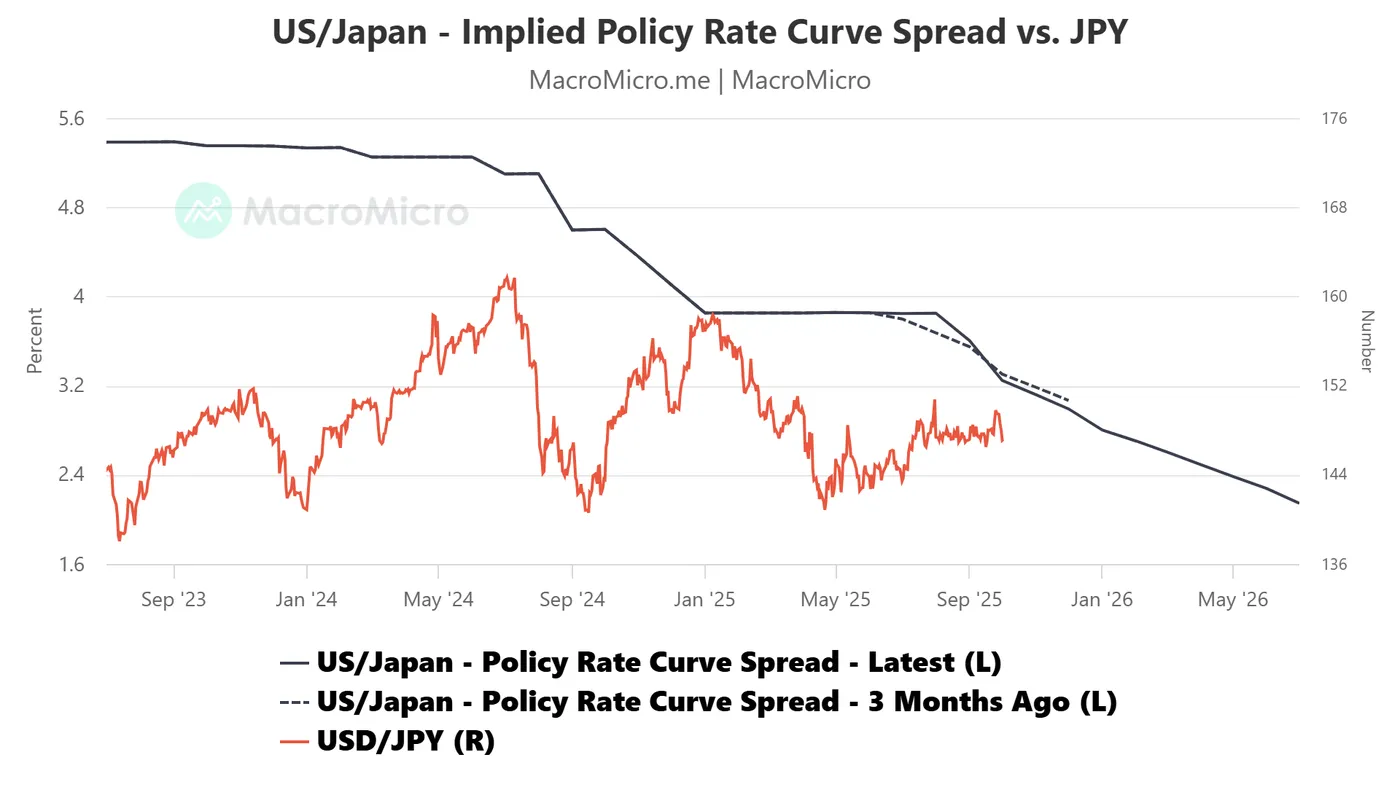
Fig. 2: US/Japan short-term policy rate curve spread as of 1 Oct 2025 (Source: MacroMicro)
One of the key economic data points, other than the inflation trend, that the BoJ monitors to determine and set the path of monetary policy in Japan, is the quarterly Tankan surveys on manufacturers, which poll their outlook on overall business conditions, considering profits under current conditions and for the next three months.
The latest Q3 2025 Tankan survey for large Japanese manufacturers (in index form) has further improved to 14 from 13 in Q2, which is also its highest reading since Q4 2024, as trade tariff tensions between the US and Japan have eased since the finalization of the US-Japan trade deal in early September 2025 (see Fig. 1)
Hence, the short-term interest rate futures market in Japan has continued to price in an interest rate hike by the BoJ in Q4 2025. This observation is evident in the US-Japan implied policy rate curve spread.
The monthly implied short-term interest rate spread (via short-term interest rate futures) between the US and Japan has continued to narrow in the next three months from the October 2025 print of 3.25% to 3.12% in November 2025, 2.99% in December 2025, and 2.80% in January 2026.
In addition, the current US-Japan implied policy rate curve spread has shifted downwards from three months ago at this juncture (see Fig. 2). The further narrowing of the US/Japan implied short-term interest rate spread is likely to put downside pressure on the USD/JPY.
The 10-year US Treasury/JGB yield spread is breaking below a major support level
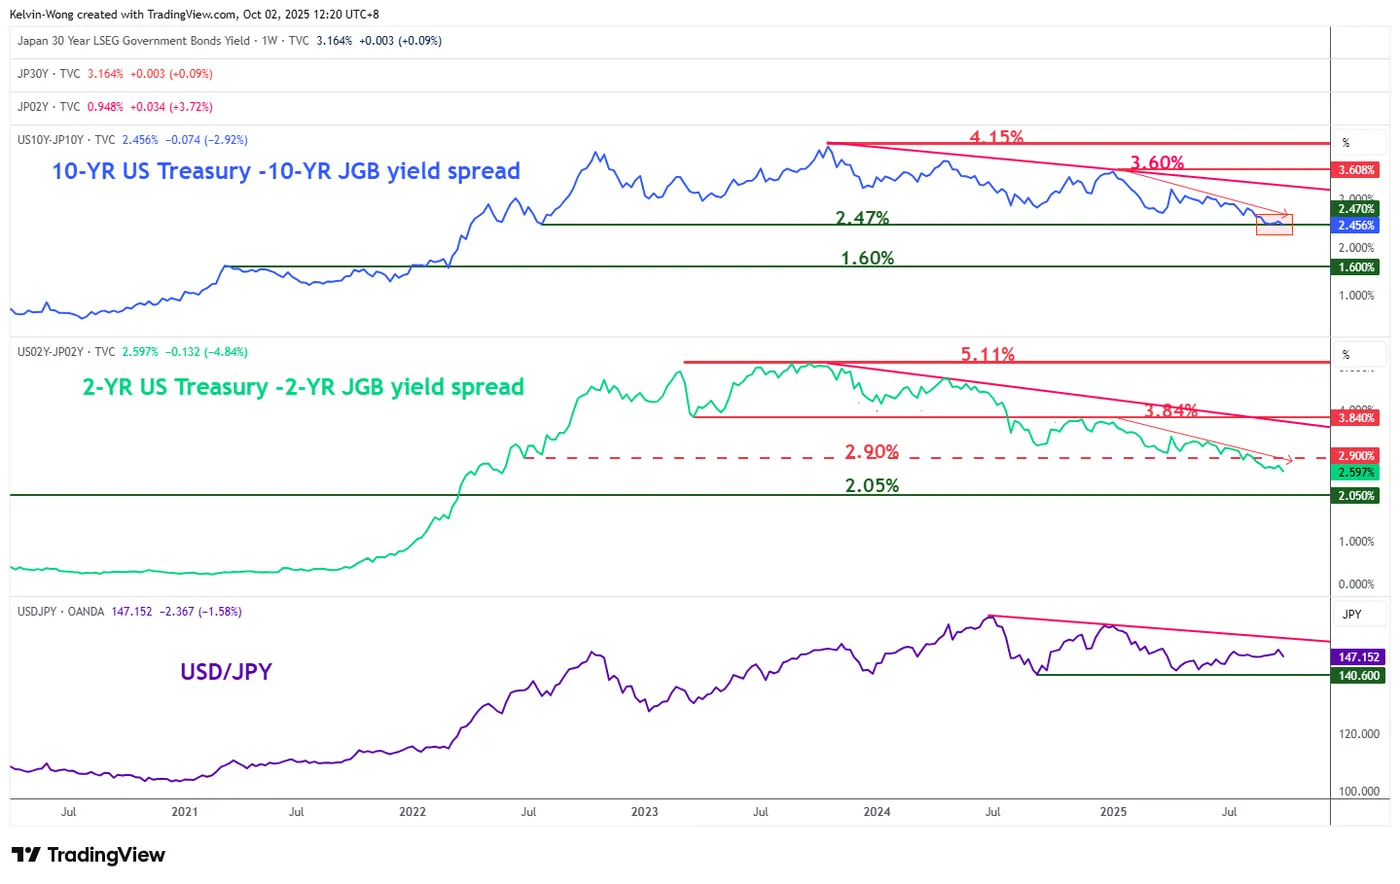
Fig. 3: Yield spreads of US Treasury/JGB with major trend of USD/JPY as of 2 Oct 2025 (Source: TradingView)
The yield premium between the 2-year US Treasury note and the 2-year Japanese Government Bond (JGB) has broken below a former major support of 2.90% since the week of 18 August 2025 and narrowed further to 2.69% at the time of writing.
The 10-year yield spread between the US Treasury note and JGB is now challenging the 2.47% major support after it hovered slightly above it for the entire month of September 2025. Right now, it is staging an intraday breakdown with a current level of 2.45% (see Fig. 3)
The continued narrowing of the yield differential indicates that 10-year US Treasuries are becoming relatively less attractive compared to 10-year JGBs, a dynamic that may in turn place downside pressure on USD/JPY.
Let’s now examine the USD/JPY from a technical analysis perspective to determine its latest short-term (1 to 3 days) trend bias and key technical levels to watch.
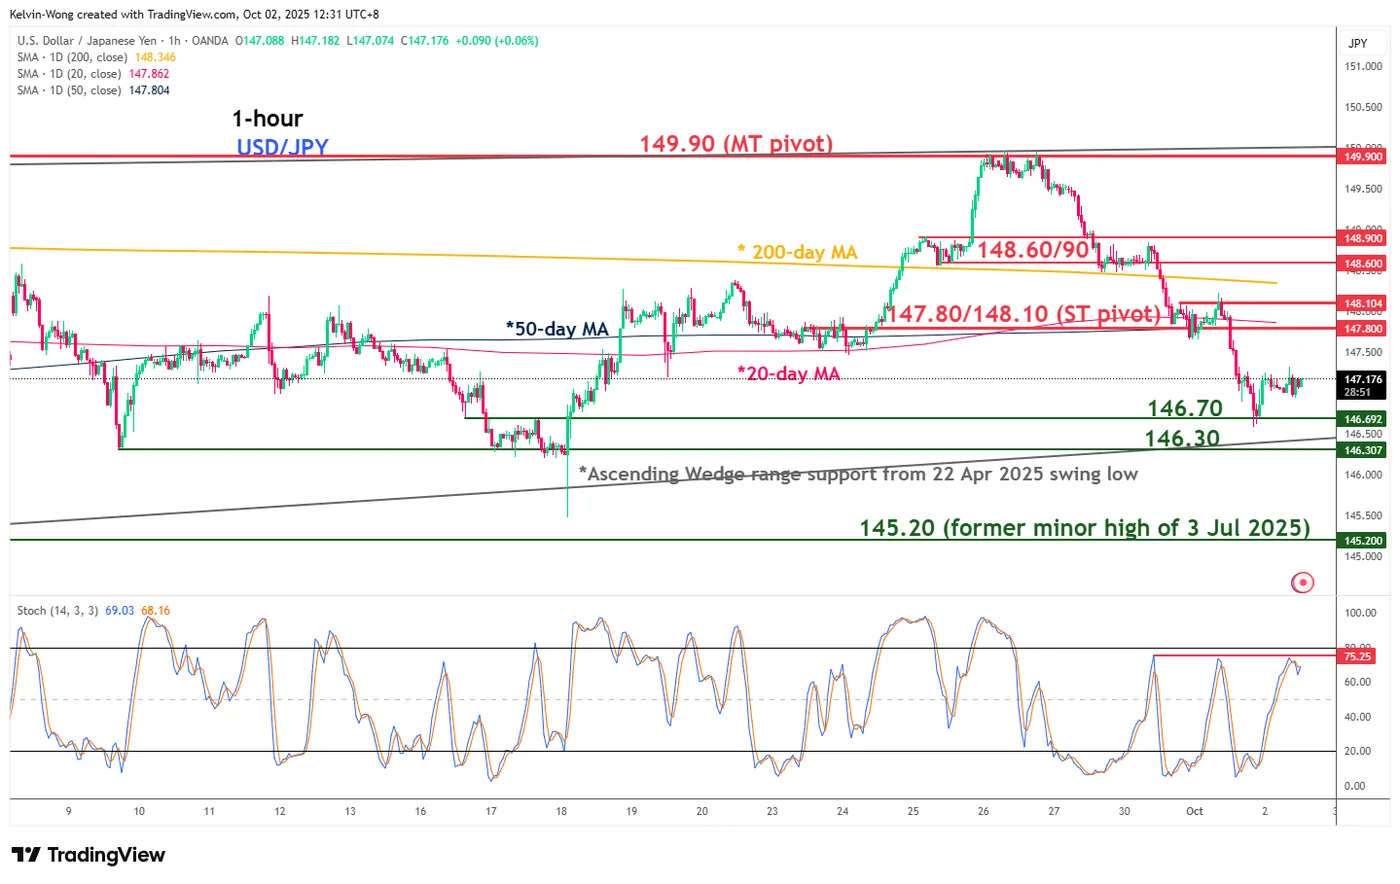
Fig. 4: USD/JPY minor trend as of 2 October 2025 (Source: TradingView)
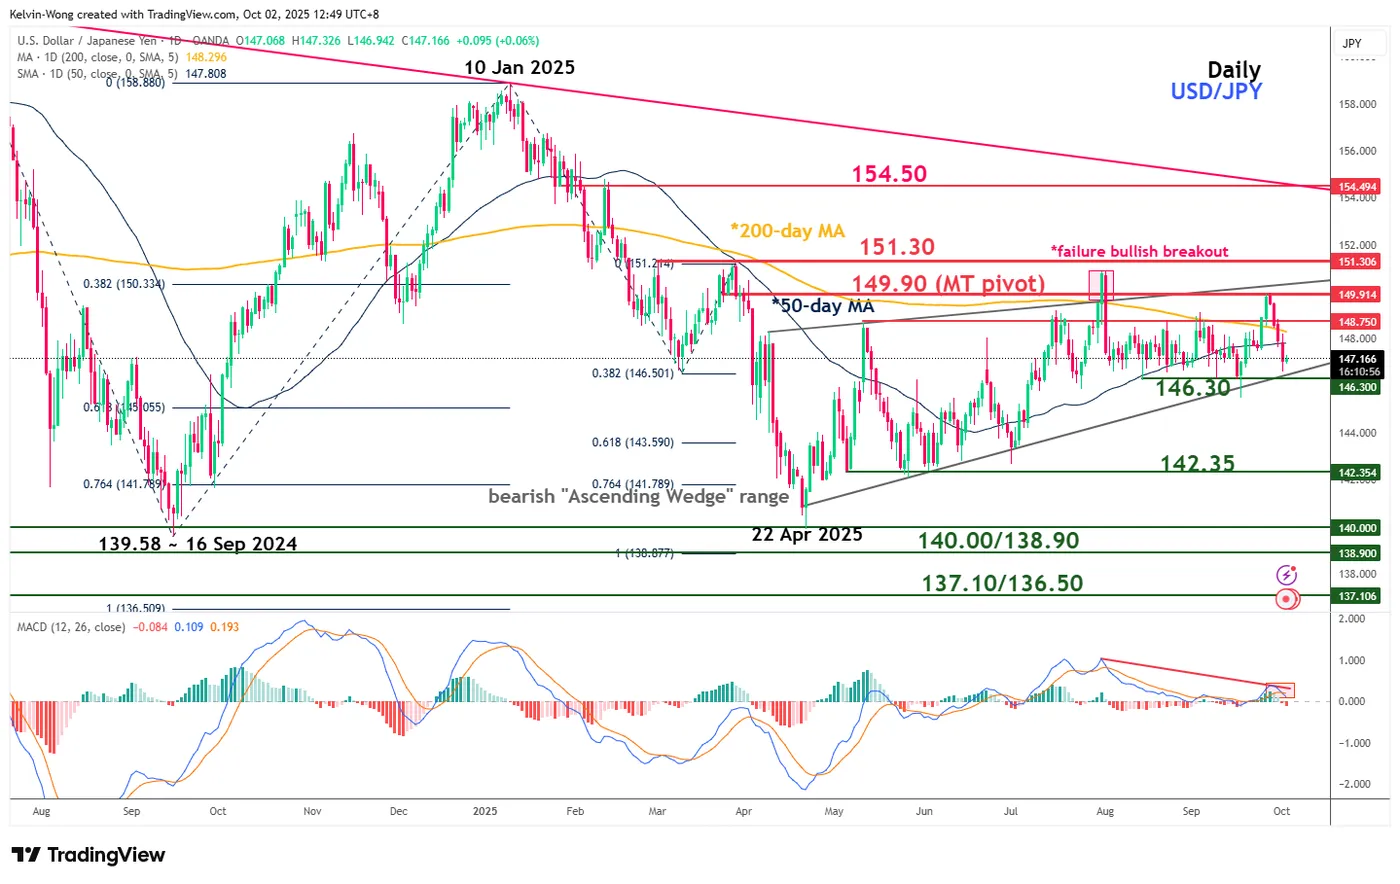
Fig. 5: USD/JPY medium-term trend as of 2 October 2025 (Source: TradingView)
Preferred trend bias (1-3 days)
Bearish bias below 147.80/148.10 short-term pivotal resistance for USD/JPY within its range configuration for the next intermediate support to come in at 146.70, followed by the medium-term “Ascending Wedge” range support now at 146.30.
A break below 146.30 triggers a potential medium-term bearish breakout of the USD/JPY for a multi-week bearish impulse down move sequence to expose the next 145.20 intermediate support in the first step.
Key elements
- The price actions of the USD/JPY have traded below its 20-day and 50-day moving averages, which are now acting as a key short-term resistance zone of 147.80/148.10 (see Fig. 4).
- The hourly Stochastic oscillator of the USD/JPY has now risen to a resistance level of 75, which is coming close to its overbought zone (above the 80 level) (see Fig. 4)
- The USD/JPY has undergone a 5-month bearish “Ascending Wedge” range configuration since the 22 April 2025 low of 139.89, with the lower boundary of the “Ascending Wedge” now acting as a key medium-term support at 146.30 (see Fig. 5).
- The daily MACD trend indicator of the USD/JPY has flashed out a bearish crossover condition at this juncture after it formed a resistance on Monday, 29 September 2025. These observations suggest a potential imminent change of medium-term trend condition on the USD/JPY from sideways to a downtrend (see Fig. 5).
Alternative trend bias (1 to 3 days)
A clearance above 148.10 invalidates the bearish scenario for the USD/JPY and sees a squeeze up towards the next intermediate resistance at 148.60/148.90, followed by the key medium-term resistance of 149.90 (the upper boundary of the “Ascending Wedge” range configuration).