Sample Category Title
EUR/AUD Daily Outlook
Daily Pivots: (S1) 1.7708; (P) 1.7763; (R1) 1.7799; More...
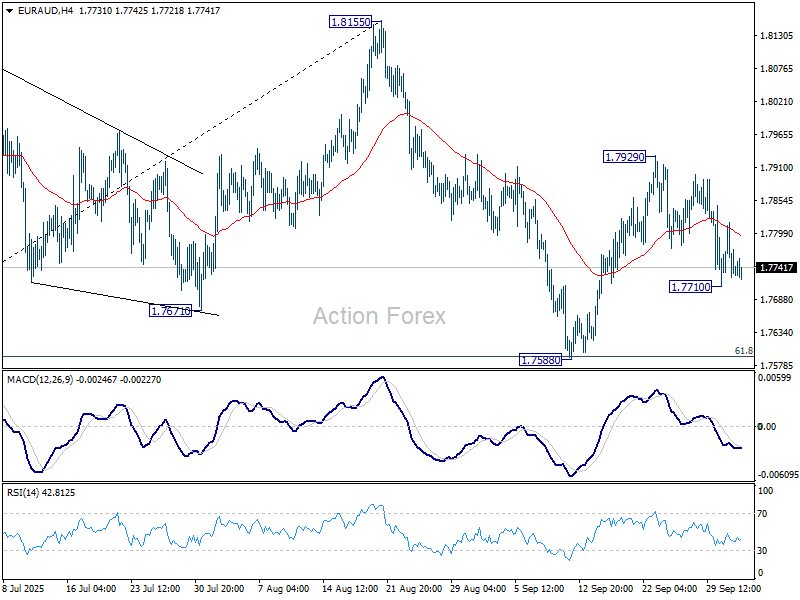
Intraday bias in EUR/AUD remains neutral for the moment. On the upside, above 1.7929 will resume the rebound from 1.7588 to retest 1.8155. However, sustained break of 61.8% retracement of 1.7245 to 1.8155 at 1.7593, will resume the fall from 1.8155 to 1.7245 resistance, as part of the corrective pattern from 1.8554 high.
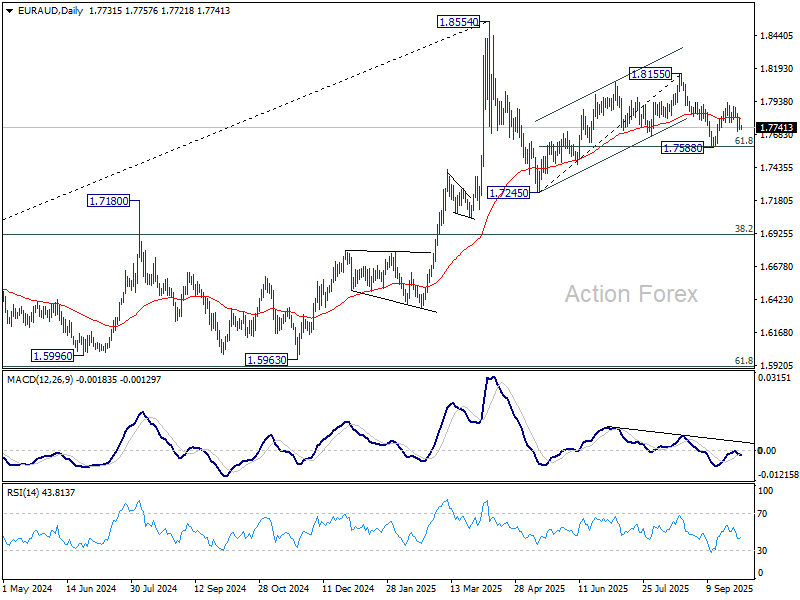
In the bigger picture, price actions from 1.8554 medium term top are seen as a corrective pattern. Deeper fall could be seen as the pattern extends, but downside should be contained by 38.2% retracement of 1.4281 (2022 low) to 1.8554 at 1.6922 to bring rebound. Uptrend from 1.4281 is expected to resume at a later stage.
Gloom Never Looked So Good
The US government remains shut, which means the BLS will likely not release the September jobs report this Friday. Yesterday’s ADP numbers, however, injected a strong dose of dovishness to keep investors going for a few days longer. The data showed the US economy didn’t add jobs in September, but instead lost 32’000. Part of this was due to an adjustment tied to government-sourced figures, but taken together with other data, the trend is clear: the US labour market is weakening. And that’s before factoring in the political noise — Donald Trump is already threatening to fire thousands of federal employees if Washington fails to break the shutdown impasse.
But voila, the picture is gloomy for workers, but not for investors. Markets cheered the sight of 32’000 job losses, as it gave solid support to dovish Federal Reserve (Fed) expectations. The US 2-year yield — the best gauge of Fed bets — fell sharply, while the 10-year yield slipped to 4.10%, helped by safe-haven inflows into Treasuries. Risk appetite, though, showed no sign of being hit by the shutdown drama. On the contrary — the S&P 500 and Nasdaq both closed at fresh record highs. Big Tech led again, with AI still the dominant narrative. Reports of new deals in the AI cloud space kept enthusiasm alive, while Google and Apple unveiled new smart home devices. The Magnificent Seven climbed 0.57%. Some argue that the “Mag 7” is outdated, given it excludes this year’s AI darlings like Oracle, but the principle holds: Big Tech continues to shoulder the rally despite lofty valuations, while prospects of lower rates only add fuel.
Fed doves, AI appetite help fuel gains in Asian tech, as well. Alibaba jumped another 4% in Hong Kong after JPMorgan hiked its price target by 45% to $245 per share, following a similar move from Jefferies earlier this week. Lofty? Perhaps. But at today’s levels, Alibaba is still worth only half of what it was in 2021. If US Big Tech is a buy at record highs, then Alibaba at a 50% discount looks tempting. Granted, the stock has now entered overbought territory and a short-term pullback is likely. But any correction will likely attract dip buyers — and I believe it’s only a matter of time before Alibaba pushes above 200.
In FX, the dollar remains under pressure from both the shutdown and dovish Fed expectations. News that Lisa Cook will stay on the Fed board offered a touch of reassurance on central bank independence, but not enough to reverse the bearish tone. If the shutdown drags on, the dollar’s weakness will likely deepen. On Polymarket, the odds of the shutdown lasting more than two weeks stand near 40% — which would make it one of the longest in history. That backdrop could give the EURUSD bulls the momentum to test 1.18 resistance and extend gains to 1.20 earlier than previously expected. On the data front, early September inflation data from the eurozone showed a slight uptick in headline CPI, from 2.0% to 2.2%, cementing the idea that the European Central Bank (ECB) won’t be rushing into further rate cuts this year. Christine Lagarde herself said inflation is “quite contained in both directions” — another way of saying “we’re on hold.” That steadiness leaves the door open for the euro to grind higher.
Sterling, meanwhile, looks set to consolidate near 1.35, but conviction is weaker. UK fiscal dynamics are front and center as the Autumn Budget looms. Higher borrowing costs are narrowing fiscal headroom, raising the risk of tax hikes, spending cuts — or both. That prospect doesn’t exactly bolster appetite for the pound.
Elsewhere, safe havens remained in demand. The USDJPY tested the 100-DMA to the downside – near 146.50, and should be in a position to extend its move to 145, while the USDCHF consolidates just below the 80 cents level. If the franc is not gaining more than that, it’s certainly because of the news – earlier this week – that the Swiss National Bank (SNB) made its first meaningful franc sales in 3 years to soften the currency. The intervention remained softer than the ones we saw back in 2020, but the fact that the SNB started playing beyond rates to soften the franc means that it’s had enough with the franc’s strength, and that it has no other option than to provide francs to the market whether it pleases the US or not. As such, there will likely be more incentive to intervene through direct FX interventions in the coming months than cutting rates below zero – to avoid the negative side effects of below-zero rates on the Swiss economy. The latter means that gains in Swiss franc will hopefully remain limited during the US shutdown, and other safe haven assets like yen and gold look more appetizing.
Weak US Private Payrolls Amid Friday’s NFP Release Uncertainty
In focus today
In the euro area we receive the unemployment rate for August, which is expected to have remained at 6.2%. The labour market remains strong, but it has moderated somewhat with employment increases almost stalling, which does give some upward risks to the unemployment rate in the coming months as the labour force expands.
From the US, the Challenger report for layoff announcements is due for release for September. While this is not usually a tier-1 data release for markets, we will keep an eye out for potential upticks in layoffs considering the Fed's increased focus on labour markets.
Economic and market news
What happened yesterday
In the euro area, inflation rose to 2.2% y/y in September from 2.0% y/y, as expected, driven by base effects on energy prices. Importantly, looking at monthly momentum in core inflation it increased by 0.2% m/m SA, maintaining the pace of recent months, with services and core goods showing similar trends. The September inflation report offered no surprises and likely reaffirmed the ECB's outlook, supporting expectations for the deposit rate to remain at 2.0% through 2025 and 2026.
Meanwhile, final manufacturing PMI for September was revised slightly higher to 49.8 from 49.5, mainly due to Germany. However, the data confirms a loss of momentum in manufacturing, with the index falling below 50 after a strong rebound earlier this year. As front-loading effects continue to fade, we anticipate further weakness towards year-end and project modest GDP growth of 0.1% q/q in both Q3 and Q4.
In the US, the Supreme Court has temporarily blocked Trump's attempt to remove Federal Reserve Governor Lisa Cook, deferring the case until January 2026. This marks a significant victory for both Governor Cook and the independence of the Federal Reserve.
Also in the US, private payrolls fell by 32,000 in September, far below the expected +50,000, according to the ADP report. Annual benchmark revisions subtracted 43,000 jobs from the September figure, as past data are not revised retroactively. While this softens the headline weakness, the result remains significantly below expectations. If the government shutdown delays the release of the official Jobs Report, this ADP figure might be the Fed's only employment data for some time. Following the release, UST yields fell, and EUR/USD moved higher. Meanwhile, the ISM manufacturing index rose slightly to 49.1 in September from 48.7 in August, just above the forecast of 49.0. Gains in production and employment were offset by declines in new orders and export orders. The prices index fell to but remains at a historically high level. The mixed data prompted a muted market response.
In Sweden, the September manufacturing PMI rose slightly to 55.6 from 55.3 in August, supported by gains in employment and new orders. Over the past year, new orders have remained consistently strong, except for a sharp drop in June, which has since fully recovered. So far, tariffs have had no noticeable impact on production plans or supply chains, as delivery time remains stable. The PMI also indicates subdued price pressure, driven by a stronger currency and stable commodity prices.
In Norway, manufacturing PMI edged up to 49.9 in September from 49.6, indicating a continued moderate slowdown in the sector. The details were mixed, with new orders declining while production and employment improved. As we have highlighted previously, the PMI has consistently been weaker than hard data, so we currently place less weight on these figures.
Equities: Equities rose sharply yesterday, led by Europe. Investors showed little concern over the US government situation, consistent with historical market behaviour during shutdowns. The Stoxx 600 climbed 1.2%, while the US lagged behind. S&P 500 still managed a 0.3% gain - enough to reach a fresh all-time high.
The session was marked by tariff relief, particularly benefiting pharma and biotech stocks after Pfizer struck a deal with the US government, fuelling expectations of similar agreements with other companies. European steelmakers also rallied (SSAB +9%) on a new turn in the trade war: EU vs China. Reports suggest the European Commission may cut steel import quotas by nearly half and impose tariffs of up to 50% on imports above those limits, basically mirroring US tariff levels. Futures are higher this morning.
FI and FX: The combination of a broad-based rally in risky assets, lower USD yields and an outperformance in Europe vis-à-vis US made for a very strong cocktail for most European FX yesterday including NOK, SEK and GBP. US yields declined across the board in yesterday's session, led by the front end, which fell 8bp following a very soft ADP employment report showing private sector payrolls contracted by 32k in September. The weak labour market data led markets to fully price in a 25bp Fed cut later this month. EUR/DKK rose above 7.4660 yesterday and thus towards the top end of the trading range. The move comes before a tidal wave of liquidity hits the market today, when the government's purchase of new Ørsted shares and Copenhagen Airport are set to settle.
EUR/GBP Daily Outlook
Daily Pivots: (S1) 0.8682; (P) 0.8712; (R1) 0.8734; More...
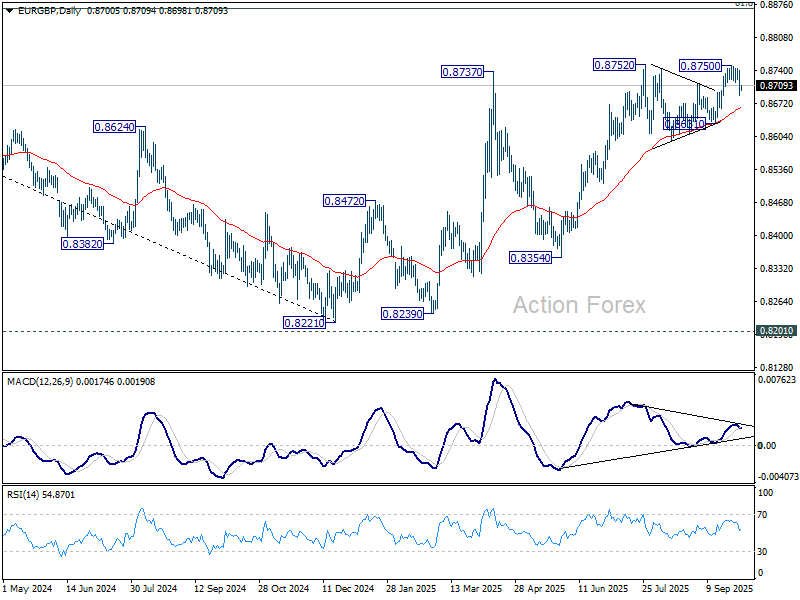
EUR/GBP recovered quickly after breaching 0.8694 support and intraday bias stays neutral first. On the upside, firm break of 0.8750 will resume larger rise to 0.8867 fibonacci level. However, decisive break of 0.8694 will turn bias back to the downside for 0.8631 support. Firm break there will indicate near term bearish reversal.
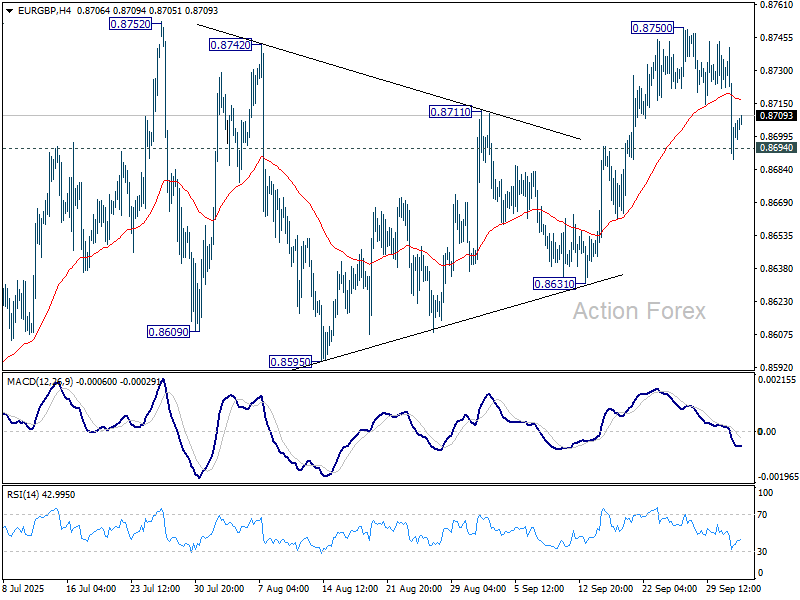
In the bigger picture, the structure from 0.8221 medium term bottom are not impulsive enough to suggest that it's reversing the down trend from 0.9267 (2022 high). But even if it's a correction, further rise could still be seen to 61.8% retracement of 0.9267 to 0.8221 at 0.8867. Nevertheless, sustained trading below 55 W EMA (now at 0.8533) will argue that the pattern has completed and bring retest of 0.8221 low.
Wall Street Hits Records Despite Shutdown, Yen Strength Continues
The ongoing US government shutdown has done little to rattle investor sentiment so far. Wall Street shrugged off the impasse, with the S&P 500 closing at a fresh record high overnight while DOW and NASDAQ also advanced. In Asia, risk appetite carried through as Hong Kong surged on its return from holiday and Japan’s Nikkei once again tested the 45,000 handle.
Despite the upbeat mood, political deadlock in Washington shows no sign of resolution. With the Senate out of session today for Yom Kippur, the shutdown will stretch at least three days. The longer the standoff drags on, the greater the risk that Friday’s highly anticipated nonfarm payrolls report will be delayed, leaving ISM Services as the only key US release left this week.
In currency markets, Yen remains the strongest performer, underpinned by rising speculation that the BoJ could deliver a rate hike as early as this month. The resilience of recent business surveys has emboldened hawks on the policy board, keeping traders positioned for a potential move. Commodity currencies are also benefitting from the regional risk-on tone, with Aussie and Kiwi advancing in tandem with equities.
In contrast, Swiss Franc lags at the bottom of the performance table. Today’s CPI print is expected to remain firm enough to support the SNB’s decision to hold rates at 0.00%, reinforcing its reluctance to return to negative policy settings. The Loonie is also soft, with Dollar only slightly stronger, leaving both near the bottom of the pack. Euro and Sterling are mid-range, though the Pound maintains an edge on expectations that UK fiscal policy adjustments could provide support ahead of the November budget.
In Asia at the time of writing, Nikkei is up 1.17%. Hong Kong HSI is up 1.65%. China is still on holiday. Singapore Strait Times is up 1.70%. Japan 10-year JGB yield is up 0.006 at 1.659. Overnight, DOW rose 0.09%. S&P 500 rose 0.34%. NASDAQ rose 0.42%. 10-year yield yield fell -0.042 to 4.106.
EUR/JPY, CHF/JPY pressing key EMA support, at risk of larger-scale corrections
The selloff in EUR/JPY and CHF/JPY has intensified since Monday, with both pairs now testing key moving averages. Sustained breaks here would strengthen the case that the cross rates have entered a larger-scale correction after months of relentless gains.
The latest push lower came after the pullback in US yields, triggered by disappointing ADP data overnight that showed private payrolls contracting for a second straight month. Markets took this as another sign of labor market weakness and quickly ramped up bets on Fed easing.
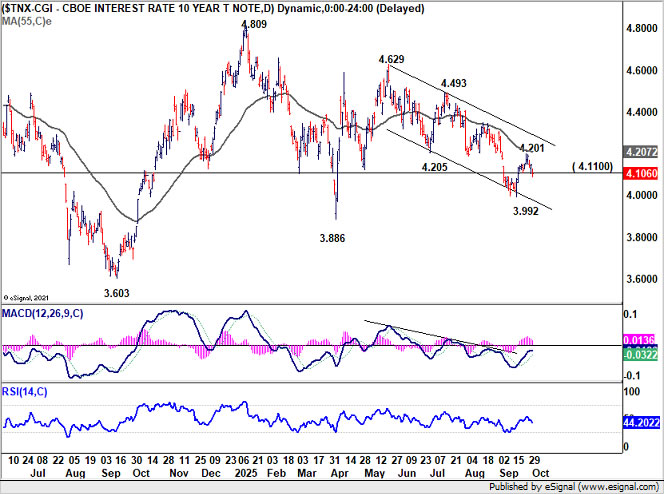
Futures now price in close to a 90% probability of two additional Fed cuts this year. US 10-year yield fell through near-term support at 4.110, suggesting the rebound from 3.992 had already peaked at 4.201, shy of 55 D EMA (now at 4.207).
The bigger moves in yield might only come when nonfarm payrolls are released to validate the bleak picture. Still, yields are likely to stay soft until then.
At the same time, expectations for BoJ tightening are gaining ground. Odds of an October 30 rate hike have risen to around 40%, reflecting growing conviction that policymakers may move sooner than previously expected.
That pivot was the recent hawkish rhetoric from policymakers. In particular, board member Asahi Noguchi, long viewed as a dove, said earlier this week that the need for policy tightening is “increasing more than ever.” His remarks were echoed by the Summary of Opinions from September’s meeting. And the resilient quarterly Tankan survey should have cleared some worries of doves regarding tariff impacts too.
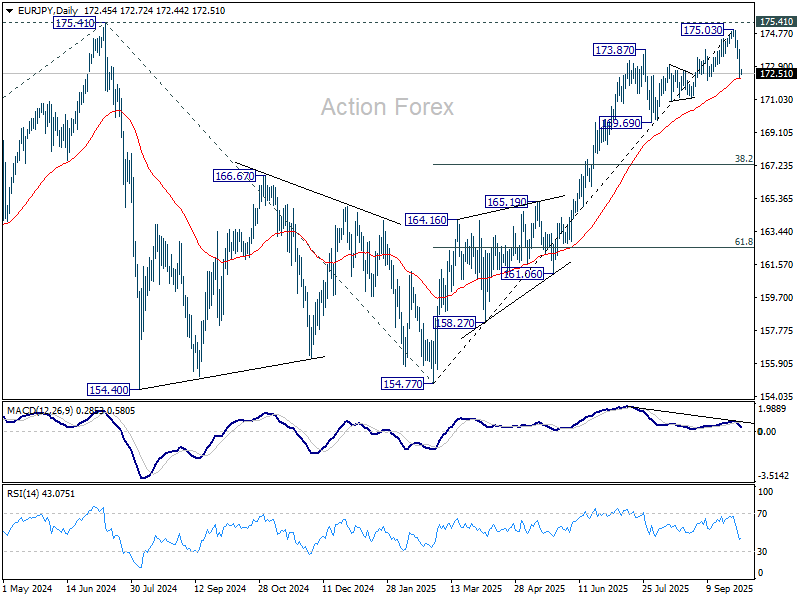
Technically, considering bearish divergence condition in D MACD in EUR/JPY, sustained break of 55 D EMA (now at 172.20) should confirm medium term topping at 175.03, just ahead of 175.41 (2024 high). EUR/JPY should then be in corrective to the five-wave rally from 154.77. Deeper fall should be seen to 169.69 support, or even further to 38.2% retracement of 154.77 to 175.03 at 167.29.
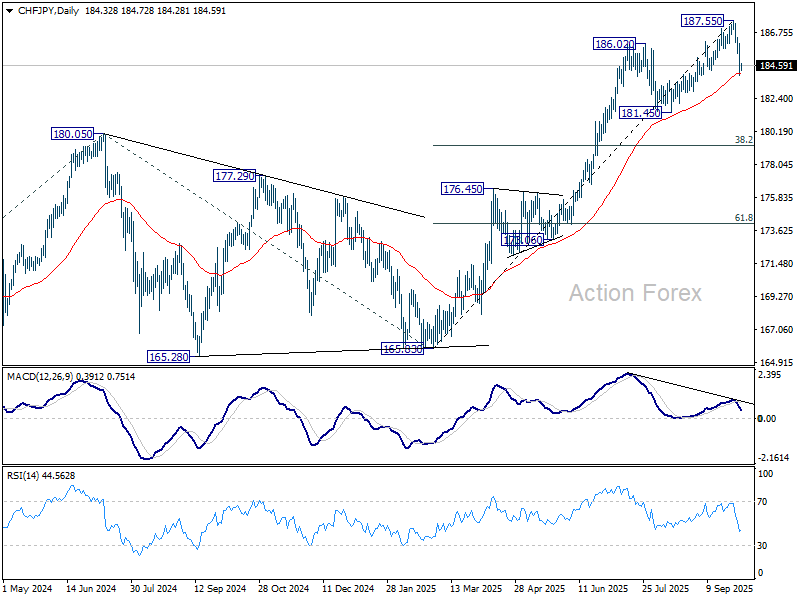
Similarly for CHF/JPY, decisive break of 55 D EMA (now at 184.06) should confirm medium term topping at 187.55, on bearish divergence condition in D MACD. CHF/JPY should then be correcting whole five-wave rally from 165.83, and target 181.45 support, or further to 38.2% retracement of 165.83 to 187.55 at 179.25.
BoC sees weaker economy, eased inflation pressures in September cut
The BoC’s September summary showed policymakers debated whether to hold the policy rate at 2.75% or lower it by 25bps. In the end, members judged that the balance of risks had shifted enough to warrant a cut to 2.50%, citing weaker economic conditions and softer inflation pressures.
Council members noted three key developments since July that supported easing. First, the economy had weakened further, with signs of labor market softening. Second, recent inflation readings suggested that core price pressures were easing. Third, the removal of most retaliatory tariffs reduced the risk of renewed upside pressure on prices.
Against this backdrop, the Governing Council concluded that “inflationary pressures appeared more contained” and that a lower policy rate would better balance risks. They emphasized that uncertainty remains high, meaning decisions will continue to be guided by a "risk-management approach". Policymakers agreed they would keep looking "over a shorter horizon than usual" and remain prepared to respond to new developments.
EUR/GBP Daily Outlook
Daily Pivots: (S1) 0.8682; (P) 0.8712; (R1) 0.8734; More...
EUR/GBP recovered quickly after breaching 0.8694 support and intraday bias stays neutral first. On the upside, firm break of 0.8750 will resume larger rise to 0.8867 fibonacci level. However, decisive break of 0.8694 will turn bias back to the downside for 0.8631 support. Firm break there will indicate near term bearish reversal.
In the bigger picture, the structure from 0.8221 medium term bottom are not impulsive enough to suggest that it's reversing the down trend from 0.9267 (2022 high). But even if it's a correction, further rise could still be seen to 61.8% retracement of 0.9267 to 0.8221 at 0.8867. Nevertheless, sustained trading below 55 W EMA (now at 0.8533) will argue that the pattern has completed and bring retest of 0.8221 low.
Ethereum Price Bounce – Will Rally Continue Or Fizzle Out At Hurdles?
Key Highlights
- Ethereum found support near $3,820 and started a decent upward move.
- ETH is approaching a contracting triangle with resistance near $4,500 on the daily chart.
- Bitcoin price rallied over 5% and cleared the $118,000 resistance.
- XRP is struggling to gain pace for a move above the $3.00 level.
Ethereum Technical Analysis
Ethereum dipped below $4,000 before the bulls appeared. ETH found support near $3,820, bounced higher, and surpassed $4,250.
Looking at the daily chart, the price surpassed the 38.2% Fib retracement level of the downward move from the $4,951 swing high to the $3,818 low. The current price action is positive, and the price is still well above the 100-day simple moving average (red).
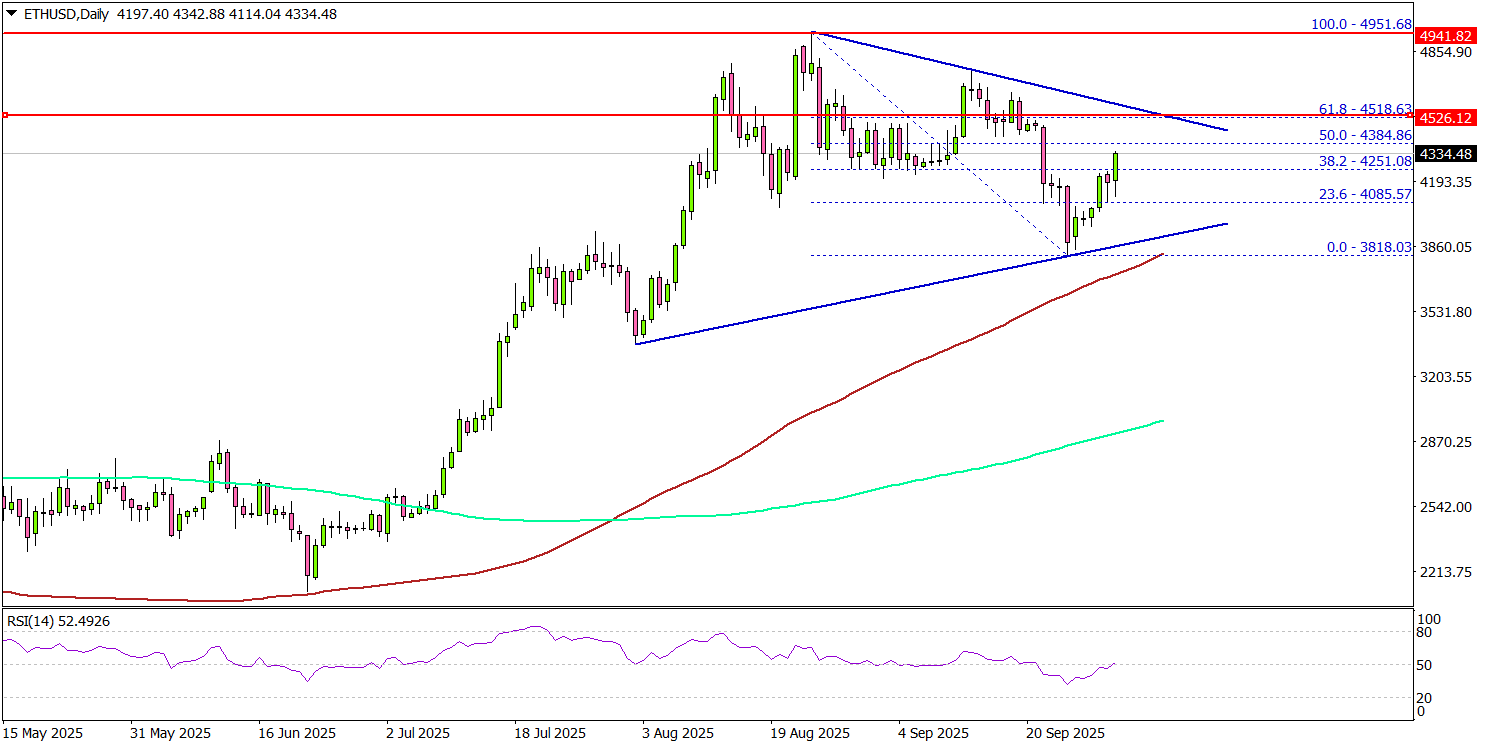
On the upside, the price is facing hurdles near the $4,420 level. The next major resistance is near the $4,500 level. There is also a key contracting triangle forming with resistance at $4,500 on the same chart. It coincides with the 61.8% Fib retracement.
A daily close above the $4,500 resistance zone could start another steady increase. In the stated case, the price may perhaps rise toward the $4,800 level. The next stop for the bulls may perhaps be $5,000.
On the downside, the bulls might be active near $4,080. The main support is now forming near $3,820 and the 100-day simple moving average (red), below which the price could slide toward $3,500. Any more losses might call for a move toward $3,250.
Looking at Bitcoin, there was a sharp upward move, and the bulls were able to clear the $115,500 and $116,500 resistance levels.
Economic Releases
- US Initial Jobless Claims - Forecast 223K, versus 218K previous.
EUR/JPY, CHF/JPY pressing key EMA support, at risk of larger-scale corrections
Following up on a previous comment, which may have been overlooked....
The selloff in EUR/JPY and CHF/JPY has intensified since Monday, with both pairs now testing key moving averages. Sustained breaks here would strengthen the case that the cross rates have entered a larger-scale correction after months of relentless gains.
The latest push lower came after the pullback in US yields, triggered by disappointing ADP data overnight that showed private payrolls contracting for a second straight month. Markets took this as another sign of labor market weakness and quickly ramped up bets on Fed easing.
Futures now price in close to a 90% probability of two additional Fed cuts this year. US 10-year yield fell through near-term support at 4.110, suggesting the rebound from 3.992 had already peaked at 4.201, shy of 55 D EMA (now at 4.207).
The bigger moves in yield might only come when nonfarm payrolls are released to validate the bleak picture. Still, yields are likely to stay soft until then.
At the same time, expectations for BoJ tightening are gaining ground. Odds of an October 30 rate hike have risen to around 40%, reflecting growing conviction that policymakers may move sooner than previously expected.
That pivot was the recent hawkish rhetoric from policymakers. In particular, board member Asahi Noguchi, long viewed as a dove, said earlier this week that the need for policy tightening is “increasing more than ever.” His remarks were echoed by the Summary of Opinions from September’s meeting. And the resilient quarterly Tankan survey should have cleared some worries of doves regarding tariff impacts too.
Technically, considering bearish divergence condition in D MACD in EUR/JPY, sustained break of 55 D EMA (now at 172.20) should confirm medium term topping at 175.03, just ahead of 175.41 (2024 high). EUR/JPY should then be in corrective to the five-wave rally from 154.77. Deeper fall should be seen to 169.69 support, or even further to 38.2% retracement of 154.77 to 175.03 at 167.29.
Similarly for CHF/JPY, decisive break of 55 D EMA (now at 184.06) should confirm medium term topping at 187.55, on bearish divergence condition in D MACD. CHF/JPY should then be correcting whole five-wave rally from 165.83, and target 181.45 support, or further to 38.2% retracement of 165.83 to 187.55 at 179.25.
BoC sees weaker economy, eased inflation pressures in September cut
The BoC’s September summary showed policymakers debated whether to hold the policy rate at 2.75% or lower it by 25bps. In the end, members judged that the balance of risks had shifted enough to warrant a cut to 2.50%, citing weaker economic conditions and softer inflation pressures.
Council members noted three key developments since July that supported easing. First, the economy had weakened further, with signs of labor market softening. Second, recent inflation readings suggested that core price pressures were easing. Third, the removal of most retaliatory tariffs reduced the risk of renewed upside pressure on prices.
Against this backdrop, the Governing Council concluded that “inflationary pressures appeared more contained” and that a lower policy rate would better balance risks. They emphasized that uncertainty remains high, meaning decisions will continue to be guided by a "risk-management approach". Policymakers agreed they would keep looking "over a shorter horizon than usual" and remain prepared to respond to new developments.
EURJPY Wave Analysis
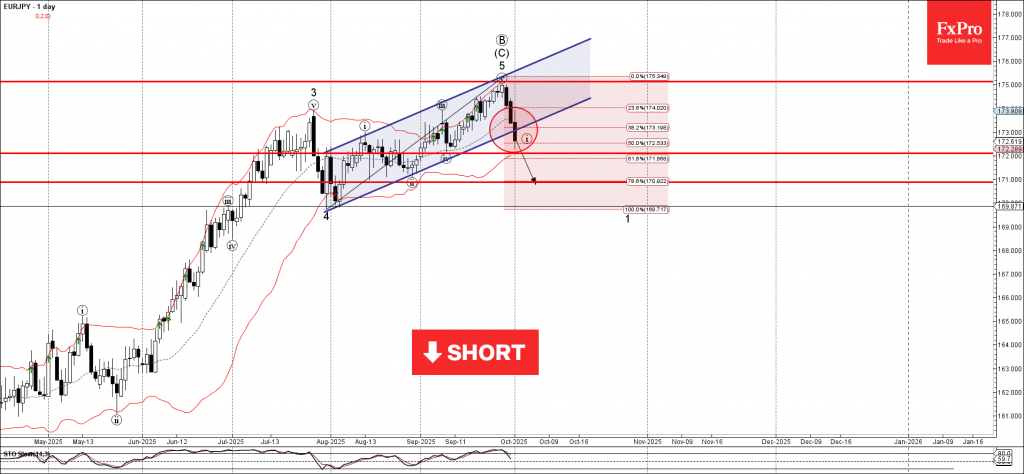
EURJPY: ⬇️ Sell
- EURJPY broke support zone
- Likely to fall to support levels 172.00 and 171.00
EURJPY currency pair recently broke the support zone between the support level 172.00 (which stopped earlier wave iv), support trendline of the daily up channel from July and the 38.2% Fibonacci correction of the upward impulse from July.
The breakout of this support zone accelerated the active short-term impulse wave i of the intermediate impulse wave (1) from the end of September.
Given the strongly bullish yen sentiment seen today, EURJPY currency pair can be expected to fall to the next support levels 172.00 and 171.00.
Bitcoin Wave Analysis
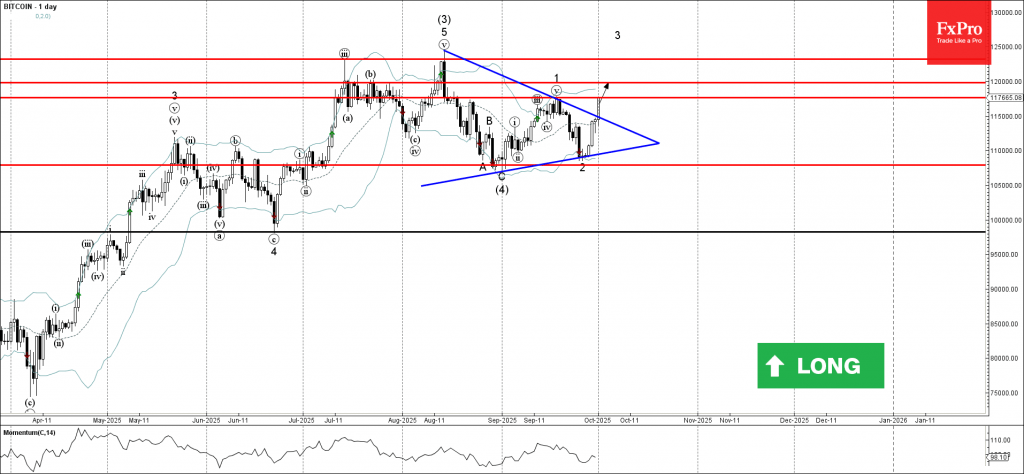
Bitcoin: ⬆️ Buy
- Bitcoin broke daily Triangle
- Likely to rise to resistance level 120000.00
Bitcoin cryptocurrency continues to rise strongly after the earlier breakout of the daily Triangle from the start of August.
The breakout of this Triangle accelerated the active short-term impulse wave 3 of the intermediate impulse wave (5) from the end of August.
Given the strong daily uptrend, Bitcoin cryptocurrency can be expected to rise to the next round resistance level 120000.00 – provided it breaks above the nearby resistance level 117570.00.