Sample Category Title
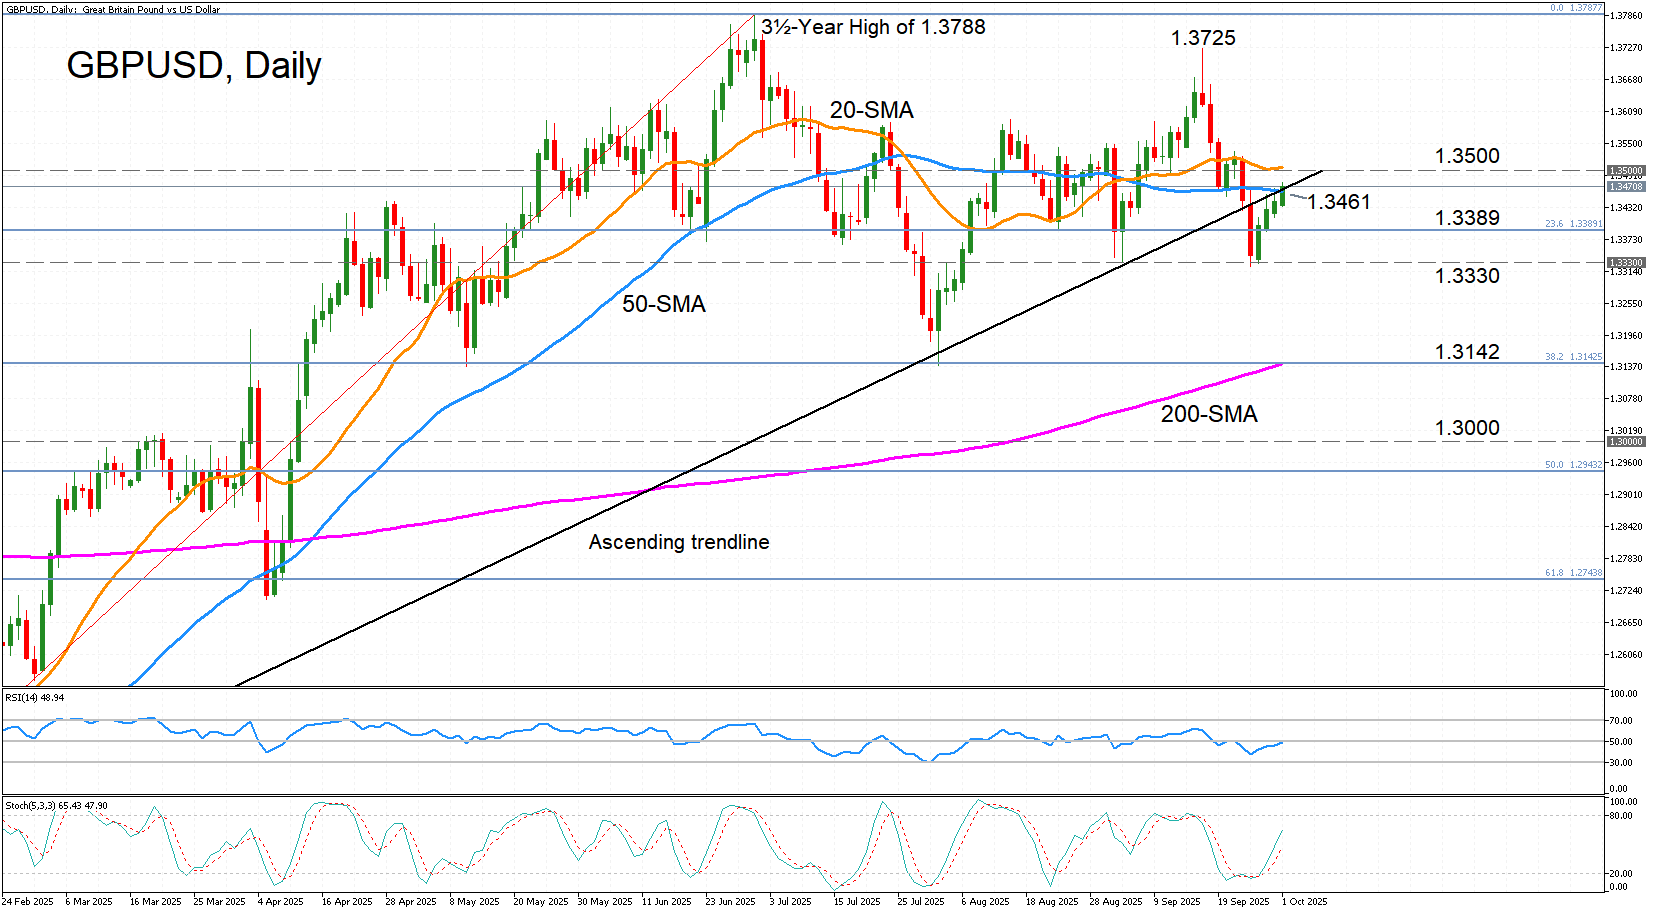
GBP/USD Tests Uptrend Line but obstacles ahead
- GBP/USD turns bullish in short term.
- But further gains might be capped by key resistance barriers.
GBPUSD is climbing for a fourth straight day on Wednesday, but the gains have been limited, adding just 1% from last Thursday’s lows. Broader dollar softness has helped cable to bounce higher but worries about the forthcoming UK budget and whether it will tackle Britain’s worsening debt problem are keeping the bulls in check.
Nevertheless, there’s been a notable shift in the near-term bias from bearish to bullish. The RSI is rising towards 50 but is at risk of losing steam even before crossing into bullish territory. The stochastics, on the other hand, are up sharply, pointing to a strong positive momentum.
However, it remains to be seen if the upside momentum is sufficient to push GBPUSD above the ascending trendline taken from the January trough, and more importantly, above the 50-day simple moving average (SMA) at 1.3461. Breaking above this area would bring into range the 1.3500 handle, although the overlapping 20-day SMA could make it difficult for the bulls to pierce through it. Clearing this hurdle, though, would add traction to the rebound, potentially extending it all the way until the September high of 1.3725.
To the downside, there is immediate support at the 23.6% Fibonacci retracement of the January-July uptrend at 1.3389. If breached, the 1.3330 level, which twice halted the slides in September, could be tested again. Lower down, the focus would turn to the 38.2% Fibonacci of 1.3142, which corresponds with the August trough, as well as the 200-day SMA.
To sum up, GBPUSD is attempting to get back on the north side of the ascending trendline but it’s unclear if there’s enough impetus for a convincing break higher.
Solid Tankan Adding to the Case for BoJ to Resume Rate Hikes Later This Month
Markets
EMU and US bond markets were some kind of paralyzed yesterday. Data were too close to consensus to unsettle market expectations on monetary policy. At the same time investors kept cautious at the final day of the quarter while at the same time looking forward to upcoming political and/or data-event risk. German yields changed less than 1 bp across the curve. National CPI data were mixed with softer-than-expected French inflation being countered by slightly higher-than-expected releases in Germany, Italy and Spain (on Monday). This puts the risk for today’s (Flash) EMU CPI slightly to the upside. Even so, it doesn’t change the prolonged wait-and-see modus for ECB policy. US yields eased 1-2 bps across the curve. JOLTS job openings printed marginally stronger than expected and other details of the series at least didn’t suggest a rapid deterioration in US labour market conditions. At the same time, US consumer confidence eroded further (94.2 from 97.8). The looming US government shutdown had only marginal impact, if any at all, as there is currently no debate on the debt ceiling/debt payments. US equities traded with a positive bias (S&P 500 +0.41%, close less than 0.2% from all-time record). The dollar lost modest ground (DXY close 97.78, EUR/USD 1.1734 & USD/JPY 147.9). All these cross rate are holding firmly with the established ranges).
Asian (equity) markets trade mixed this morning. Japanese markets underperform as a solid BoJ Tankan report supports the case for further BoJ easing later this month (cf infra). Most other markets are trading in green. The US government shutdown in the meantime is a fact. Markets in the first place are focused on a delayed release of key data (including Friday’s payrolls). At the same time, question is to what extent it will undermine growth going forward. In a first reaction, the dollar is ceding further ground. USD/JPY currently trades near 147.55. EUR/USD gains to the 1.175 area. If anything, a long shutdown, might weigh on US real yields and in this respect might also be a slightly negative for the dollar. Regarding regular data, the eco calendar today contains the flash EMU CPI data (headline expected at 0.1% M/M and 2.2% Y/Y from 2%, core unchanged at 2.3%). In the US, the ADP private job growth (+ 51k from 54k expected) and the US manufacturing ISM (49 from 48.7 expected) take center stage. With some uncertainty on the government shutdown lingering, we hold the view that markets (yields, dollar) might be a bit more sensitive to negative rather than to positive surprises.
News & Views
A solid Tankan survey for the third quarter in Japan is adding to the case for the Bank of Japan to resume rate hikes later this month. Large manufacturers are more upbeat with the index rising from 13 to 14. The forward-looking gauge matched Q2’s 12, suggesting they are largely shrugging off tariff-related uncertainty and pressure. The non-manufacturing sector was as optimistic as they have been in recent quarters with business conditions (34) seen most favourable in around 34 years. Their outlook (28) improved to similar historic levels. Capex spending across all industries in the fiscal year from April would climb to 12.5% from 11.5%, more than the 11.3% expected. Japanese businesses see inflation at 2.4% in five years. That’s above the central bank’s 2% target and an acceleration from Q2’s 2.3%. This price gauge is closely watched by the Bank of Japan. The Japanese yen barely budged on the release but later strengthened a tad against an overall weaker US dollar. USD/JPY trades around 147.6. Japanese (money) markets are now on the lookout for potentially important speeches by BoJ deputy governor Uchida and governor Ueda tomorrow and on Friday and LDP chair (and therefore PM) elections this weekend.
The Indian central bank (Reserve Bank of India, RBI) left its benchmark rate unchanged at 5.5% this morning. The unanimous decision and the bank’s current neutral stance was accompanied by language that kept all options open. Governor Malhotra said that there is policy space for further supporting growth but warned that (earlier) front-loaded monetary policy actions and fiscal measures are still playing out while trade-related uncertainty is still abound. The most prudent choice was for the central bank to wait for the impact to unfold. The RBI raised its growth forecast for the FY ending March 2026 to 6.8% from 6.5% while downgrading the inflation projection to 2.6% from 3.1%. The Indian rupee steadied near the record lows of USD/INR 88.71.
EUR/USD Daily Outlook
Daily Pivots: (S1) 1.1709; (P) 1.1736; (R1) 1.1759; More...
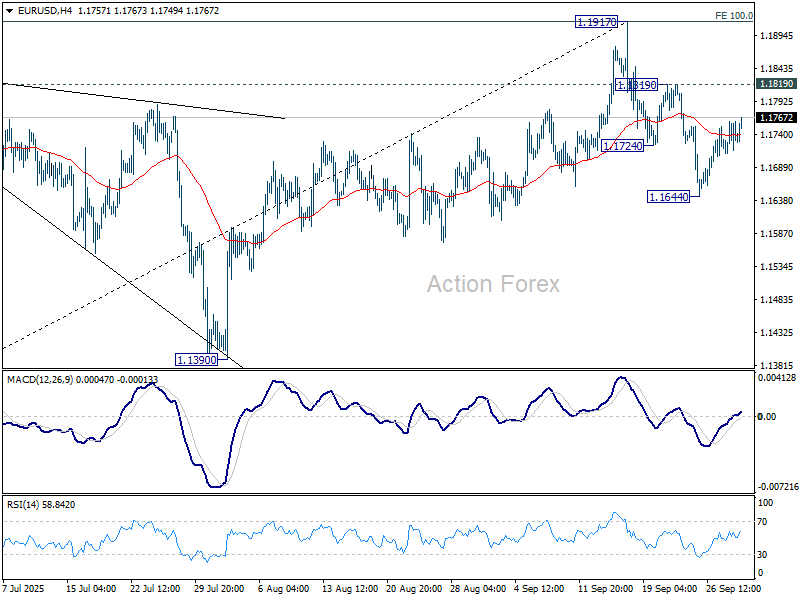
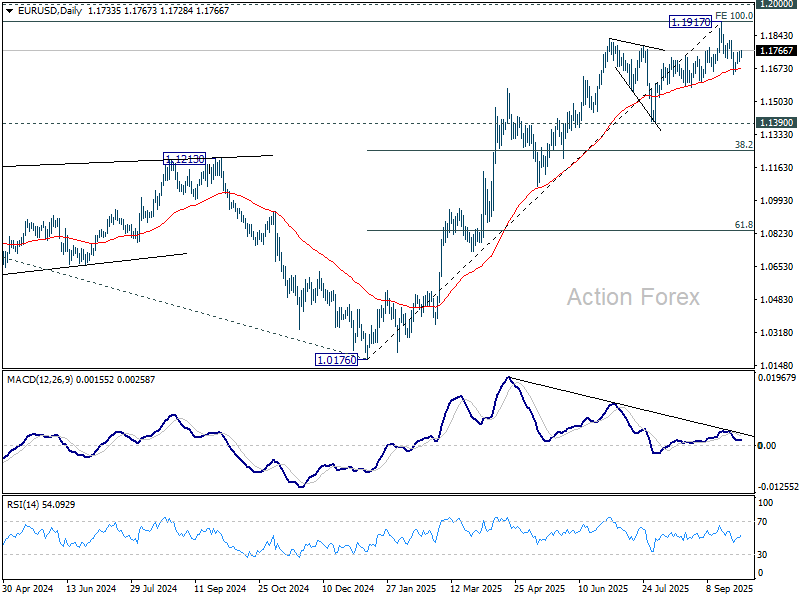
Outlook in EUR/USD is unchanged and intraday bias stays neutral. Further fall is expected as long as 1.1819 resistance holds. Considering bearish divergence condition in D MACD, sustained trading below 55 D EMA (now at 1.1675) will argue that 1.1917 was already a medium term top. Deeper fall should then be seen to 1.1390 support next.
In the bigger picture, rise from 1.0176 (2025 low) is seen as the third leg of the pattern from 0.9534 (2022 low). 100% projection of 0.9534 to 1.1274 from 1.0176 at 1.1916 was already met. For now, further rally will remain in favor as long as 1.1390 support holds, and firm break of 1.2000 psychological level will carry larger bullish implications. However, firm break of 1.1390 will suggest that rise from 1.0176 has already completed and bring deeper fall to 55 W EMA (now at 1.1231).
USD/JPY Daily Outlook
Daily Pivots: (S1) 147.44; (P) 148.15; (R1) 148.64; More...
USD/JPY's break of 147.45 dampens the original bullish view, and suggests that rebound from 145.47 has completed at 149.95. Intraday bias is back on the downside for 145.47, as the pattern from 150.90 extends. On the upside, above 148.21 minor resistance will turn intraday bias neutral again first.
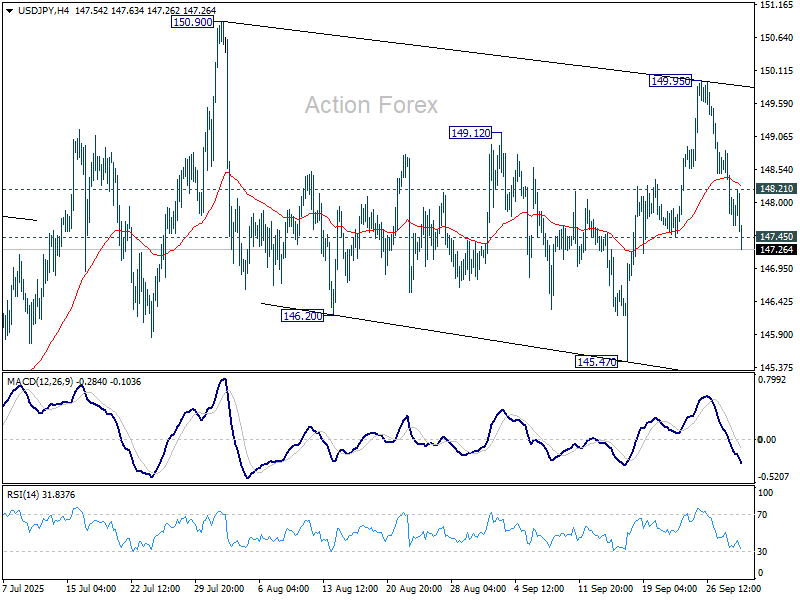
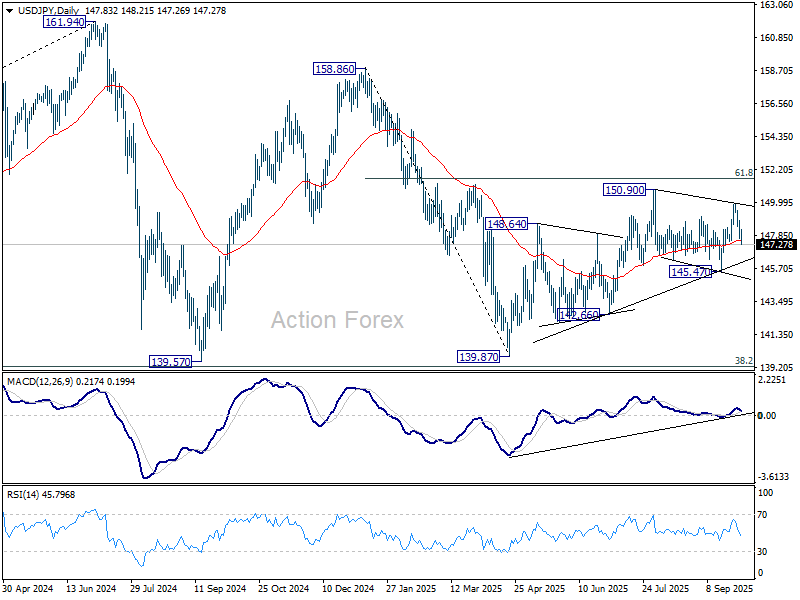
In the bigger picture, price actions from 161.94 (2024 high) are seen as a corrective pattern to rise from 102.58 (2021 low). Decisive break of 61.8% retracement of 158.86 to 139.87 at 151.22 will argue that it has already completed with three waves at 139.87. Larger up trend might then be ready to resume through 161.94 high. In case the corrective pattern extends with another fall, strong support is expected from 38.2% retracement of 102.58 to 161.94 at 139.26 to bring rebound.
GBP/USD Daily Outlook
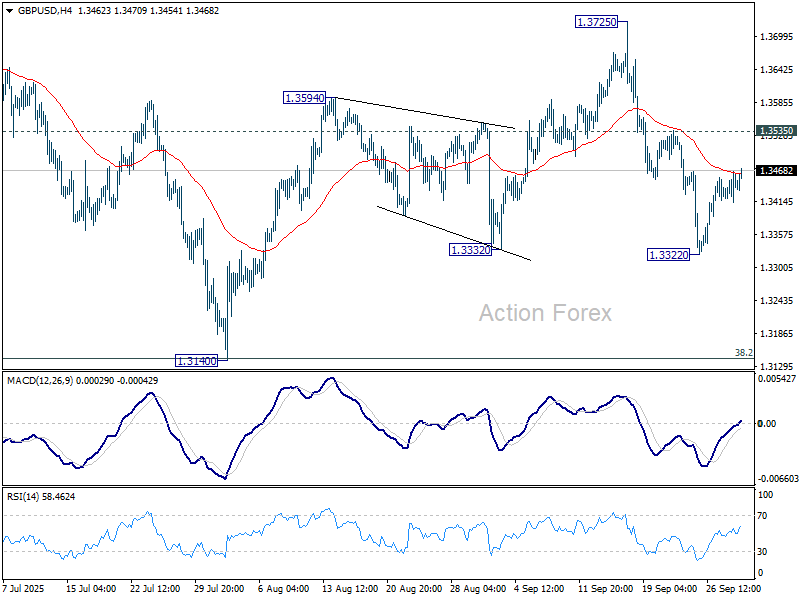
Daily Pivots: (S1) 1.3418; (P) 1.3442; (R1) 1.3471; More...
Outlook in GBP/USD is unchanged and intraday bias remains neutral. Further decline is expected as long as 1.3535 resistance holds. Break of 1.3322 will resume the fall from 1.3725, as the third leg of the corrective pattern from 1.3787, and target 1.3140 support.
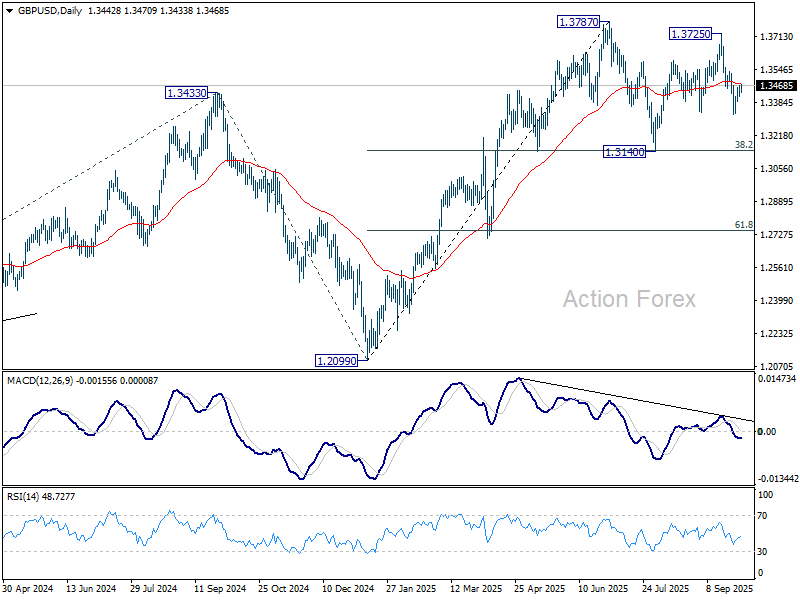
In the bigger picture, rise from 1.0351 (2022 low) is still seen as a corrective move. Further rally could be seen to 61.8% projection of 1.0351 to 1.3433 (2024 high) from 1.2099 (2025 low) at 1.4004. But strong resistance could be seen from 1.4248 (2021 high) to limit upside. Sustained break of 55 W EMA (now at 1.3155) will argue that a medium term top has already formed and bring deeper fall back to 1.2099.
USD/CHF Daily Outlook
Daily Pivots: (S1) 0.7941; (P) 0.7963; (R1) 0.7988; More…
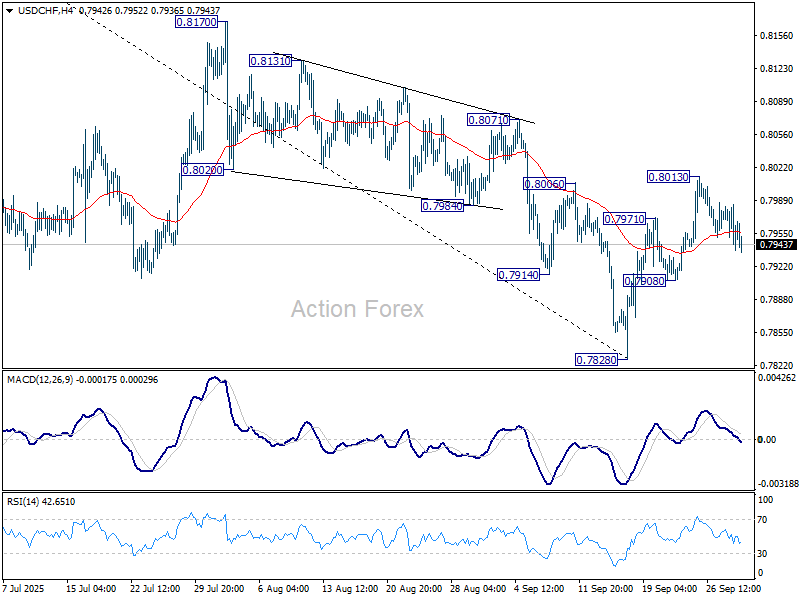
Intraday bias in USD/CHF stays neutral and outlook is unchanged. On the upside, sustained trading above 55 D EMA (now at 0.8014) will suggest that rise from 0.7828 is already correcting whole fall from 0.9200. Further rise should the be seen to 0.8170 resistance and possibly above. However, break of 0.7908 will turn bias back to the downside for retesting 0.7828 low.
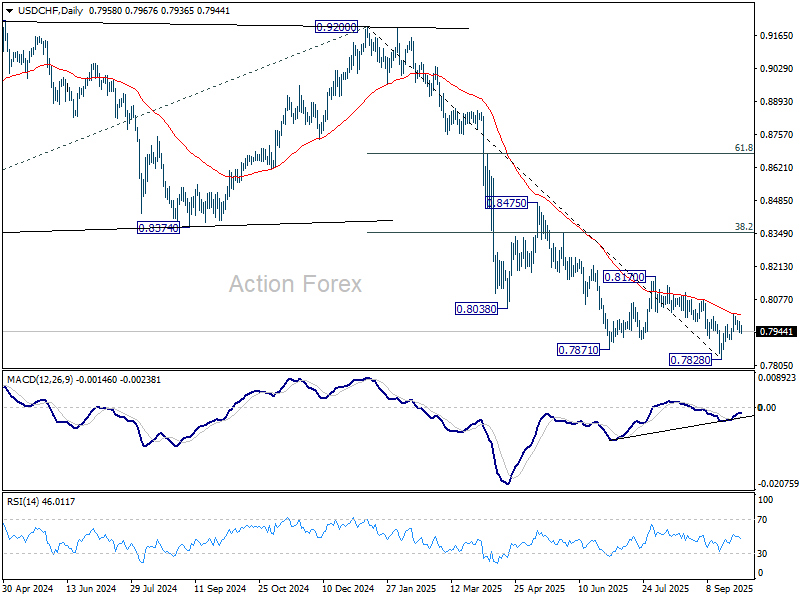
In the bigger picture, long term down trend from 1.0342 (2017 high) is still in progress. Next target is 100% projection of 1.0146 (2022 high) to 0.8332 from 0.9200 at 0.7382. In any case, outlook will stay bearish as long as 0.8332 support turned resistance holds (2023 low).
US Shutdown Pressures Dollar, Adds Shine to Gold
The US government has shut down from today as politicians failed to agree on a plan to continue funding it. This is not the first time this has happened, and it certainly won’t be the last. Since 1976, there have been around 20 government shutdowns, caused by funding gaps lasting at least one business day. The average duration is about 8 days. Most shutdowns last only a few days, and only a handful stretched over multiple weeks. The longest in recent history was a partial shutdown that lasted 35 days between December 2018 and January 2019.
The market impact of shutdowns is not necessarily dramatic — far from it. For bonds, the flight to safety usually benefits US Treasuries, and since the government continues servicing its debt during shutdowns, the overall impact is limited, slightly positive. That’s what we see this morning, with the US 10-year yield edging lower on shutdown headlines.
On the currency front, the US dollar tends to weaken when the government shuts down. Limited dollar appetite and a softer DXY come as no surprise today. The yen and Swiss franc are attracting safe-haven flows, the EURUSD looks set to test the 1.18 area and could clear resistance if the shutdown drags on, while Cable could push back above 1.35 despite ongoing UK political noise.
For equities, the impact of a government shutdown could be positive. In fact, the S&P500 gained during three of the last four government shutdowns, and it gained more than 10% during the 2018-2019 shutdown that also coincided with a Federal Reserve pivot.
Shutdown news is weighing on US futures this morning, but they’re not the end of the world. The most inconvenient impact will be delays to economic data — and this week, that includes the all-important jobs report.
Speaking of data: yesterday’s JOLTS figures came in stronger than expected, with last month’s number revised slightly higher. That said, job openings are now at their lowest since 2021 and weaker-than-expected consumer confidence and a sharper contraction in Chicago PMI released yesterday also supported the dovish Fed outlook. The US 2-year yield has fallen for a fourth straight session.
Today, ADP — a private data provider unaffected by the shutdown — will publish its September jobs report. It is expected to show a soft gain of around 50K jobs. Even if Friday’s official payrolls are delayed, JOLTS plus ADP could still give investors a decent picture of labour market momentum and keep Fed expectations intact. A weaker ADP reading would reinforce the dovish view, pushing US yields and the dollar lower while supporting equities. A stronger print could temper those expectations, but only a very robust figure in the 150–200K range would seriously challenge the market’s assumption of upcoming cuts — and that seems unlikely given recent labour trends. As such, the more probable scenario is continued softness in US jobs data, keeping downward pressure on the dollar.
The weaker Dollar has already been a boon for precious metals. Gold and silver remain heavily in demand, with both seen as overbought but still attracting inflows. Add in the US-China trade tensions, broader geopolitical risks, waning appetite for USD and Treasuries, and now the shutdown, and the bullish case for gold remains strong. Historical patterns and technical signals also back that view.
On top of that, China has been gradually positioning the yuan and Gold as alternatives to the US Dollar. Reports suggest Beijing encourages trade partners to convert surpluses into gold stored in Shanghai. If even 80% of China’s trade surplus were converted, it could require 15–20% of annual global gold output — creating a powerful tailwind for prices. The bigger the surplus, the stronger the demand, and the higher the support for gold.
No surprise then that gold has attracted massive inflows this year, with appetite remaining strong even at record highs — and gold miners are reaping the benefits. Fresnillo in London, for example, has seen its share price surge more than 300% since January, compared with about 110% for Nvidia since its April low.
In the same vein, Zijin Gold International made a spectacular debut in Hong Kong this week, marking the city’s second-largest IPO of the year. The stock soared 68% on day one, giving the company a market cap above HK$300 billion (nearly US$40 billion) — performance more typical of a hot tech IPO than a miner. Whether the gold rush continues is an open question, but for now, the arguments in favour of further gains outweigh the risks to the downside.
US Government Shuts Down as Political Gridlocks Deepens
In focus today
In the euro area, focus turns to the September inflation report. We expect euro area inflation to increase to 2.2% y/y from 2.0% y/y. While inflation in some countries, like France and Spain, came in lower than expected, other countries such as Germany and Italy exceeded expectations. These opposing surprises have balanced each other out, leaving the overall inflation rate on track to align with prior consensus expectations. We also receive the final euro area manufacturing PMI. The flash manufacturing PMI declined to 49.5 from 50.7 following the great improvement in 2025. We expect the final data to confirm the flash release.
From the US, ADP's September private sector employment report will provide markets with the first sense of what to expect from Friday's key nonfarm payrolls release. ISM manufacturing index is also due for release for September.
Economic and market news
What happened overnight
In the US, the government shut down at 06:00 CET as deep partisan divisions have prevented Congress and the White House from reaching a funding agreement. The direct macroeconomic impact is expected to be limited, but markets are likely to focus on two key implications: potential delays in the publication of US economic data, particularly the September NFP employment report, and the potential layoffs of public sector workers as highlighted by the White House. While these factors may not significantly alter the macroeconomic outlook, they could, all else being equal, modestly increase the likelihood of the Fed considering a rate cut in October.
In Japan, The Q3 Tankan business survey came in close to expectations with the main index for large manufacturers improving a bit to index 14. It has been quite stable for two years. The non-manufacturing index was unchanged at 34, which is close to the highest post-1991 levels. The outlook indices are a bit less rosy but still solid and with businesses' 5Y inflation expectations edging a bit higher to 2.4%, the updated Tankan survey should not stand in the way of a rate hike at the BoJ's policy meeting at the end of the month. About 10bp are priced in for now.
What happened yesterday
In the euro area, September inflation data from key countries suggest headline inflation is likely to track at 2.2% y/y, aligning with consensus as country-level surprises balance out. Headline inflation came in lower than expected in France at 1.1% y/y, while it exceeded expectations in Italy and Germany at 1.8% y/y and 2.4% y/y, respectively. Services inflation remained a consistent driver across the region, with uneven monthly trends in energy and food prices. Core inflation momentum was stable, indicating limited underlying pressures. The data reinforce the expectation that the ECB will maintain a cautious stance, monitoring further developments before reassessing its outlook.
In the US, August JOLTs job openings data landed close to expectations (7.23M, July 7.18M). Hiring slowed down, but so did involuntary layoffs, suggesting that overall labour market conditions remain broadly stable. Similarly, the ratio of job openings to the number of unemployed jobseekers remains little changed from July at 0.98 (from 0.996).
In Sweden, retail sales increased by 0.9% m/m and 4.4% y/y, driven by a 1.9% increase in durable goods, while consumables (excluding Systembolaget) remained flat. The data reflects the positive trend in retail sales and supports our forecast of gradually growing consumption.
Equities: Global equities were largely unimpressed by the decent JOLTS report yesterday, while also factoring in the weaker-than-expected Conference Board data and the looming deadline for a US government shutdown, which ultimately transpired. The US equity indices staged a late rally in the final half hour of the trading session for the quarter. The S&P500 ended 0.4% higher yesterday, while the Nasdaq rose 0.3%. Compared to the start of the quarter, both the S&P and Nasdaq have returned 8%. The comparable return was 3% for the Stoxx 600.
FI and FX: EUR/USD continues to trade around the 1.1750 mark, while SEK and NOK have been off to a week start to the week. US yields continued to drift lower during yesterday's session, particularly in the front-end with the 2-year US Treasury yield 5-6bp lower. While yesterday's JOLTS data was relatively solid, markets focused more on the softer-than-expected Conference Board consumer confidence print. Focus now turns to the first shutdown of the US government in seven years after Republicans and Democrats failed to strike an agreement to fund the federal government into the new fiscal year. On data releases, we look out for ISM manufacturing and the ADP employment report. In the euro area, yields were little changed. Regional inflation data painted a mixed picture, with Germany surprising to the upside while Spain and France came in softer. With 82% of the euro area HICP basket now released, we track today's euro area headline at 2.2% y/y, broadly in line with consensus, as opposing surprises largely offset each other.
AUD/USD Daily Report
Daily Pivots: (S1) 0.6580; (P) 0.6604; (R1) 0.6638; More...
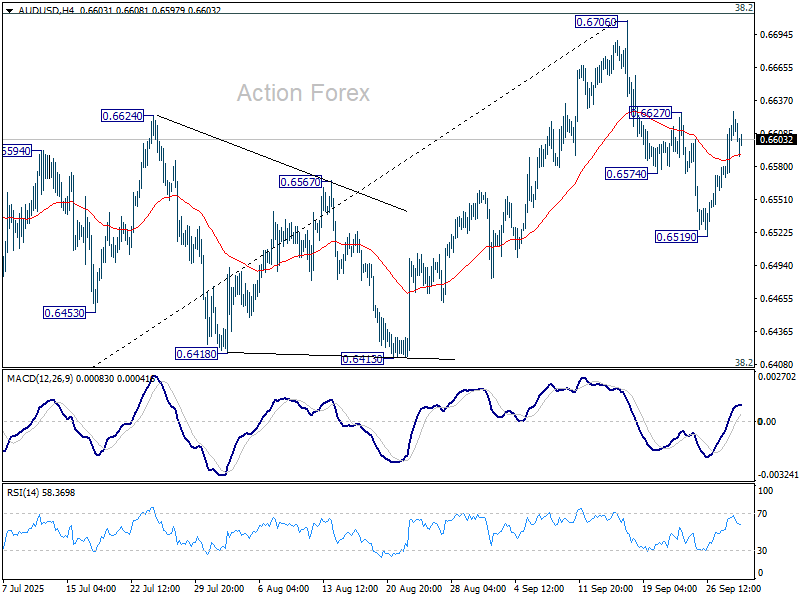
AUD/USD retreated after touching 0.6627 resistance and intraday bias stays neutral. Firm break of 0.6627 will suggest that pullback from 0.6706 has completed as correction, after drawing support from 55 D EMA (now at 0.6550). That will keep the larger rally from 0.5913 alive and bring retest of 0.6706 high. However, on the downside, sustained trading below 55 D EMA will confirm rejection by 0.6713 fibonacci resistance, and bring deeper fall to 0.6413 cluster support (38.2% retracement of 0.5913 to 0.6706 at 0.6403).
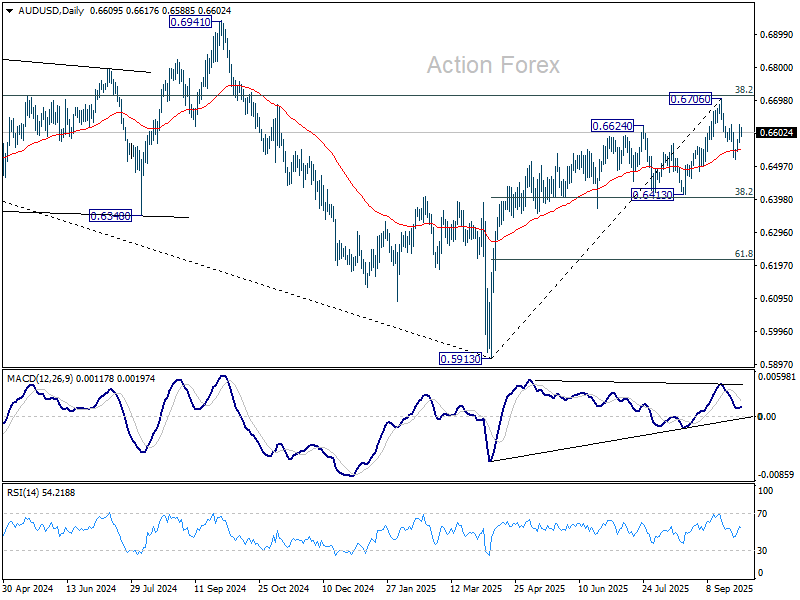
In the bigger picture, there is no clear sign that down trend from 0.8006 (2021 high) has completed. Rebound from 0.5913 is seen as a corrective move. Outlook will remain bearish as long as 38.2% retracement of 0.8006 to 0.5913 at 0.6713 holds. Nevertheless, considering bullish convergence condition in W MACD, sustained break of 0.6713 will be a strong sign of bullish trend reversal, and pave the way to 0.6941 structural resistance for confirmation.
USD/CAD Daily Outlook
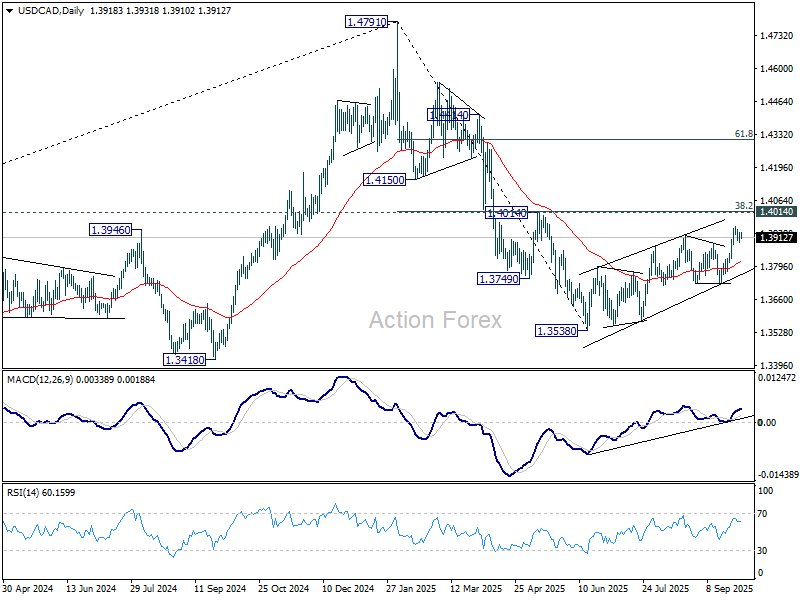
Daily Pivots: (S1) 1.3900; (P) 1.3918; (R1) 1.3939; More...
USD/CAD is staying in consolidations below 1.3957 temporary top and intraday bias remains neutral. On the upside, break of 1.3957 will resume the corrective rebound from 1.3538. But upside should be limited by 1.4014 cluster resistance to bring reversal. Meanwhile, sustained trading below 55 4H EMA (now at 1.3880) will bring deeper fall back to 1.3725 support.
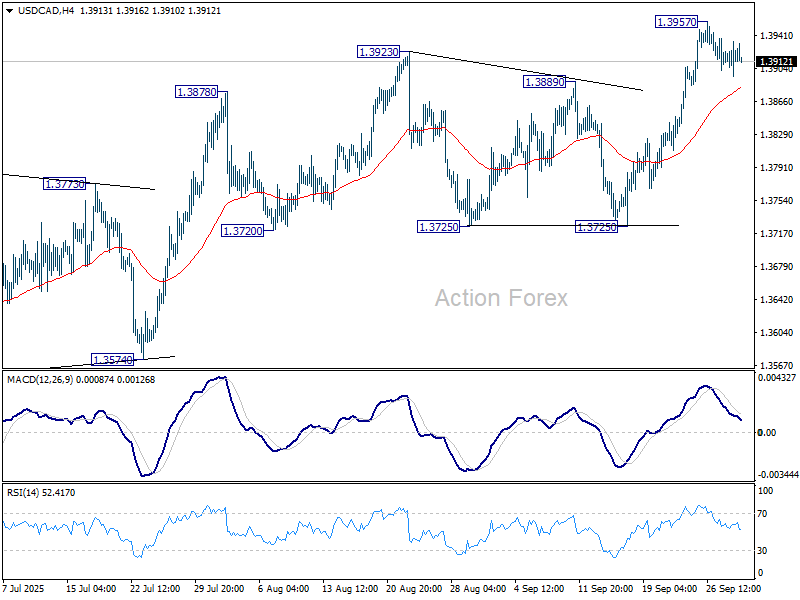
In the bigger picture, price actions from 1.4791 medium term top could either be a correction to rise from 1.2005 (2021 low), or trend reversal. In either case, further decline is expected as long as 1.4014 cluster resistance (38.2% retracement of 1.4791 to 1.3538 at 1.4017) holds. Next target is 61.8% retracement of 1.2005 (2021 low) to 1.4791 (2025 high) at 1.3069. However, sustained break of 1.4014 will argue that fall from 1.4791 has completed, and bring stronger rally to 61.8% retracement at 1.4312.