
Sample Category Title
Steady as She Goes
In focus today
Market focus will continue to be on the Russia-Ukraine conflict and the ongoing efforts to achieve a ceasefire.
Today is quiet in terms of data releases. However, in New Zealand, both markets and analysts anticipate the Reserve Bank (RBNZ) will continue its easing cycle with a 25bp rate cut early tomorrow morning, lowering the Official Cash Rate to 3.00%.
Economic and market news
What happened yesterday
In the US, President Trump met with Ukrainian President Zelenskiy in the White House discussing the war in Ukraine. Trump made multiple mentions of security guarantees and a possible trilateral meeting with Russian President Putin. However, following the meeting the Kremlin has yet to accept the proposal of a trilateral meeting. Nato secretary Mark Rutte told media that the details of the security guarantees would be worked on over the coming days. The friendly tone of the meeting was in stark contrast to the last meeting in February that ended with Zelenskiy leaving the White House following the collapse of diplomatic talks.
In Japan, pressure on the long end of the yield curve continues as a new 20Y auction saw weak demand. The lack of demand for ultra-long bonds has become a market theme across regions, as the prospect of a significant increase in supply is leading to cautiousness among investors. Yesterday, we published an updated set of rates forecasts in our monthly 'Yield Outlook' publication. Overall, we stick with our previous view that especially long-end US rates are bound to move higher as the fiscal outlook bodes higher term premia going forward. See Yield Outlook - Optimism about Europe is broadening, 18 August.
In the UK, focus among investors is on the fiscal outlook as the government prepares a new budget. Yesterday, reports surfaced that UK Chancellor Reeves is considering replacing stamp duty with a new national property tax on homes above GBP 500k in an effort to increase government revenue, putting focus on the unsustainable public finances and the lack of political willingness to consolidate them.
Equities: Equity markets were essentially flat yesterday for the third consecutive session, underlining the current environment of very limited moves and remarkably low volatility across asset classes. This stands in sharp contrast to the prevailing backdrop of elevated political uncertainty, including ongoing discussions around potential ceasefire and peace negotiations in the Russia-Ukraine conflict. The lack of impact on financial markets is notable. With few macro data releases to guide sentiment, muted price action was hardly surprising.
From a European perspective, the healthcare sector once again stood out with strong outperformance yesterday, driven by company-specific news flow. This contrasts with the US, where healthcare failed to replicate the sector strength seen last week, when performance had been more top-down driven. In the US yesterday, Dow -0.1%, S&P 500 -0.01%, Nasdaq +0.03%, Russell 2000 +0.4%. This morning, Asian markets are mixed. US futures are marginally lower, while European futures point slightly higher.
FI and FX: A quiet start to the week with no major news resulted in a calm market session yesterday. Risk sentiment was slightly negative across equity markets, while EUR credit spreads saw renewed tightening. EUR rates fell marginally, reversing only a small part of last week's increase, while US rates ended slightly higher. GILTS faced pressure due to renewed focus on strained UK public finances and limited political appetite for consolidation. Despite this, EUR/GBP remained steady at 0.8635. EUR/USD drifted lower throughout the session, ending 0.4% down at 1.165. Asian equities are mixed this morning, with US equity futures pointing slightly lower. Brent is trading 1% higher at USD 66.25/bbl.
EUR/USD Daily Outlook
Daily Pivots: (S1) 1.1639; (P) 1.1678; (R1) 1.1699; More...
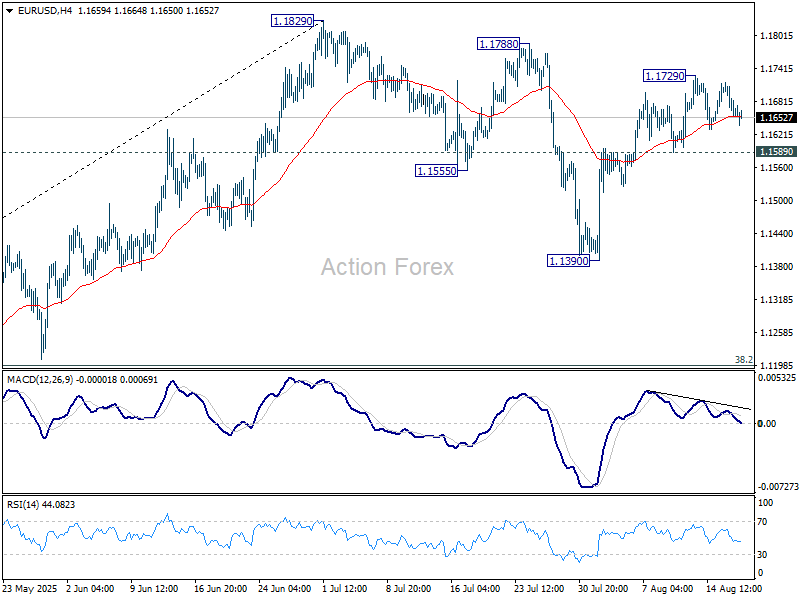
EUR/USD is staying in consolidations below 1.1729 and intraday bias remains neutral for the moment. Further rally is expected as long as 1.1589 support holds. Above 1.1729 will bring retest of 1.1829 high. On the downside, however, firm break of 1.1589 will turn bias to the downside, and extend the corrective pattern from 1.1829 with another fall.
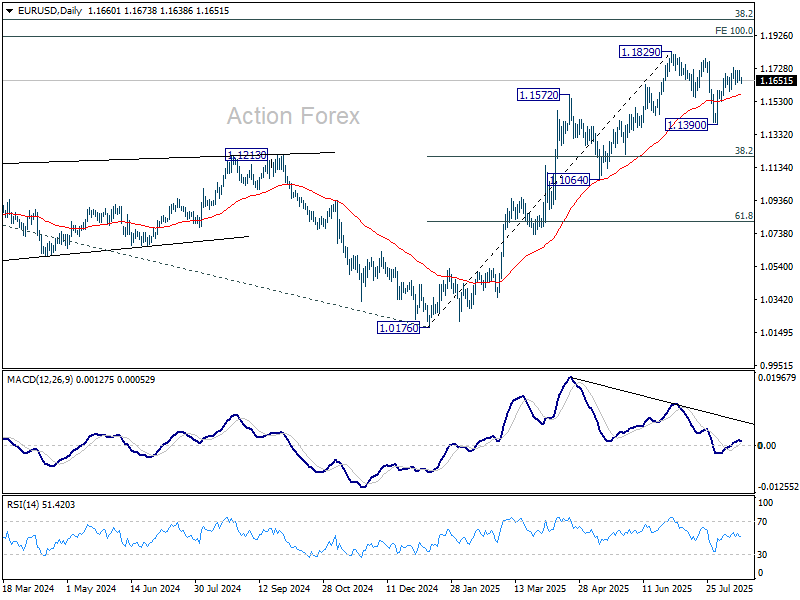
In the bigger picture, rise from 0.9534 long term bottom could be correcting the multi-decade downtrend or the start of a long term up trend. In either case, further rise should be seen to 100% projection of 0.9534 to 1.1274 from 1.0176 at 1.1916. This will remain the favored case as long as 1.1604 support holds.
USD/JPY Daily Outlook
Daily Pivots: (S1) 147.29; (P) 147.64; (R1) 148.20; More...
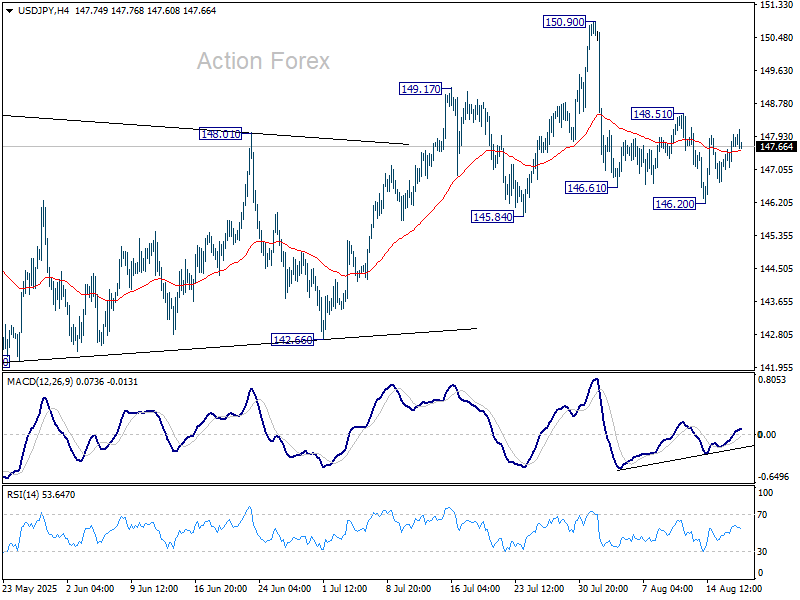
Intraday bias in USD/JPY remains neutral as range trading continues inside 146.20/148.51. On the upside, break of 148.51 will indicate that the pullback from 150.90 has completed, and bring retest of this high. This will also keep the whole rise from 139.87 alive. However, firm break of 145.84 support will argue that the rebound from 139.87 has completed, and turn near term outlook bearish.
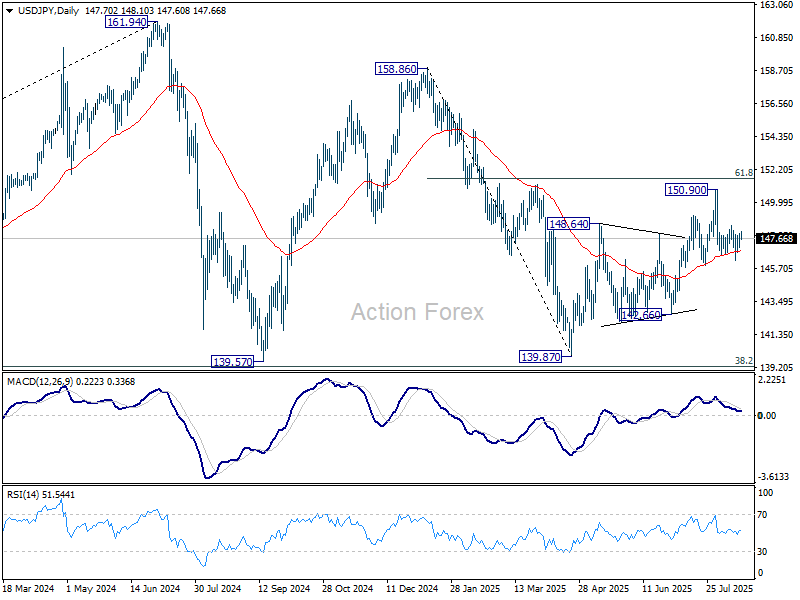
In the bigger picture, price actions from 161.94 (2024 high) are seen as a corrective pattern to rise from 102.58 (2021 low). Decisive break of 61.8% retracement of 158.86 to 139.87 at 151.22 will argue that it has already completed with three waves at 139.87. Larger up trend might then be ready to resume through 161.94 high. In case the corrective pattern extends with another fall, strong support is expected from 38.2% retracement of 102.58 to 161.94 at 139.26 to bring rebound.
GBP/USD Daily Outlook
Daily Pivots: (S1) 1.3478; (P) 1.3527; (R1) 1.3551; More...
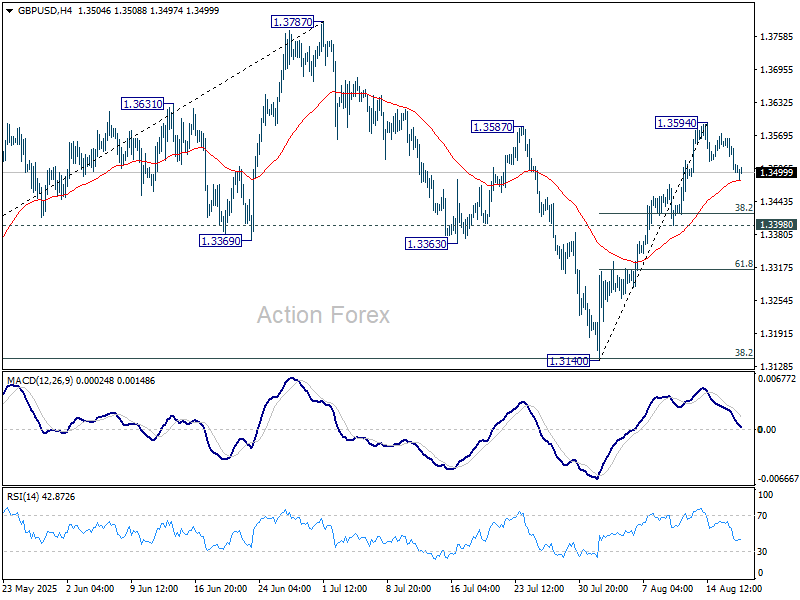
GBP/USD dips lower today as correction from 1.3594 continues. Intraday bias stays neutral for the moment. Deeper pullback might be seen but downside should be contained well above 1.3398 support. On the upside, break of 1.3594 will resume the rise from 1.3140 to retest 1.3787 high.
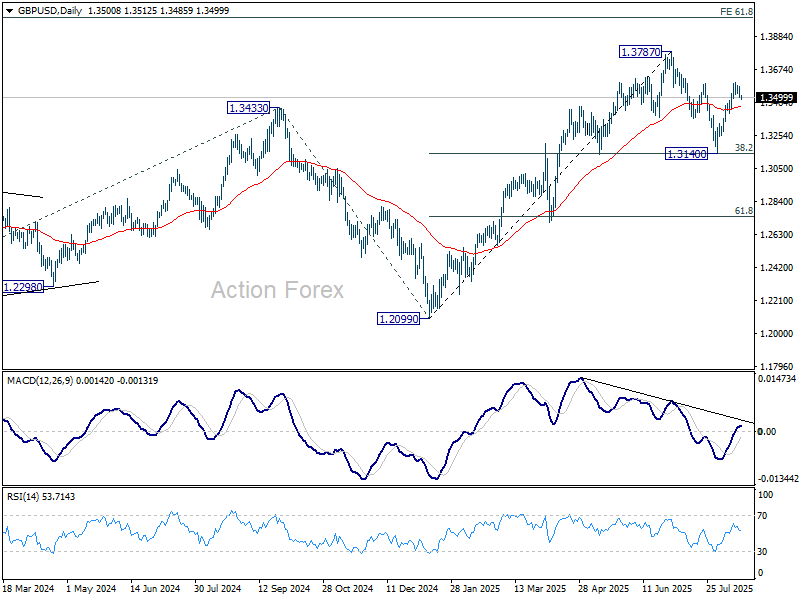
In the bigger picture, up trend from 1.3051 (2022 low) is in progress. Next medium term target is 61.8% projection of 1.0351 to 1.3433 from 1.2099 at 1.4004. Outlook will now stay bullish as long as 55 W EMA (now at 1.3090) holds, even in case of deep pullback.
USD/CHF Daily Outlook
Daily Pivots: (S1) 0.8058; (P) 0.8069; (R1) 0.8087; More….
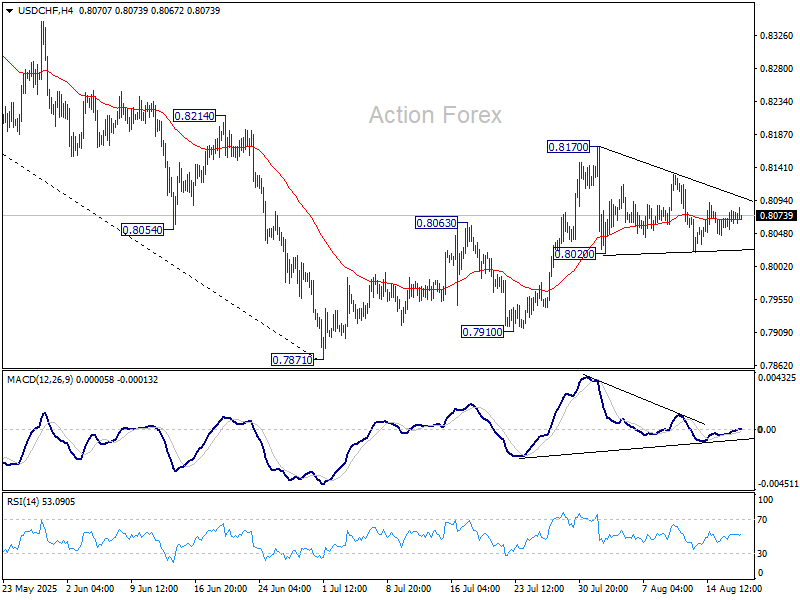
USD/CHF is still bounded in range of 0.8020/8170 and intraday bias stays neutral. On the downside, break of 0.8020 will revive that case that the corrective pattern from 0.7871 has completed, and target a retest on 0.7871 low. On the upside, firm break of 0.8710 will resume the corrective from 0.7871. Intraday bias will be back on the upside for 38.2% retracement of 0.9200 to 0.7871 at 0.8379.
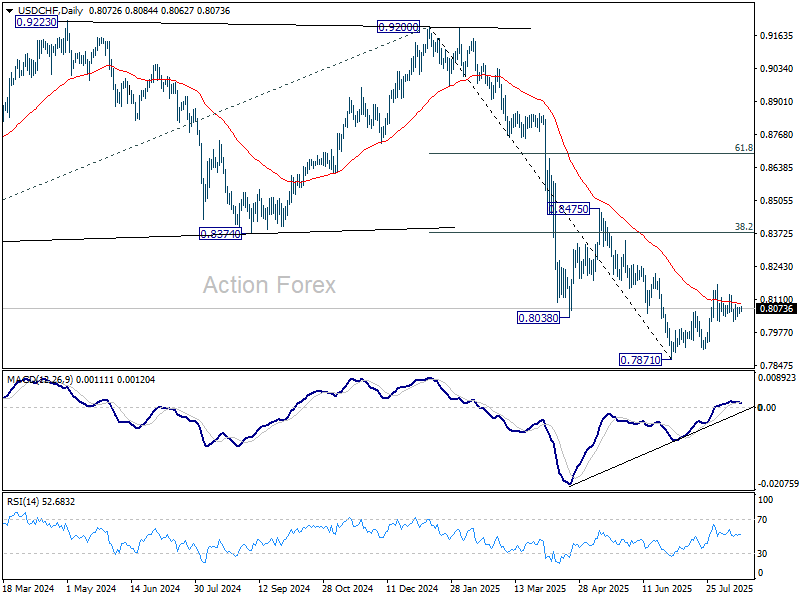
In the bigger picture, long term down trend from 1.0342 (2017 high) is still in progress. Next target is 100% projection of 1.0146 (2022 high) to 0.8332 from 0.9200 at 0.7382. In any case, outlook will stay bearish as long as 0.8475 resistance holds.
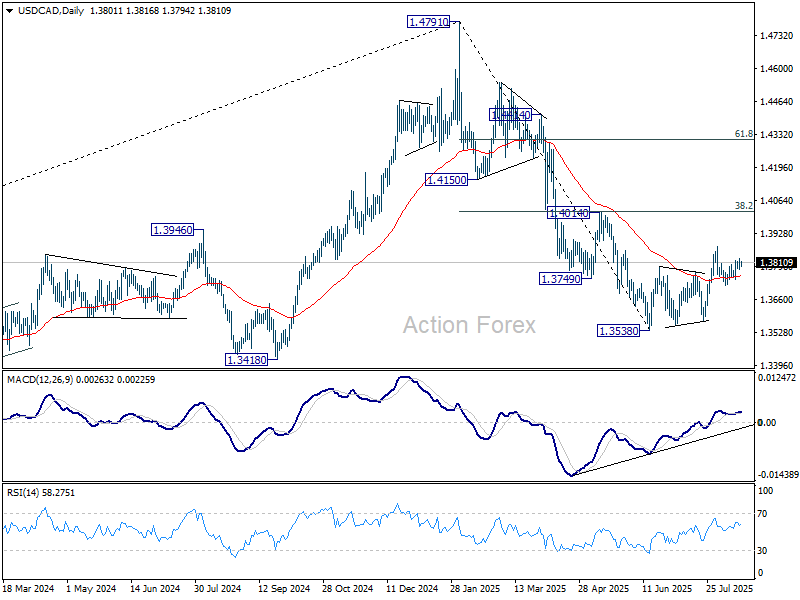
USD/CAD Daily Outlook
Daily Pivots: (S1) 1.3780; (P) 1.3806; (R1) 1.3828; More...
Intraday bias in USD/CAD remains neutral as range trading continues. On the downside, break of 1.3720 will reaffirm the case that corrective pattern from 1.3538 has completed at 1.3878. Further decline should then be seen back to retest 1.3538 low. However, break of 1.3878 will extend the corrective rebound from 1.3538 with another rising leg towards 1.4014 cluster resistance (38.2% retracement of 1.4791 to 1.3538 at 1.4017).
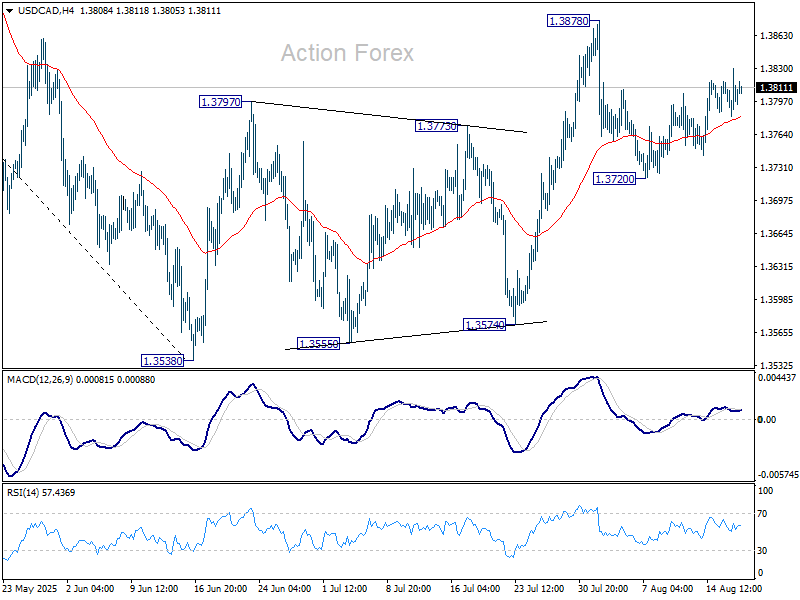
In the bigger picture, price actions from 1.4791 medium term top could either be a correction to rise from 1.2005 (2021 low), or trend reversal. In either case, further decline is expected as long as 1.4014 resistance holds. Next target is 61.8% retracement of 1.2005 (2021 low) to 1.4791 at 1.3069.
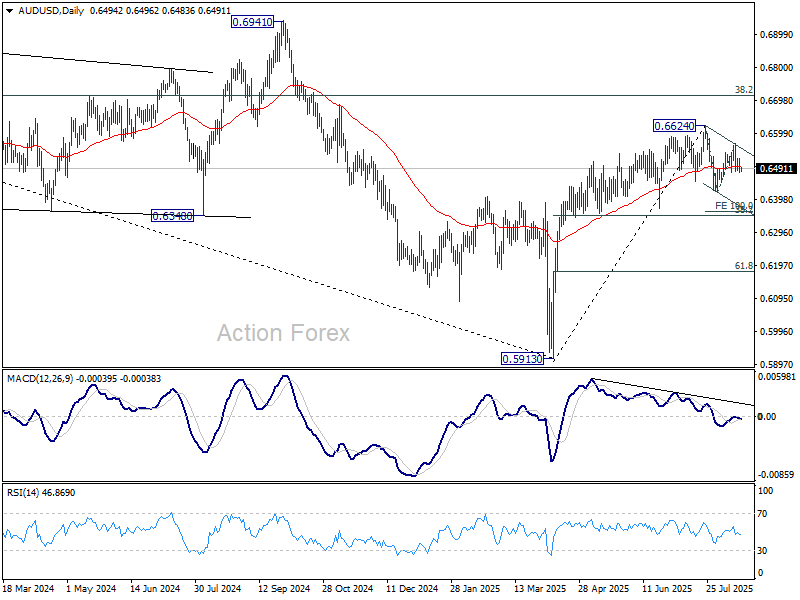
AUD/USD Daily Report
Daily Pivots: (S1) 0.6475; (P) 0.6499; (R1) 0.6517; More...
Intraday bias in AUD/USD stays neutral, and focus is back on 0.6841 support with current dip. Firm break there will suggest that corrective pattern from 0.6624 is already extending with a third leg. Intraday bias will be back on the downside for 0.6418 support first, and then 38.2% retracement of 0.5913 to 0.6624 at 0.6352. On the upside, though, above 0.6567 will resume the rebound from 0.6418 to 0.6624 high.
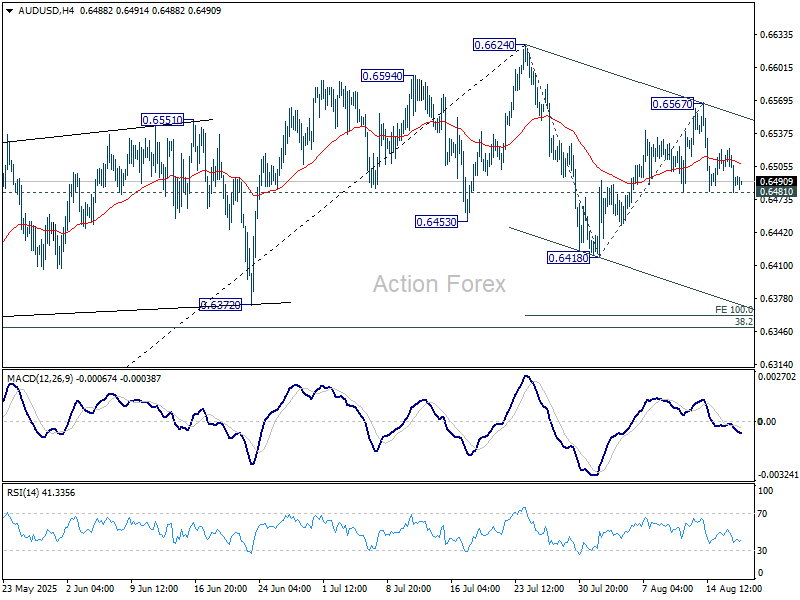
In the bigger picture, there is no clear sign that down trend from 0.8006 (2021 high) has completed. Rebound from 0.5913 is seen as a corrective move. While stronger rally cannot be ruled out, outlook will remain bearish as long as 38.2% retracement of 0.8006 to 0.5913 at 0.6713 holds. Nevertheless, considering bullish convergence condition in W MACD, even in case of another fall through 0.5913, downside should be contained above 0.5506 (2020 low).
Trump-Zelenskyy Meeting Shrugged Off, Canada CPI May Break Lull
The forex market continues to trade without conviction, with major pairs confined to last week’s ranges. Traders are largely in wait-and-see mode, with the Jackson Hole Symposium at the end of the week expected to provide the next significant catalyst as Fed officials weigh in on the September policy outlook.
Still, brief bursts of volatility could emerge from data in the interim. Today’s Canada CPI release is one such event. Headline inflation is expected to hold steady, but core measures may firm. The outcome will be crucial for BoC, which has paused after seven consecutive cuts but remains split on whether more easing is needed in September.
On the geopolitical front, attention has been high but market reaction muted. US President Donald Trump hosted Ukrainian President Volodymyr Zelenskyy and European leaders at the White House in an effort to build momentum toward ending the war in Ukraine. Yet financial markets have largely shrugged off the developments.
Trump revealed he has begun arranging a meeting between Russian President Vladimir Putin and Zelenskyy, with a trilateral summit involving himself to follow. He described the initiative as an “early step” in a war now nearing its fourth year. Expectations are modest, but the symbolic breakthrough has been noted.
Zelenskyy added that a package of security guarantees for Ukraine is being prepared, likely including significant U.S. weapons purchases, and should be formalized within 10 days. Trump confirmed that guarantees would be provided by European countries in coordination with Washington.
In Asia, at the time of writing, Nikkei is down -0.03%. Hong Kong HSI is up 0.19%. China Shanghai SSE is up 0.30%. Singapore Strait Times is up 0.55%. China Shanghai SSE is up 0.028 at 1.600. Overnight, DOW fell -0.08%. S&P 500 fell -0.01%. NASDAQ rose 0.03%. 10-year yield rose 0.013 to 4.341.
Australia's Westpac consumer sentiment hits 3.5-year high on RBA boost
Australian consumer confidence surged in August, with the Westpac index rising 5.7% mom to 98.5, the strongest reading since early 2022. Westpac attributed the rebound to RBA’s recent rate cuts, noting that a “long period of pessimism” among households may finally be drawing to a close. Consumers are less worried about their finances and more willing to take a cautiously positive view on the economy.
While policy easing is clearly helping, Westpac said the recovery is still fragile. Sustaining gains will likely require further RBA support, though there is no urgency to cut again at the September 29–30 meeting. With inflation well within the target range and unemployment low, the Board has room to wait and respond to incoming data.
On balance, Westpac expects RBA to hold steady in September before delivering another 25bp rate cut in November.
Canada CPI to steer BoC next cut? EUR/CAD risks correction
Canadian inflation data is today’s key release, with headline CPI expected at 1.9% yoy in July, unchanged from June. More attention may fall on core measures, with CPI common forecast to tick up to 2.7% yoy from 2.6% yoy. The figures arrive at a delicate juncture for BoC, which has cut rates seven times since June 2024 but held steady at 2.75% in its last three meetings.
Expectations for a September rate cut remain divided. The BoC’s July summary of deliberations revealed a split council: some members argued that enough easing has already been delivered, while others highlighted economic slack and warned further support may be needed if labor market conditions soften. The uncertainty has left markets reluctant to price in an imminent move with conviction.
Tariff risks complicate the picture. Policymakers noted in July that U.S. tariffs and the rewiring of global trade are directly influencing inflation and broader growth dynamics. The latest decision to hold rates came just before Trump ratcheted Canadian tariffs up to 35%, though with exemptions for CUSMA-compliant goods.
Despite headwinds, BoC acknowledged some resilience in the domestic economy. Yet policymakers remain wary of timing: additional easing might only take hold as demand begins to recover, raising the risk of fueling price pressures rather than cushioning growth.
For now, inflation remains close to target and the economy has shown pockets of resilience, but the balance of risks is still fragile. Whether today’s CPI confirms contained price growth or points to renewed pressures could influence whether BoC holds steady again in September.
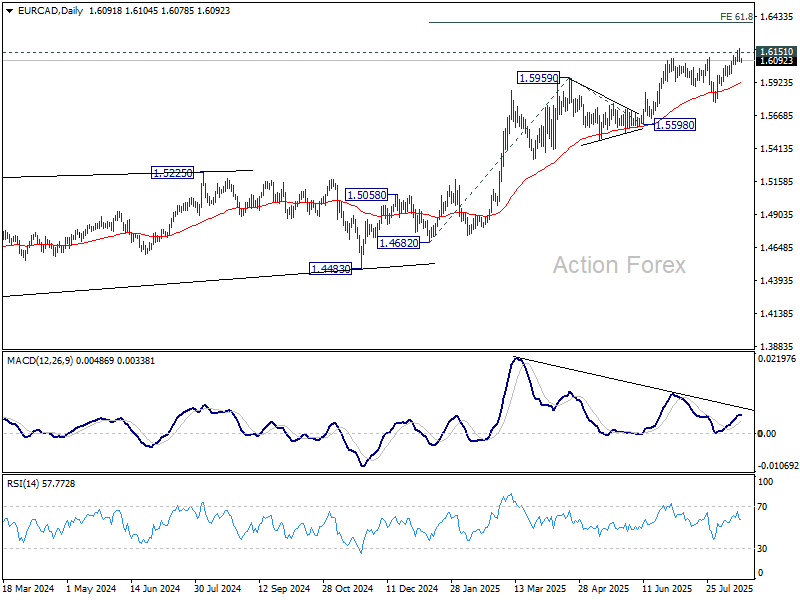
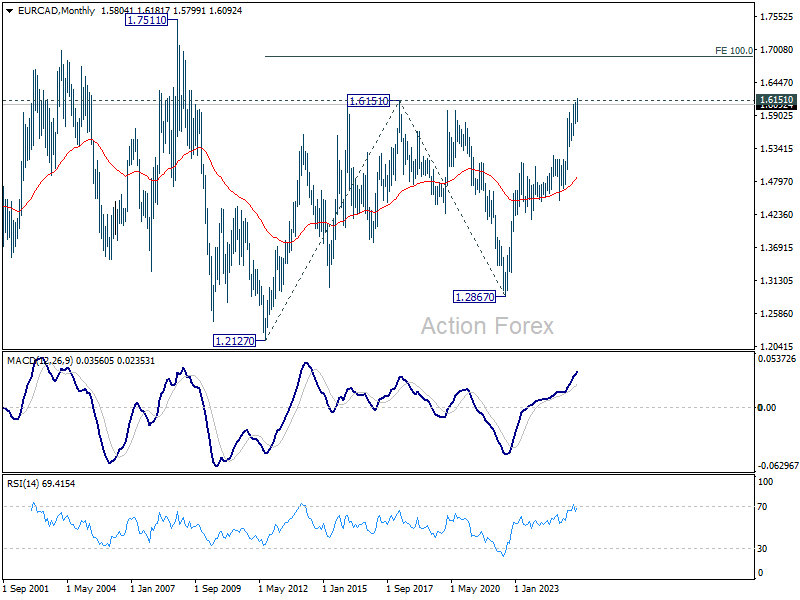
Technically, EUR/CAD is starting to lose momentum as it's struggling to sustain above 1.6151 key resistance (2018 high). Immediate focus is on 1.6063 minor support. Firm break there will indicate short term topping and bring deeper pullback to 55 D EMA (now at 1.5910).
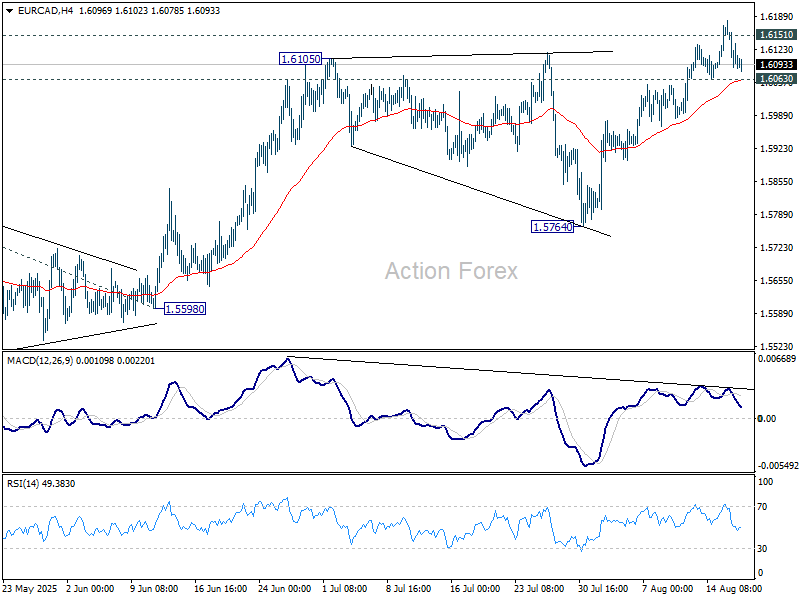
But the overall outlook will stay bullish as long as 1.5764 support holds. The larger up trend is expected to resume sooner or later. Once the 1.6151 resistance is cleared decisively, next target is 61.8% projection of 1.4682 to 1.5959 from 1.5598 at 1.6387.
AUD/USD Daily Report
Daily Pivots: (S1) 0.6475; (P) 0.6499; (R1) 0.6517; More...
Intraday bias in AUD/USD stays neutral, and focus is back on 0.6841 support with current dip. Firm break there will suggest that corrective pattern from 0.6624 is already extending with a third leg. Intraday bias will be back on the downside for 0.6418 support first, and then 38.2% retracement of 0.5913 to 0.6624 at 0.6352. On the upside, though, above 0.6567 will resume the rebound from 0.6418 to 0.6624 high.
In the bigger picture, there is no clear sign that down trend from 0.8006 (2021 high) has completed. Rebound from 0.5913 is seen as a corrective move. While stronger rally cannot be ruled out, outlook will remain bearish as long as 38.2% retracement of 0.8006 to 0.5913 at 0.6713 holds. Nevertheless, considering bullish convergence condition in W MACD, even in case of another fall through 0.5913, downside should be contained above 0.5506 (2020 low).
AUD/USD Faces Pressure, Downside Break Could Trigger Losses
Key Highlights
- AUD/USD struggled near 0.6565 and reacted to the downside.
- It traded below a key bullish trend line with support at 0.6505 on the 4-hour chart.
- GBP/USD is correcting gains from the 1.3590 resistance zone.
- EUR/USD is struggling to clear the 1.1720 resistance.
AUD/USD Technical Analysis
The Aussie Dollar failed to continue higher above 0.6565 against the US Dollar. AUD/USD corrected gains and traded below the 0.6500 support.
Looking at the 4-hour chart, the pair traded below a key bullish trend line with support at 0.6505. There was a move below the 50% Fib retracement level of the upward move from the 0.6419 swing low to the 0.6568 high.
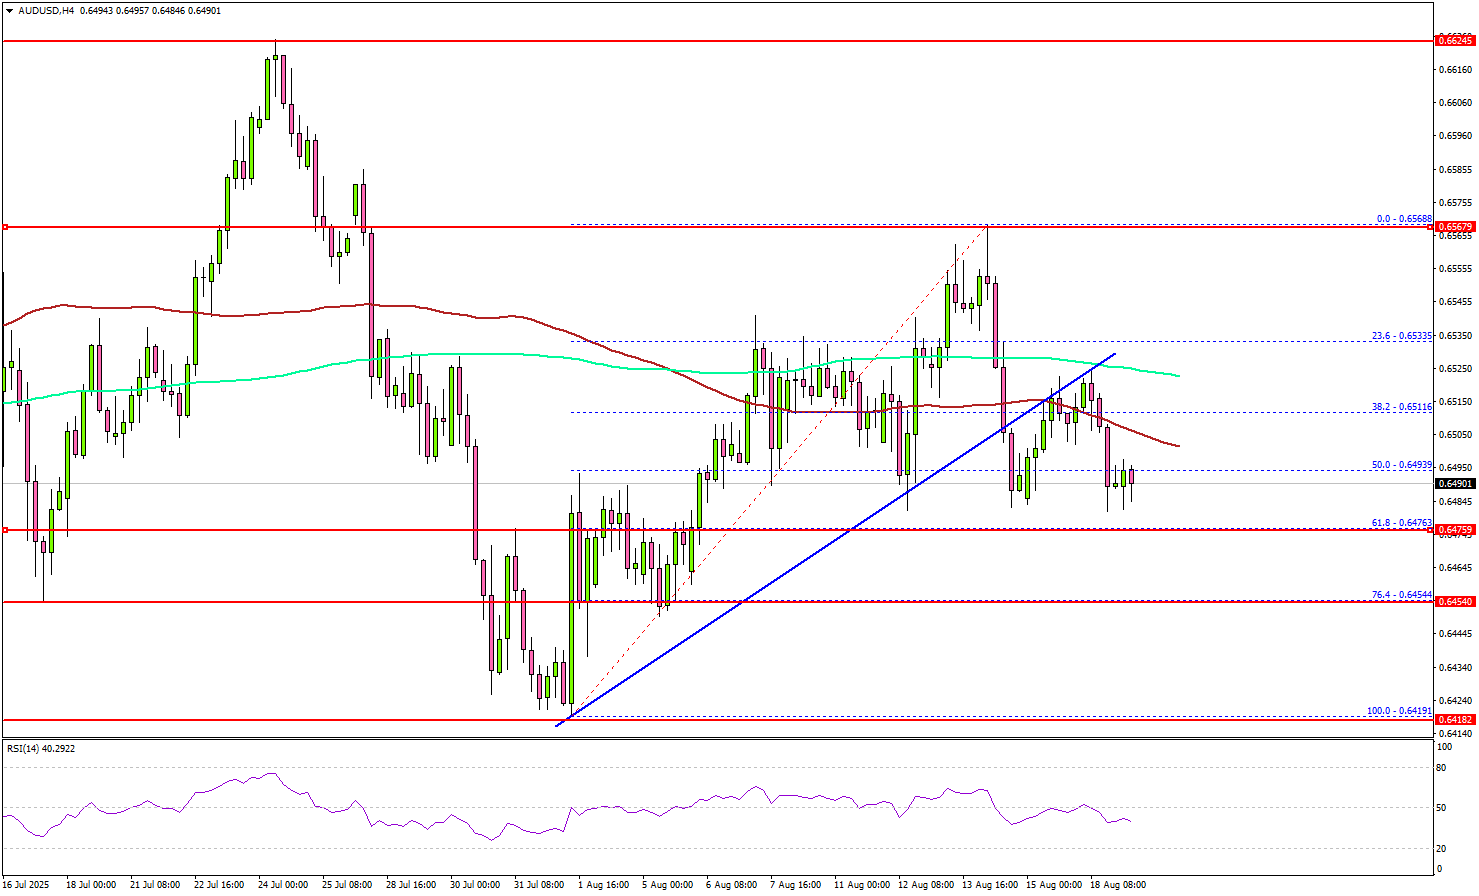
The pair is now trading below the 100 simple moving average (red, 4-hour) and the 200 simple moving average (green, 4-hour). On the downside, immediate support is 0.6475. It is close to the 61.8% Fib retracement level of the upward move from the 0.6419 swing low to the 0.6568 high.
The next key support sits at 0.6455. Any more losses could send the pair toward the 0.6420 support zone. On the upside, the pair now faces resistance near the 0.6500 level.
The next key resistance sits near 0.6525. A close above 0.6525 could set the pace for another increase. In the stated case, the pair could rise toward 0.6550, above which the bulls could aim for a move toward 0.6620.
Looking at EUR/USD, the pair started a downside correction, and it seems like the bears might aim for a move toward 1.1600.
Upcoming Key Economic Events:
- US Housing Starts for July 2025 (MoM) – Forecast 1.30M, versus 1.321M previous.
- US Building Permits for July 2025 (MoM) – Forecast 1.390M, versus 1.393M previous.
Canada CPI to steer BoC next cut? EUR/CAD risks correction
Canadian inflation data is today’s key release, with headline CPI expected at 1.9% yoy in July, unchanged from June. More attention may fall on core measures, with CPI common forecast to tick up to 2.7% yoy from 2.6% yoy. The figures arrive at a delicate juncture for BoC, which has cut rates seven times since June 2024 but held steady at 2.75% in its last three meetings.
Expectations for a September rate cut remain divided. The BoC’s July summary of deliberations revealed a split council: some members argued that enough easing has already been delivered, while others highlighted economic slack and warned further support may be needed if labor market conditions soften. The uncertainty has left markets reluctant to price in an imminent move with conviction.
Tariff risks complicate the picture. Policymakers noted in July that U.S. tariffs and the rewiring of global trade are directly influencing inflation and broader growth dynamics. The latest decision to hold rates came just before Trump ratcheted Canadian tariffs up to 35%, though with exemptions for CUSMA-compliant goods.
Despite headwinds, BoC acknowledged some resilience in the domestic economy. Yet policymakers remain wary of timing: additional easing might only take hold as demand begins to recover, raising the risk of fueling price pressures rather than cushioning growth.
For now, inflation remains close to target and the economy has shown pockets of resilience, but the balance of risks is still fragile. Whether today’s CPI confirms contained price growth or points to renewed pressures could influence whether BoC holds steady again in September.
Technically, EUR/CAD is starting to lose momentum as it's struggling to sustain above 1.6151 key resistance (2018 high). Immediate focus is on 1.6063 minor support. Firm break there will indicate short term topping and bring deeper pullback to 55 D EMA (now at 1.5910).
But the overall outlook will stay bullish as long as 1.5764 support holds. The larger up trend is expected to resume sooner or later. Once the 1.6151 resistance is cleared decisively, next target is 61.8% projection of 1.4682 to 1.5959 from 1.5598 at 1.6387.