
Sample Category Title
Gold (XAU/USD) Hovers at $3350/oz, Russia-Ukraine Developments in Focus
Gold prices have rallied from an overnight low around the $3323/oz handle to a high of $3360/oz before settling around the $3350/oz mark.The precious metal looks set to continue its choppy price action at the start of a busy week.
The recovery in Gold from the overnight low could in part be down to lower US Treasury Yields with the benchmark 10Y US Treasury yield falling from its recent highs.
Russia-Ukraine Developments as Trump and Zelensky Set to Meet
European leaders will meet with Zelenskiy and Trump on Monday to discuss a possible deal to end the Russia-Ukraine war.
Under the proposed plan, Russia would give up small areas of occupied Ukraine, while Ukraine would give up parts of its eastern region that Russia has been unable to take. These ideas were reportedly discussed by Putin and Trump during their summit in Alaska on Friday.
The question moving forward will be whether a peace deal will have a significant impact on Gold prices. The Russia-Ukraine conflict has been running for the better part of three and a half years. It will be interesting to see how much risk premium has been priced into gold as a result and if there will be a significant selloff if a deal is struck.
Either way, this is worth monitoring.
US Dollar Index (DXY) Outlook
The US Dollar Index was higher this morning ahead of what is shaping up to be a busy week. Geopolitical developments, Fed Speak and Jackson Hole are all in focus.
The DXY continues to trade at a key confluence level as rate cut bets from the US Federal Reserve continue to change.
Money markets now see an 83% chance that the Federal Reserve will lower interest rates by a quarter point next month. However, traders have become less certain about a rate cut after recent data showed higher U.S. wholesale prices and strong retail sales in July.
Fed Chair Jerome Powell is set to speak about the economy and the Fed's plans at the Jackson Hole symposium from August 21 to 23.
MUFG Bank predicts the Fed will cut rates in September but doesn’t expect Powell to clearly signal this during his speech. This will be Powell's last address at the conference before his term ends next May, as he balances the Fed's goals of keeping prices stable and unemployment low.
A pivotal week for the greenback and one which could have implications for Gold prices as well.
US Dollar Index (DXY)
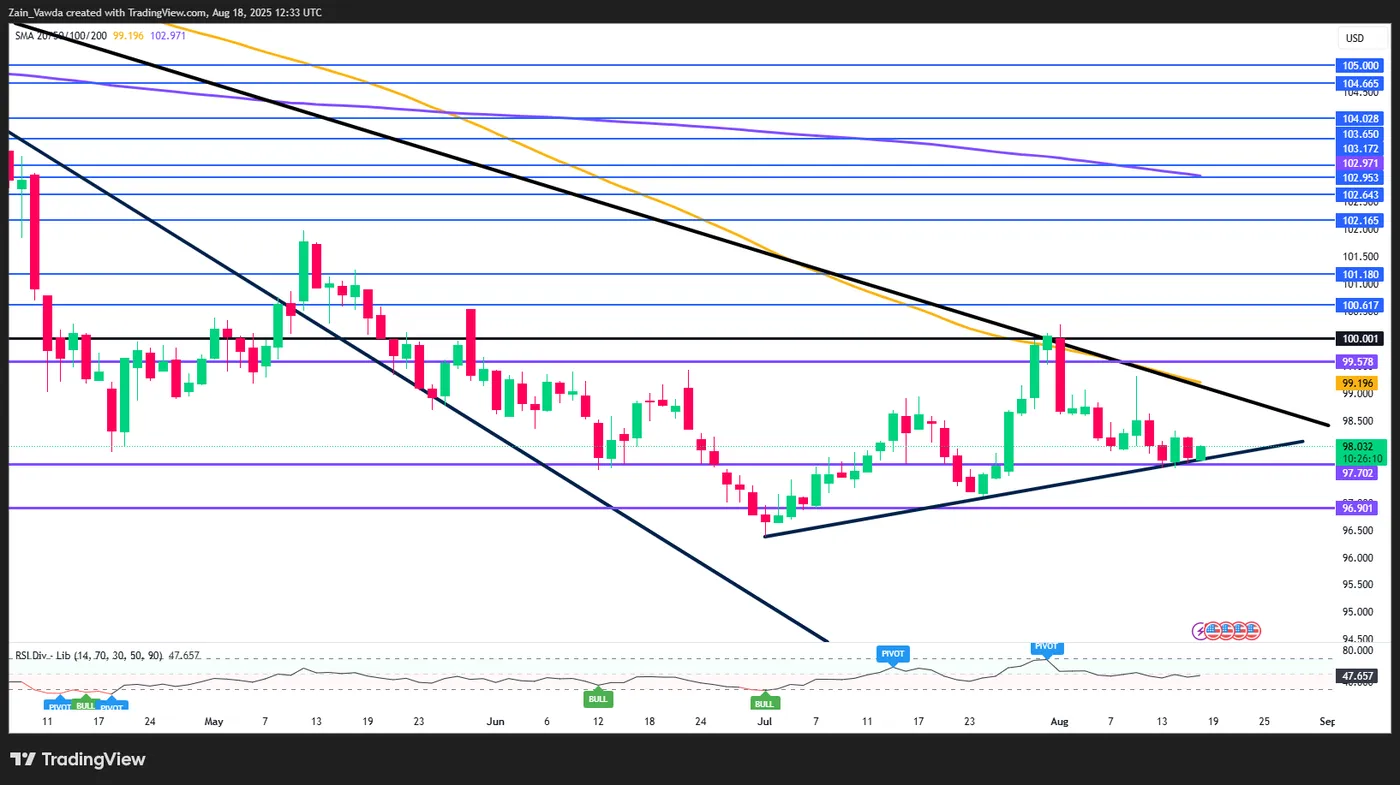
Source: Tradingview
Gold Prices Moving Forward
Gold prices continue to hold firm for now with downside potential limited thanks to a host of uncertainties still prevalent in global markets.
Safe haven demand remains in play and this could in part explain Gold's resilience.
The performance of Gold moving forward hinges on potential changes in rate cut bets as well as geopolitical developments.
There is another concern for Gold prices. Given the rally over the last 18 months, Gold's value could lead to a pivot or rotation toward other commodities which continue to play catch-up to gold.So while we could still see some upside in gold, I’d say the bigger opportunity is elsewhere in commodities at this stage of the monetary-macro-metal cycle.
Technical Analysis - Gold (XAU/USD)
From a technical standpoint, on the two-hour chart below we can see that Gold has rejected of the 50-day MA.
Price is however trading just above a key area of support as market participants seek clarity.
The RSI Period-14 remains above the 50 neutral level which is also a sign of bullish momentum.
Either way Golds next move will need a catalyst in either direction for a potential breakout.
Immediate support rests at 3331 before the 3314 and 3300 handle came into foucs.
A move higher first need acceptance above the 50-day MA before the 3361 and 3375 handles come into focus.
Gold (XAU/USD) Daily Chart, August 18, 2025
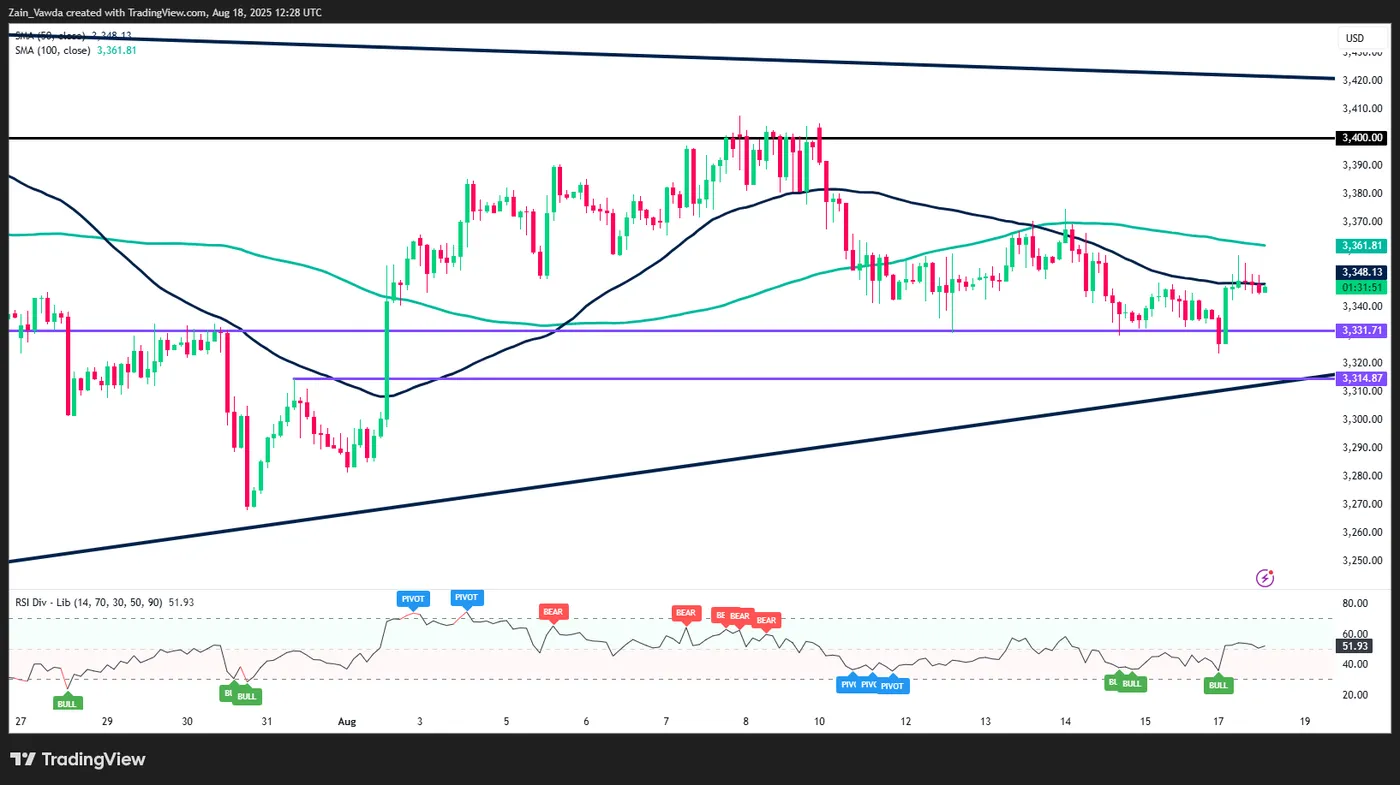
Source: TradingView (click to enlarge)
Client Sentiment Data - XAU/USD
Looking at OANDA client sentiment data and market participants are Long on Gold with 67% of traders net-long. I prefer to take a contrarian view toward crowd sentiment and thus the fact that the majority of traders are net-long suggests that Gold prices could continue to slide in the near-term.
Cryptocurrencies Extend Their Decline from Recent Highs
There were a few signals traders could have spotted ahead of the ongoing selloff.
After last Friday's warning from Bitcoin, with an all-time high leading to a direct retracement, the crypto market has started to make its way off its most recent highs.
Ethereum staged a huge rally toward its record levels, but buyers failed to break through the $4,870 all-time high—a sign of hesitancy from the market that sellers enjoy.
Altcoins were also a bit timid on the last leg of the rally showing some lack of depth in buying.
And with cryptocurrencies still firmly in the risk-asset camp, renewed geopolitical headwinds (including uncertainty with the Russia-Ukraine war) are giving investors further reasons to cash out from the rallies.
Let's see through BTC and ETH intraday charts if this should keep on going or if this is just a small retracement in the longer-term trend.
Bitcoin 8H Chart
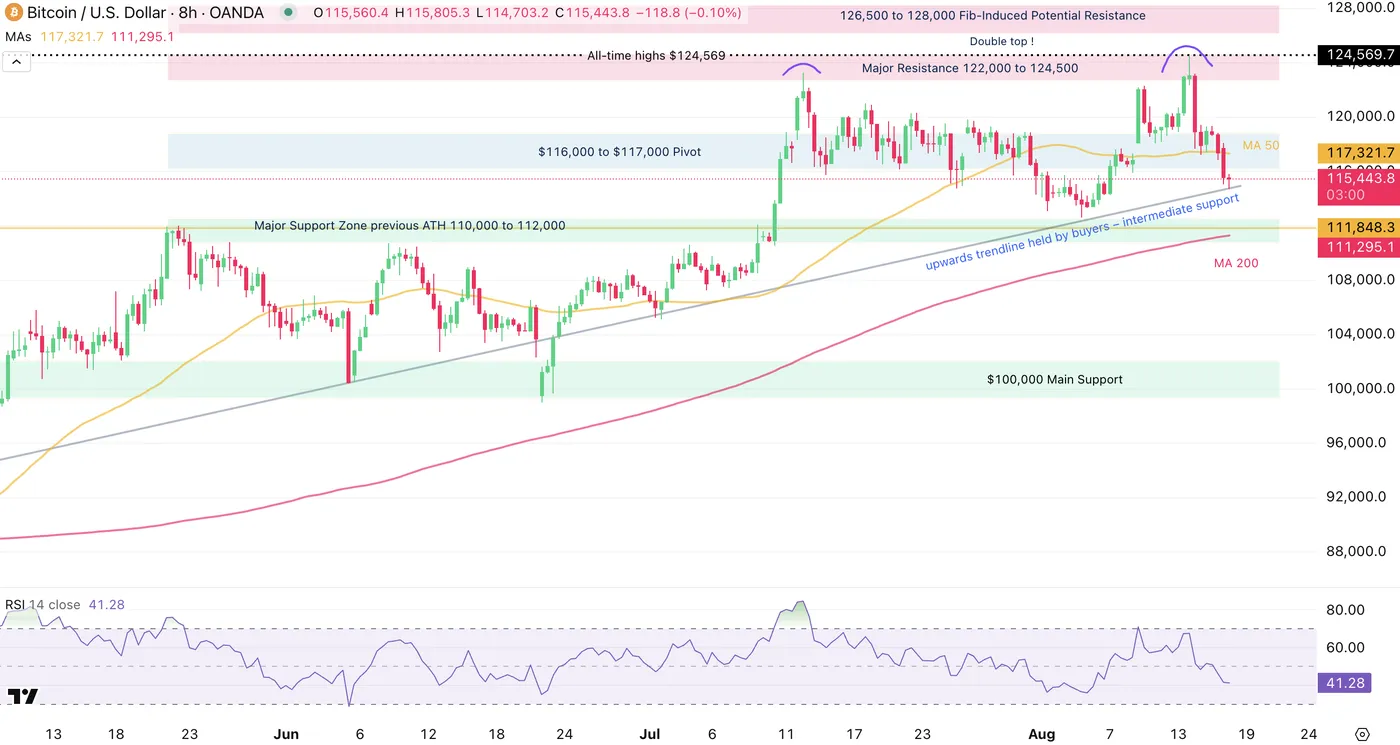
Bitcoin 8H Chart, August 18, 2025 – Source: TradingView
Bitcoin is $9,000 (7.20%) from its most recent ATH at $124,269, with the shape of the most recent highs appearing as a double top.
Despite this warning sign, the ongoing 8H candle is showing a doji-indecision as shorter timeframes enter oversold territory.
The current candle appears as dip buyers try to re-enter at the upward trendline that has served as support since the end of April.
Prices are located right between the 50 and 200-period MAs – showing that the action is much less balanced than the previous uptrend.
Levels to watch for Bitcoin trading:
Levels for BTC trading:
Support Levels:
- $114,500 to $115,500 rebound at the current supporting trendline
- $110,000 to $112,000 previous ATH support zone (MA 200 at $111,350)
- $100,000 Main support at psychological level
Resistance Levels:
- $116,000 to $117,000 Pivot
- 50-period MA $117,330
- Major Resistance $122,000 to $124,500
- Current all-time high $124,596
Ethereum 8H Chart
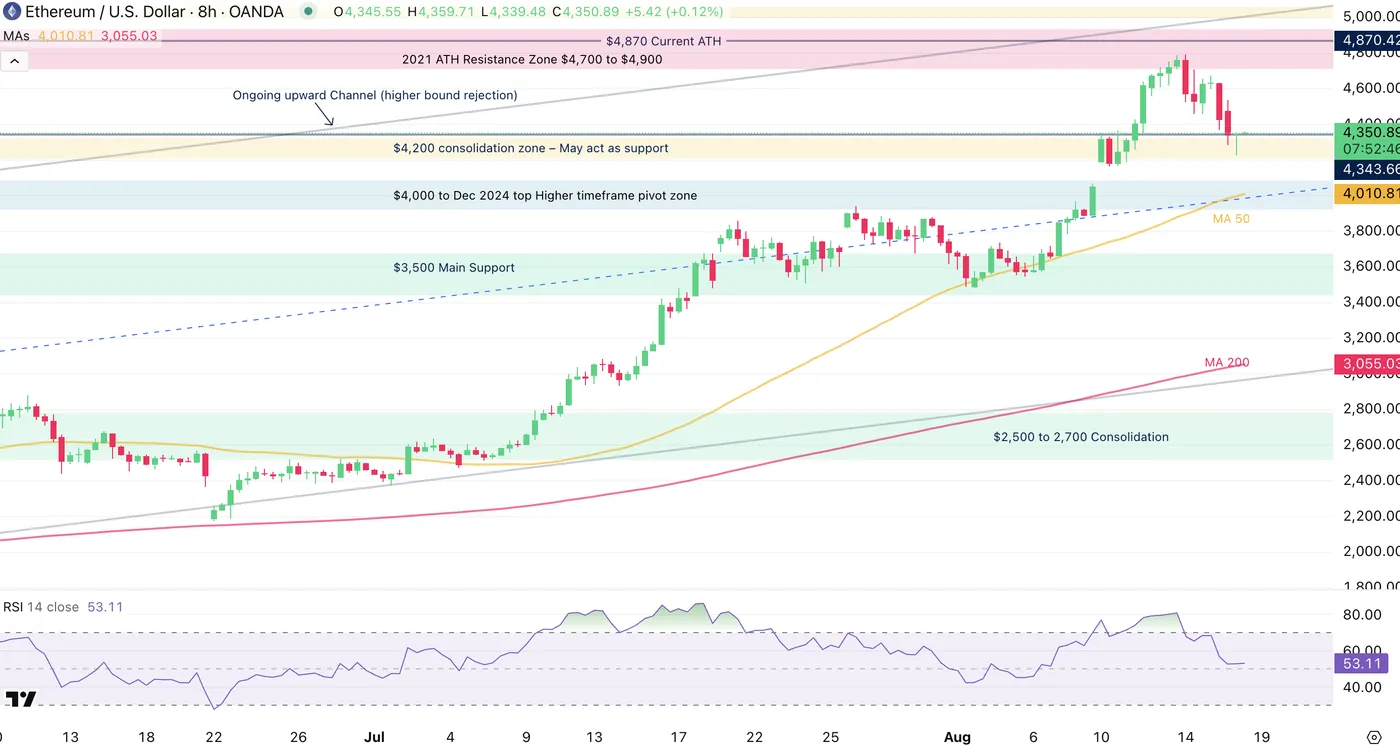
Ethereum 8H Chart, August 18, 2025 – Source: TradingView
Ethereum's outlook doesn't look as bleak, with the ongoing retracement hanging around the $4,200 to $4,300 consolidation zone (yellow box).
With prices evolving in a current upward channel, sellers seem to have appeared at the higher bound just before the $4,870 2021 record.
Buyers took the current rally to $4,790. As mentioned in the intro, a failure to breach the past highs is interpreted by sellers as lack of persistence from ETH bulls.
Nonetheless, after reaching ultra-overbought levels, such retracements are healthy.
Probability of a higher rebound from here are still decent as long as prices hold above the $4,000 pivot, and even higher probability if buyers take the short-term hand here.
Levels for ETH trading:
Support Levels:
- $3,500 Support zone
- $4,000 Main pivot (confluence with 50-period MA)
- $4,200 to $4,300 consolidation zone (currently testing)
Resistance Levels:
- Current highs $4,793
- $4,700 to $4,900 All-time high resistance zone
- $4,870 2021 record
- Potential resistance at 1.618% Fibonacci extension of April to July up-move
A look at the crypto Market Cap
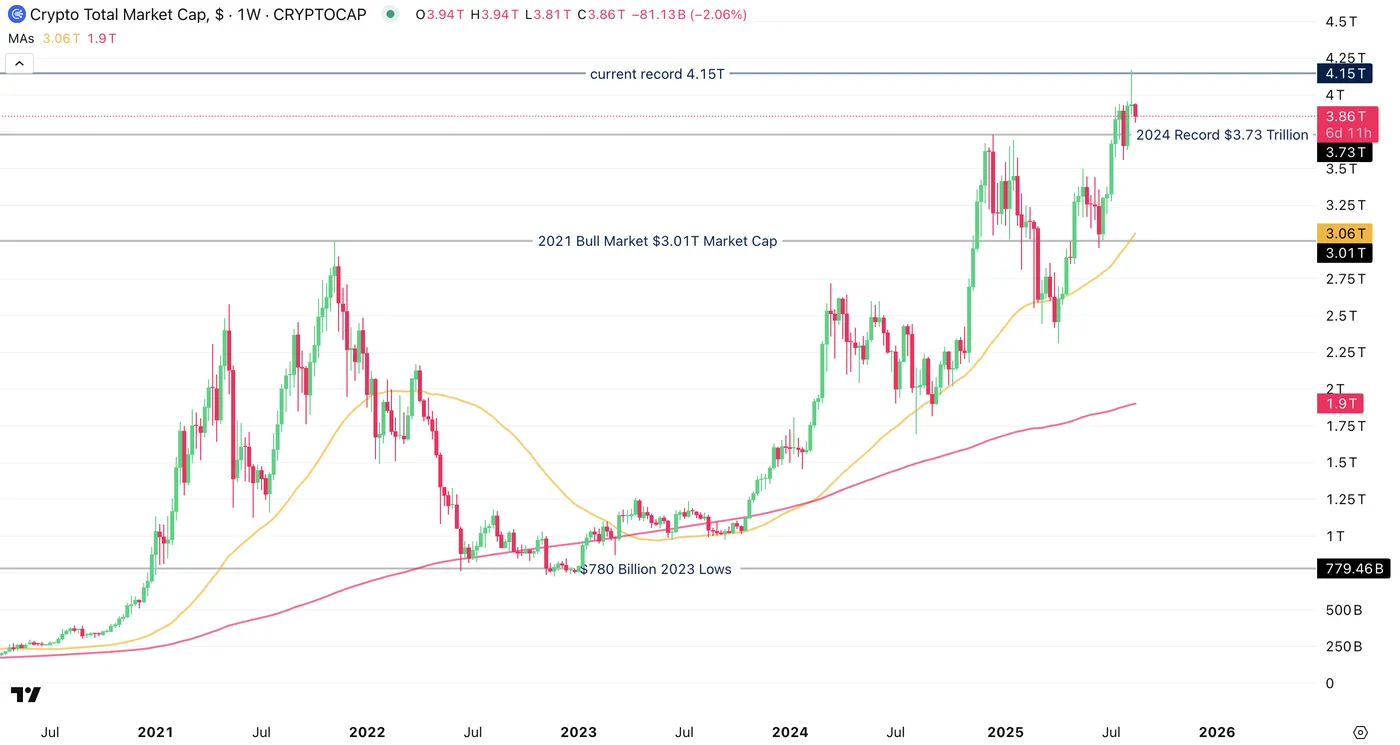
Total Market Cap Weekly Chart, August 18, 2025 – Source: TradingView
The Total Crypto Market Cap is testing the 2024 highs.
As long as profit-taking doesn't go below 3.50T, we can assume that this is just some healthy retracement instead of the beginning of a bear trend.
Altcoins are retracing a bit more strongly, but this is common as they are the most risky of the already-risky crypto asset class.
We will stay in touch frequently to see how this story develops.
Safe Trades!
Calm Decline in Oil Prices Continues
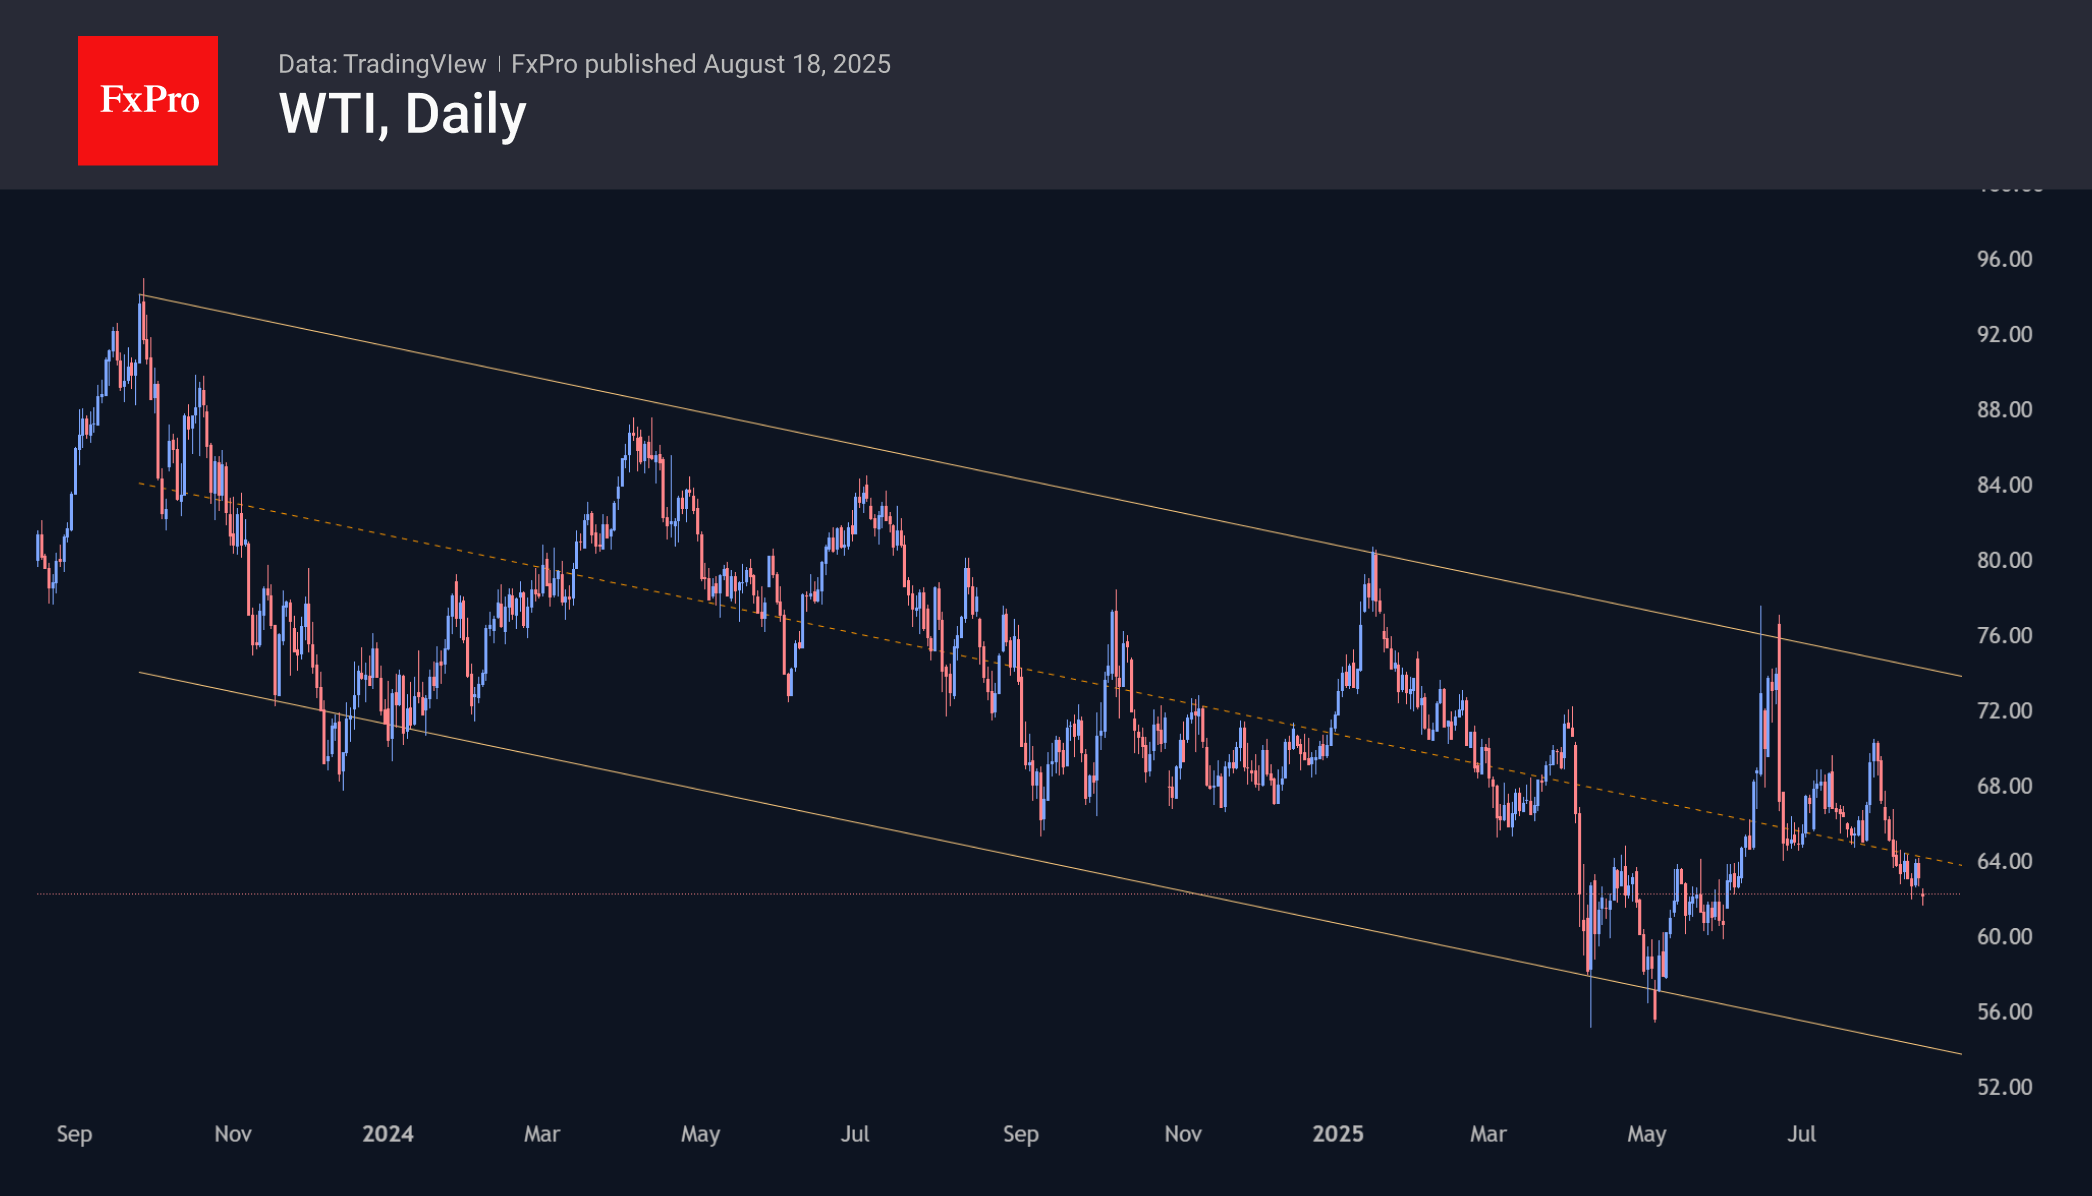
There are signs that oil prices are attempting to bottom out at around $61 per barrel for WTI and $65 per barrel for Brent. In the middle of last week and at the start of trading on Monday, local lows were touched, last seen in early June. However, the local rebound does not look convincing, indicating instead a pause in the decline within the downward movement inside a two-year descending channel.
Fundamental data from the US also remained largely unchanged. The number of oil rigs rose to 412, compared to 411 and 410 in the last couple of weeks.
Commercial stocks remain close to year-ago levels and close to the average for the last 12 weeks. Average daily production levels are close to 13.3 million barrels per day. The US first reached these levels at the end of 2023, after which we saw a plateau in production, fluctuating between 13.6 and 13.2 million.
At the same time, oil is becoming more abundant due to the restoration of OPEC+ supplies. The latest announcement of plans for September returns quotas to pre-November 2023 ‘voluntary reduction’ levels. OPEC+ refers to an oil deficit in its calculations, while the IEA notes the fifth month of inventory growth in July. This process is likely to gain momentum from September onwards, unless there is an acceleration in global economic growth.
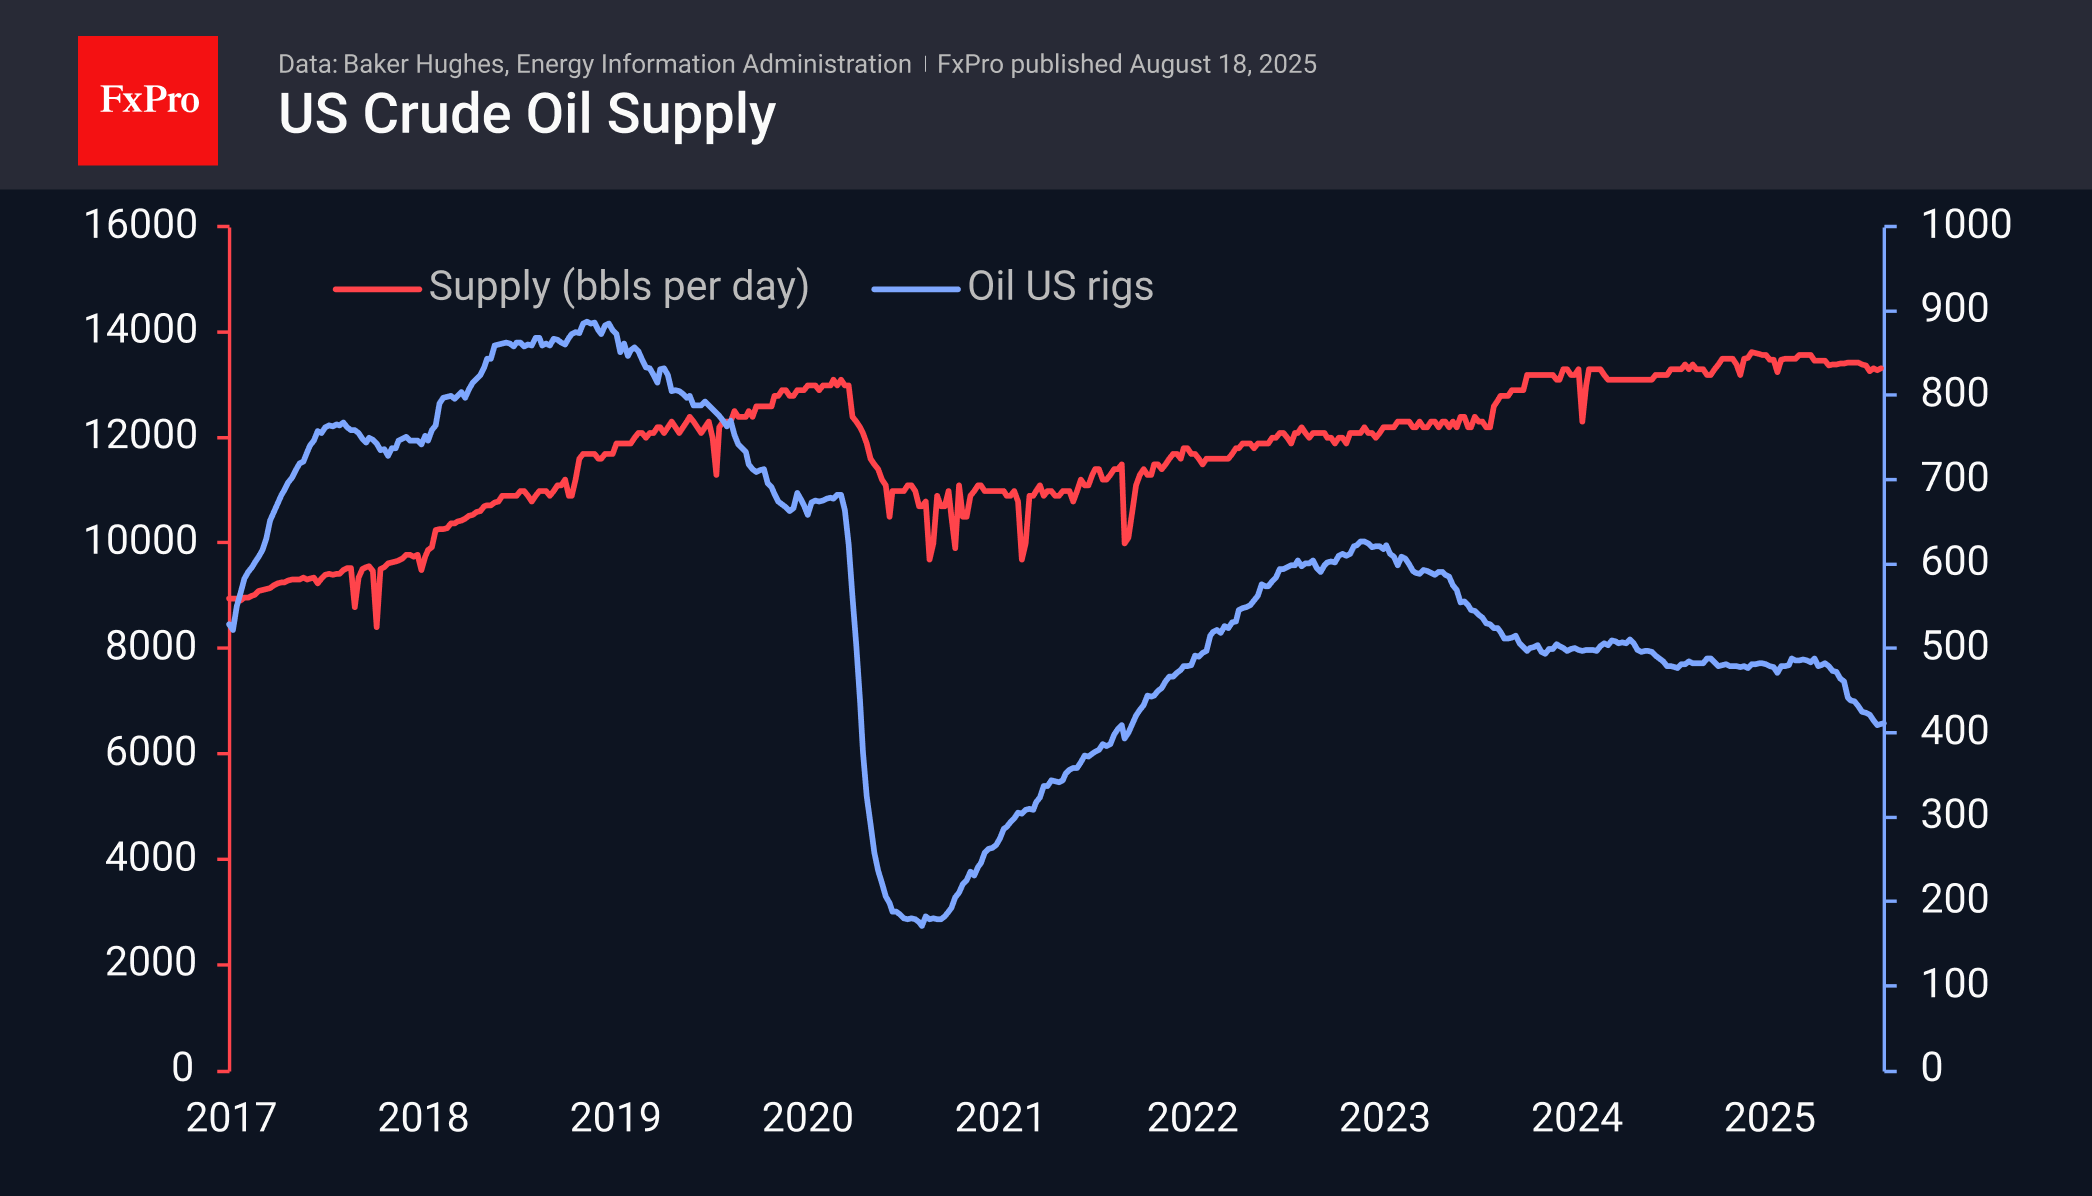
Meanwhile, natural gas production in the US is setting records and contributing to the energy surplus.
The difficult situation for oil is also indicated by the reluctance of this commodity to respond to the growth in risk appetite in recent weeks, when hopes for monetary policy easing pushed markets to historic highs.
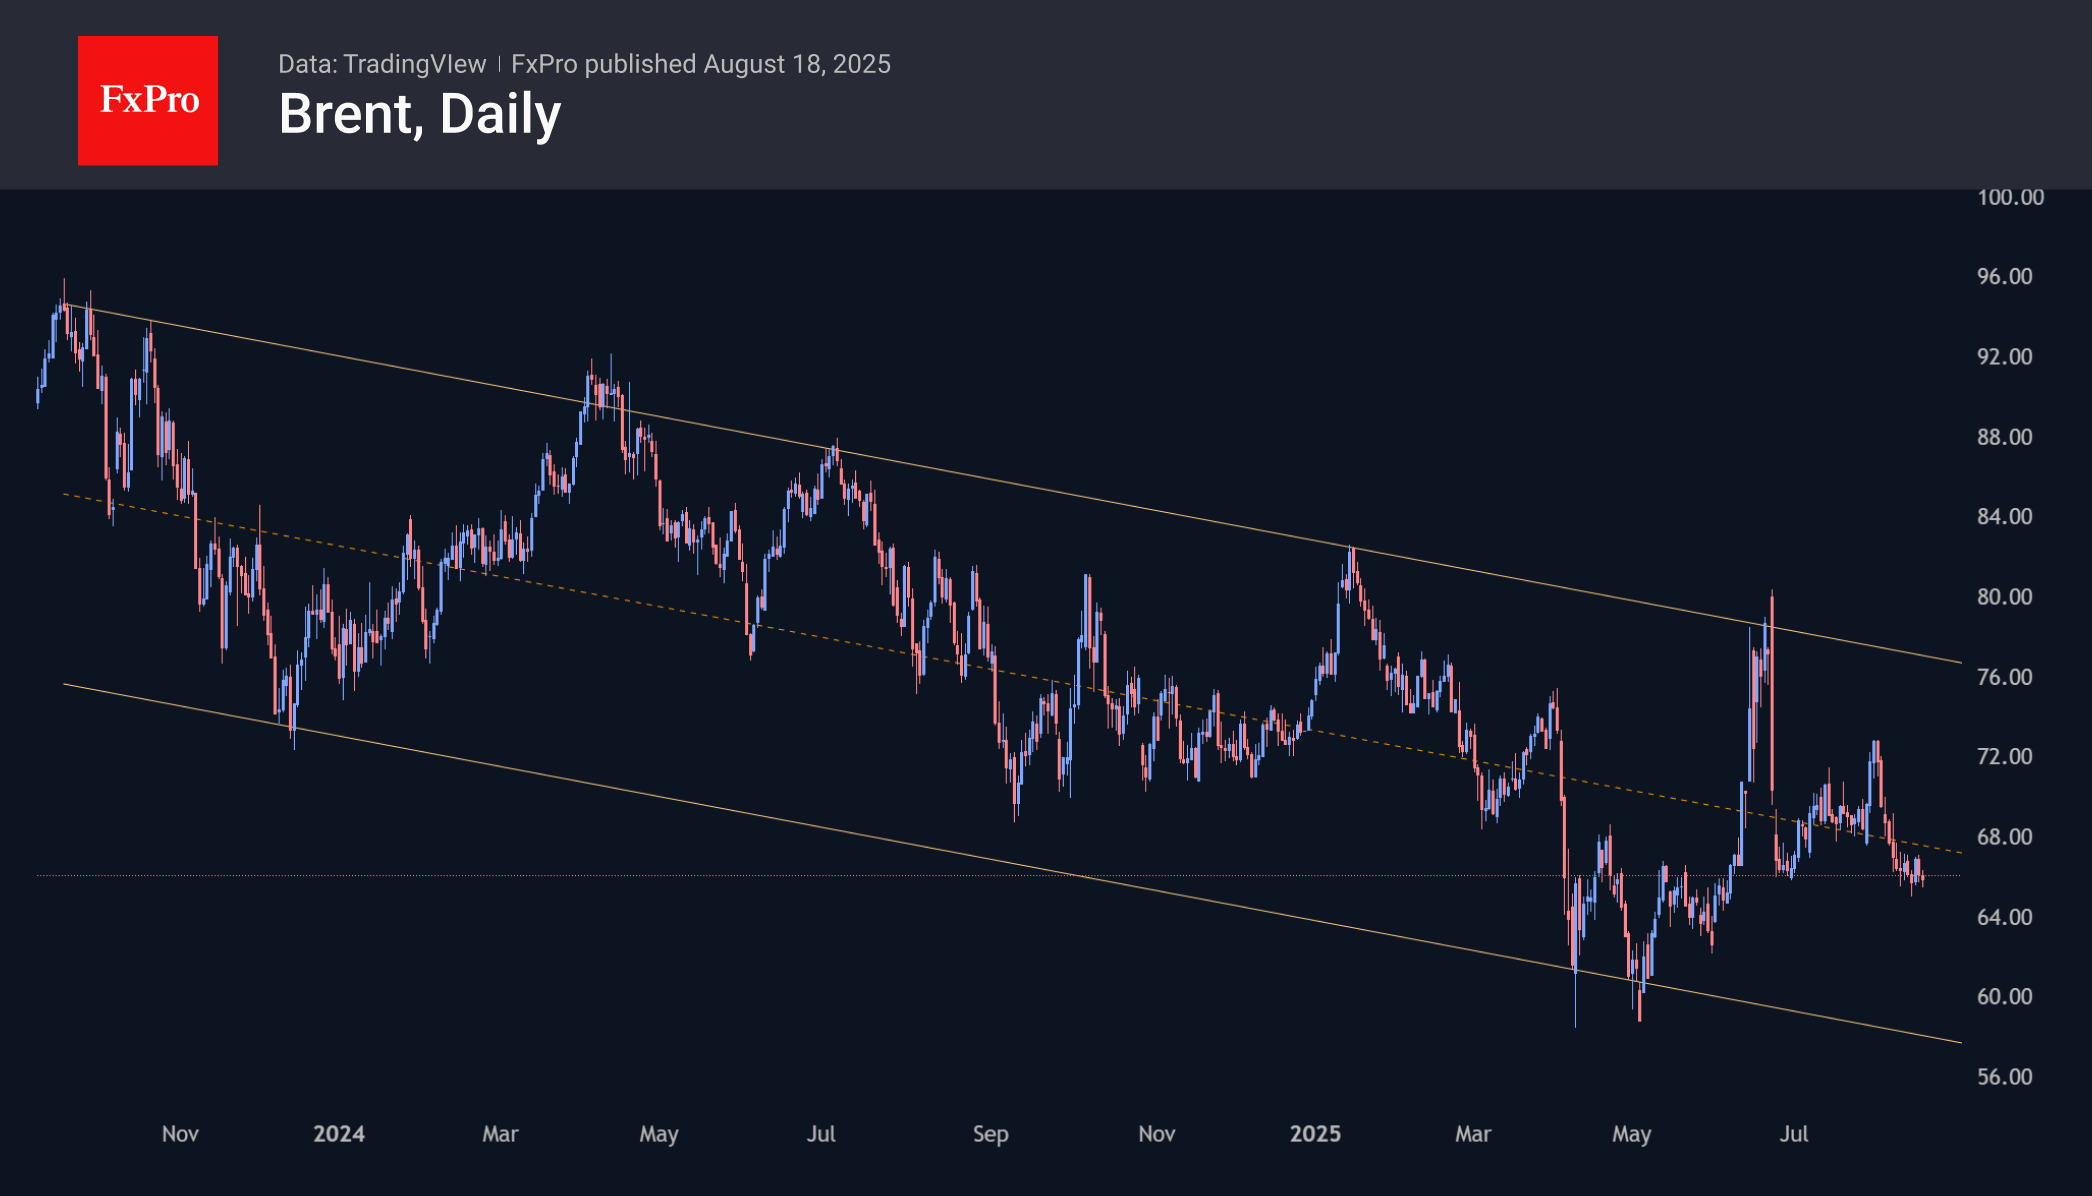
In such conditions, it is reasonable to expect oil prices to continue drifting downward, with the potential to renew the lows of early May — $55 for WTI and $58 for Brent — before the end of September. In the fourth quarter of this year, the price may well test the lower boundary of the downward channel, setting these lows another $5 below those of May.
Sunset Market Comentary
Markets
Friday’s European bear steepening trend took a breather today. Changes on the German yield curve range between -1 bp (2-yr) and -2.7 bps (30-yr). The German 30-yr yield holds above previous technical resistance (3.26%). Last week’s steepening could have been somewhat in anticipation of the Trump-Putting meeting in Alaska with European markets starting to contemplate some kind of reflationary rebuilding vibes. While US President Trump touted the summit a “10 out of 10”in a post-meeting interview, no formal agreement was reached: “There’s no deal until there’s a deal”. A first follow-up meeting takes place in Washington today as Trump meets with Ukrainian President Zelenskyy, NATO president Rutte and several other EU leaders. Security guarantees for Ukraine even without full NATO membership are high on the (European) agenda as well as setting up a three-way summit out of this conflict. Territorial concessions are probably the key to unlock the stalemate, but remain strongly opposed by Kyiv. Chances on a near-term breakthrough seem small though. The US dollar is marginally stronger today with EUR/USD drifting back below 1.17, but holding within the narrow 1.16-1.18 range in place since the start of Summer (only temporarily breached on FOMC-payrolls combo end July/early August).
Today’s eco calendar is uninspiring. Tomorrow unfortunately has little to offer neither. The first meaningful release are Wednesday’s UK inflation numbers. UK (money) markets have been retreating on additional BoE rate cut bets for this year after this month’s hawkish (close call) 25 bps rate cut. New CPI projections suggested UK inflation to peak at higher levels in September (4% instead of 3.7%), making it even difficult to stick to the current gradual quarterly cutting pace. Odds for such move fell to as low as 30%. It created some short term breathing space for sterling with EUR/GBP testing 0.86 support last week. Medium prospects for the UK currency remain weak though with fiscal issues and vulnerability in the Gilt market likely to pop up again in autumn. Global PMI surveys are due on Thursday but are overshadowed by this week’s main event: Fed chair Powell’s keynote address at the Jackson Hole symposium on Friday. The key question being whether he prepares markets for a policy turn at the September 17 FOMC meeting, ie backing gradual rate cuts to counter downside risks to the Fed’s maximum employment mandate instead of sticking with the current stability to fight upside inflation risks. We fear Powell will keep his cards close to his chest. The jury remains out on the issue with payrolls (Sept 5) and CPI (Sept 11) reports likely to be decisive. A 25 bps rate cut is the base scenario.
News & Views
Rating agency Fitch this morning confirmed New Zealand’s AA+ credit rating with a stable outlook. The agency mentions a commitment to prudent fiscal policies across the county’s political spectrum even as the government in its May 2025 budget statement indicated it would only return to fiscal balance by the fiscal year ending 2029. Fitch expects the budget deficit to gradually decline to 3.6% of GDP in 2027 from around 4.2% in FY 25 and FY 26 on expenditure restraint and a cyclical recovery. Regarding the debt level, Fitch projections build in a large 3 ppts of GDP improvement between TY 26 and FY 29. After rising from 51% in 2025 to a peak of 56% in 2027, Fitch expects GG debt resuming a strong downward trend. The rating agency expects 1.2% GDP growth in 2025, to pick up to 2.5% in 2026 and 2026. Exports to the US account for only 2% of GDP, limiting the economy’s vulnerability to higher tariffs. Inflation in Q2 rose slightly to 2.7%, but Fitch still expects the RBNZ to cut its policy rate by a further 25bps to 3% this year. Fitch mentions external debt to remain elevated compared the median of this rating category. The current account deficit narrowed to a still high 6.1% of GDP in 2024.
The National Bank of Poland (NBP) today published its calculations for core inflation for the month of July. Inflation net of food and energy prices amounted to 0.3% M/M and 3.3% Y/Y (from 3.4%). The measure excluding administered prices printed at 0.2% M/M and 2.7% Y/Y (from 2.5%) . The measure excluding the most volatile prices was 0.6% M/M and 3.9% Y/Y (from 4.5%). The headline figure was already released earlier at 0.3% M/M and 3.1% Y/Y. As such it returned within the NBP’s 2.5% +/- 1.% inflation tolerance band. The National Bank of Poland reduced its policy rate by 25 bps to 5% at the early July meeting. The next meeting is scheduled for September 3rd. The zloty strengthened slightly today (EUR/PLN 4.251) but recently held in a very tight sideways consolidation pattern. (EUR/PLN 4.235/4.2875).
EUR/USD Mid-Day Outlook
Daily Pivots: (S1) 1.1662; (P) 1.1689; (R1) 1.1731; More...
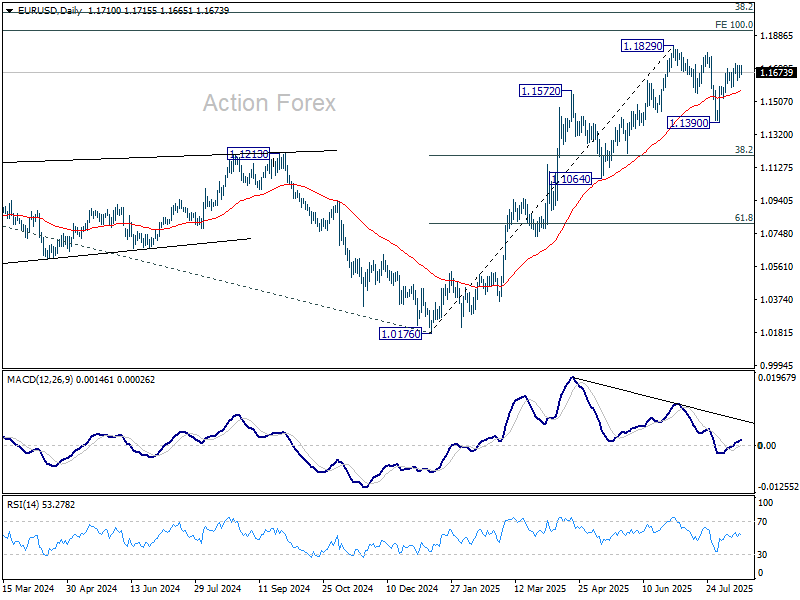
EUR/USD extending sideway trading below 1.1729 and intraday bias stays neutral. Further rally is expected as long as 1.1589 support holds. Above 1.1729 will bring retest of 1.1829 high. On the downside, however, firm break of 1.1589 will turn bias to the downside, and extend the corrective pattern from 1.1829 with another fall.
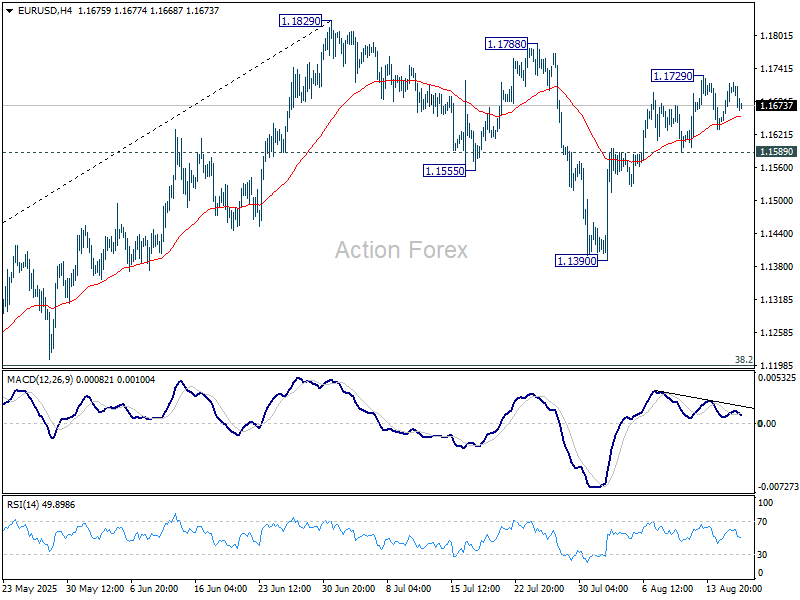
In the bigger picture, rise from 0.9534 long term bottom could be correcting the multi-decade downtrend or the start of a long term up trend. In either case, further rise should be seen to 100% projection of 0.9534 to 1.1274 from 1.0176 at 1.1916. This will remain the favored case as long as 1.1604 support holds.
GBP/USD Mid-Day Outlook
Daily Pivots: (S1) 1.3532; (P) 1.3553; (R1) 1.3581; More...
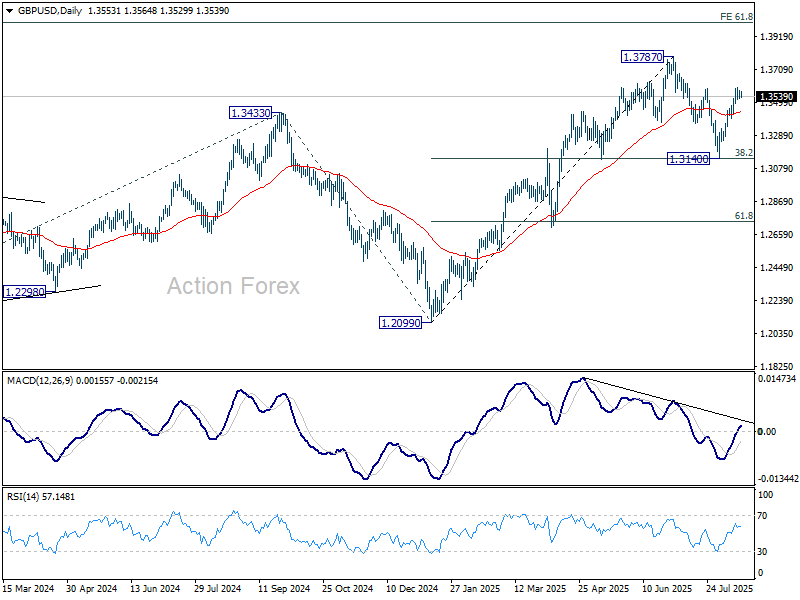
GBP/USD is extending consolidations below 1.3594 and intraday bias stays neutral. Deeper pullback might be seen but downside should be contained well above 1.3398 support. On the upside, break of 1.3594 will resume the rise from 1.3140 to retest 1.3787 high.
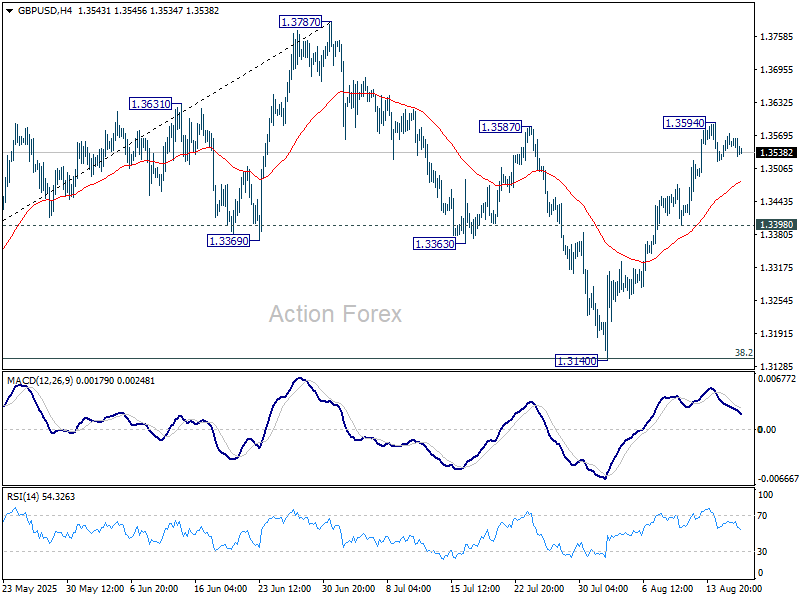
In the bigger picture, up trend from 1.3051 (2022 low) is in progress. Next medium term target is 61.8% projection of 1.0351 to 1.3433 from 1.2099 at 1.4004. Outlook will now stay bullish as long as 55 W EMA (now at 1.3090) holds, even in case of deep pullback.
USD/CHF Mid-Day Outlook
Daily Pivots: (S1) 0.7997; (P) 0.8040; (R1) 0.8110; More….
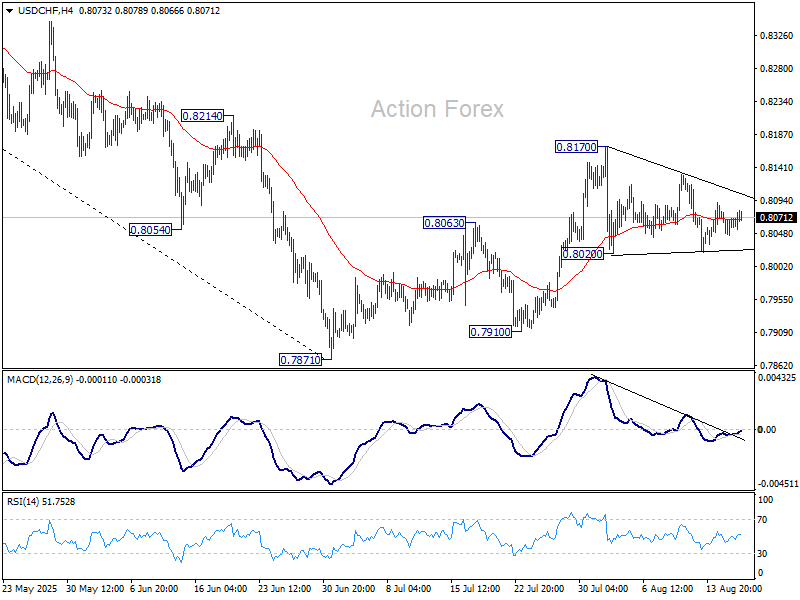
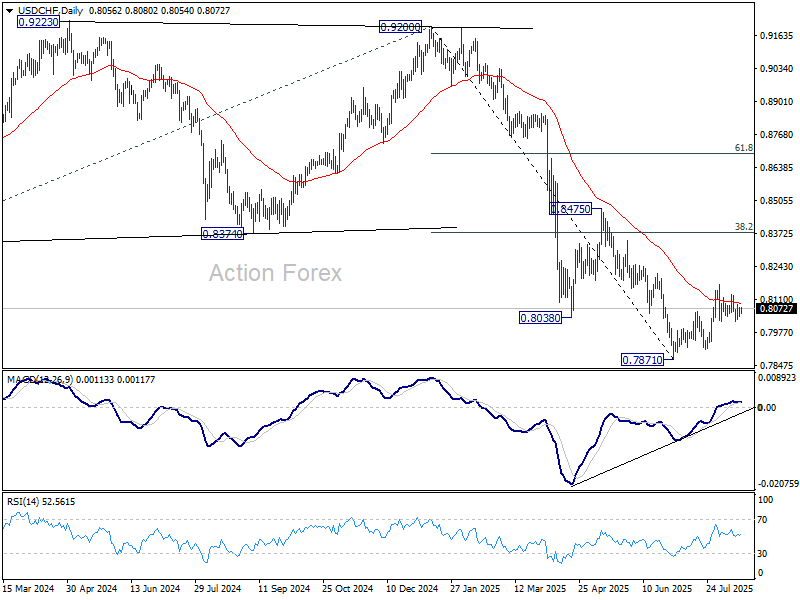
In the bigger picture, long term down trend from 1.0342 (2017 high) is still in progress. Next target is 100% projection of 1.0146 (2022 high) to 0.8332 from 0.9200 at 0.7382. In any case, outlook will stay bearish as long as 0.8475 resistance holds.
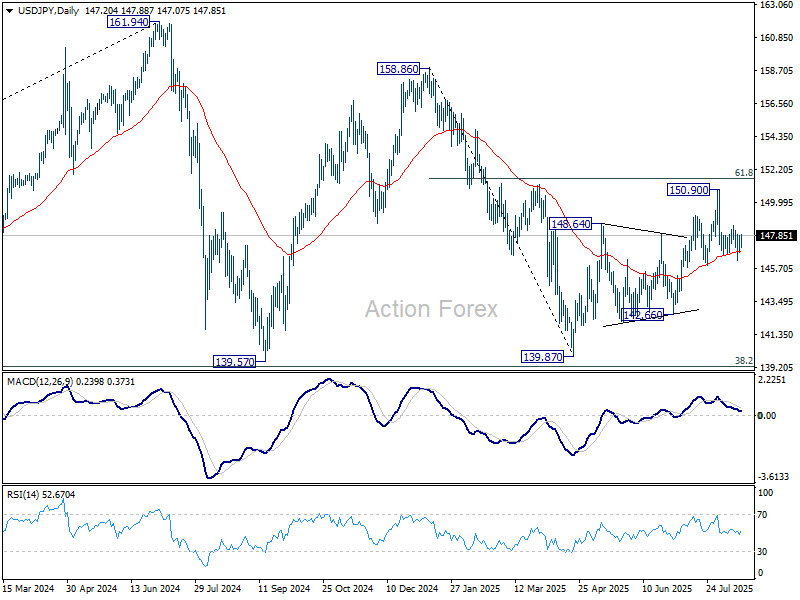
USD/JPY Mid-Day Outlook
Daily Pivots: (S1) 146.61; (P) 147.29; (R1) 147.83; More...
USD/JPY recovers notably in early US session but stays well inside range of 146.20/148.51. Intraday bias remains neutral. On the upside, break of 148.51 will indicate that the pullback from 150.90 has completed, and bring retest of this high. This will also keep the whole rise from 139.87 alive. However, firm break of 145.84 support will argue that the rebound from 139.87 has completed, and turn near term outlook bearish.
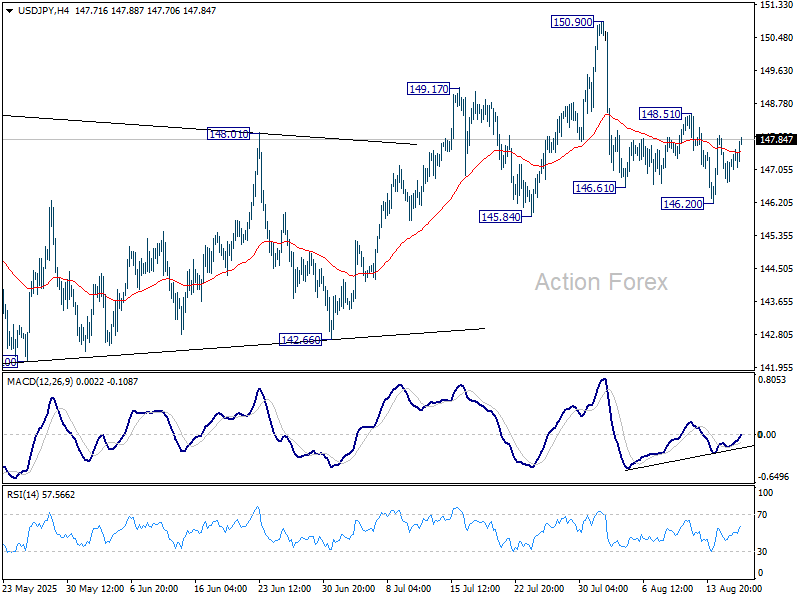
In the bigger picture, price actions from 161.94 (2024 high) are seen as a corrective pattern to rise from 102.58 (2021 low). Decisive break of 61.8% retracement of 158.86 to 139.87 at 151.22 will argue that it has already completed with three waves at 139.87. Larger up trend might then be ready to resume through 161.94 high. In case the corrective pattern extends with another fall, strong support is expected from 38.2% retracement of 102.58 to 161.94 at 139.26 to bring rebound.
Yen Dips in Sluggish Markets, Eyes on Trump-Zelenskyy Talks
Trading across global markets is subdued today, with Asia and the West pulling in different directions. Japan’s Nikkei hit a fresh record high, but European equities and US futures slipped modestly, leaving overall sentiment sluggish.
Some attention is turning to Washington, where US President Donald Trump hosts Ukrainian President Volodymyr Zelenskyy, followed by joint talks with European leaders. The effort is framed as a bid to advance toward ending the war in Ukraine, but expectations remain muted. Observers stress that negotiations involving Russia, Ukraine, Europe, and the US are still in their infancy. Trump’s recent meeting with Putin showed how entrenched positions remain, making it clear that the road to even a ceasefire will be long and fraught. Markets are tempering hopes accordingly.
In FX, Yen came under renewed selling pressure as the US session commences, making it the day’s weakest performer, followed by Euro and Sterling. A focus is on whether USD/JPY can break above 148.51 resistance, which would confirm the pullback from 150.90 has ended and open the way for a broader Yen decline. By contrast, Loonie is leading gains, followed by Kiwi and Aussie. Dollar and Swiss Franc are trading in the middle of the pack.
In Europe, at the time of writing, FTSE is down -0.09%. DAX is down -0.32%. CAC is down -0.80%. UK 10-year yield is up 0.002 at 4.698. Germany 10-year yield is down -0.029 at 2.761. Earlier in Asia, Nikkei rose 0.77%. Hong Kong HSI fell -0.37%. China Shanghai SSE rose 0.85%. Singapore Strait Times fell -1.02%. Japan 10-year JGB yield rose 0.006 to 1.572.
EU exports stagnate as US, China imports surge
Eurozone recorded a EUR 7.0B surplus in goods trade in June, as modest export growth was outpaced by stronger imports. Exports ticked up 0.4% yoy to EUR 237.2B, while imports jumped 6.8% yoy to EUR 230.2B.
Across the EU as a whole, goods surplus narrowed to EUR 8.0B. Exports held steady at EUR 213.7B, but imports rose 6.4% yoy to EUR 205.7B.
Trade with major partners showed contrasting trends. EU exports to the US and China dropped sharply, down -10.3% yoy and -12.7% yoy, while exports to the UK grew 7.4% yoy.
At the same time, imports from the US and China surged by 16.4% yoy and 167% yoy respectively, while UK shipments into the EU declined -3.6% yoy.
NZ BNZ services uptick to 48.9, contraction persists
New Zealand’s BusinessNZ Performance of Services Index improved slightly in July, rising from 47.6 to 48.9. But the sector remained in contraction for the sixth consecutive month. Also, the latest reading is still well below the long-run survey average of 52.9.
Details showed mixed conditions. Activity/Sales stayed in contraction at 47.5, and New Orders stalled at 50.0. On the positive side, Inventories expanded for the second month at 51.4. Employment component slid to 47.1, extending its losing streak to 20 months.
Business sentiment, while slightly less negative, continued to reflect difficult conditions. Around 58.5% of comments were pessimistic, down from 66.2% in June. Firms pointed to declining sales, reduced spending, and persistent cost-of-living pressures. Inflation, high interest rates, weather disruptions, staffing shortages, and global uncertainty all weighed on confidence.
NZD/USD stuck in falling channel as RBNZ shadow board splits
NZD/USD is trading quietly within range, with investors cautious ahead of RBNZ’s policy decision this Wednesday. Market consensus is for a 25bps cut, though the NZIER Shadow Board revealed a broad spread of opinions, from a 50bps reduction to no move at all. The diversity highlights some uncertainty surrounding the policy outlook.
According to the Shadow Board, the case for a cut is backed by persistent slack in the labor market and subdued domestic activity. Still, near-term inflation pressures complicate the picture. While one board member argued for a more aggressive 50bps cut to support growth, two stressed the risks of loosening again with price pressures still elevated.
Looking further ahead, views on the OCR in 12 months are diverse, from no additional easing to further cuts required. One member sees strong commodity prices and lower rates supporting activity, with inflation potentially rising toward the top of the RBNZ’s 1–3% target band. That backdrop suggests patience may be prudent. Though, two members maintain the economy will still need further stimulus beyond August.
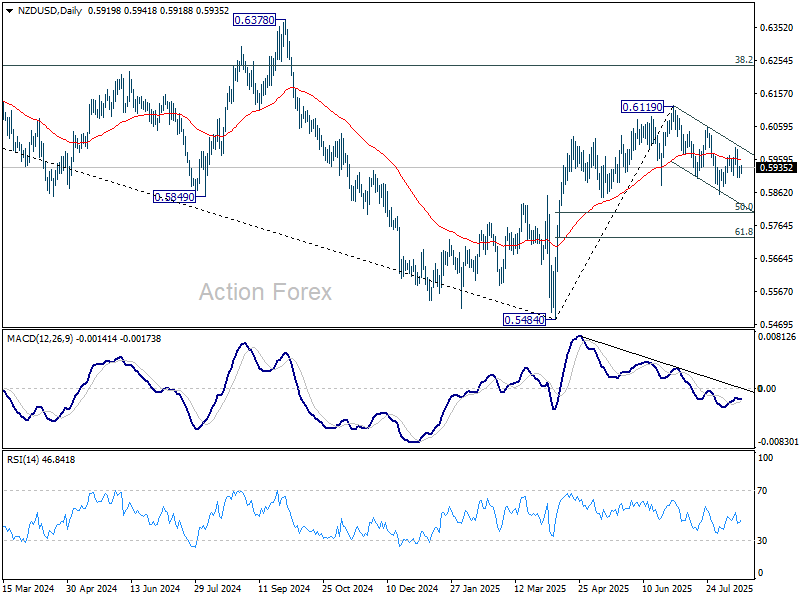
Technically, NZD/USD remains mildly bearish as its stays confined within the near-term falling channel. Rebound from 0.5855 appears to have topped out at 0.5995. Fall from there is seen as another leg of the decline from 0.6119.
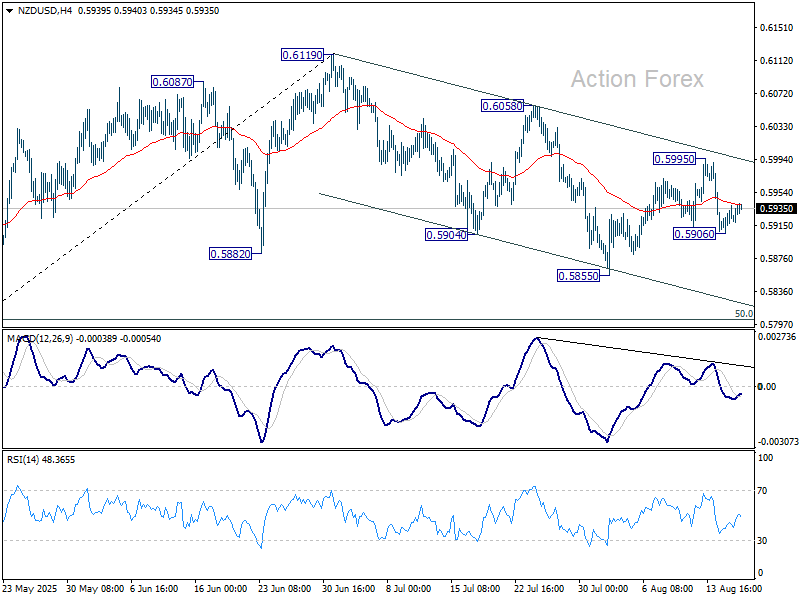
Structurally, while the pullback from 0.6119 looks corrective, risks are skewed toward another dip. A slide to 50% retracement of 0.5484 to 0.6119 at 0.5802 is in favor before NZD/USD finds a firmer base.
USD/JPY Mid-Day Outlook
Daily Pivots: (S1) 146.61; (P) 147.29; (R1) 147.83; More...
USD/JPY recovers notably in early US session but stays well inside range of 146.20/148.51. Intraday bias remains neutral. On the upside, break of 148.51 will indicate that the pullback from 150.90 has completed, and bring retest of this high. This will also keep the whole rise from 139.87 alive. However, firm break of 145.84 support will argue that the rebound from 139.87 has completed, and turn near term outlook bearish.
In the bigger picture, price actions from 161.94 (2024 high) are seen as a corrective pattern to rise from 102.58 (2021 low). Decisive break of 61.8% retracement of 158.86 to 139.87 at 151.22 will argue that it has already completed with three waves at 139.87. Larger up trend might then be ready to resume through 161.94 high. In case the corrective pattern extends with another fall, strong support is expected from 38.2% retracement of 102.58 to 161.94 at 139.26 to bring rebound.