Sample Category Title
Germany’s Ifo business climate rises to 88.5, services and construction lead sentiment rebound
Germany’s Ifo Business Climate index rose from 87.5 to 88.4 in June, modestly above expectations. Expectations Index jumped to 90.7 from 88.9, while Current Assessment Index edged up only slightly from 86.1 to 86.2. Ifo said the economy is “slowly building confidence”.
Sector details showed the clearest momentum in services, where firms raised expectations significantly, especially among business-related providers. Manufacturing also saw better sentiment ahead, though order books remain under pressure. Construction extended its recovery trend, with expectations hitting the highest level since early 2022. Wholesale trade led the modest rebound in commerce, but retail conditions slipped again.

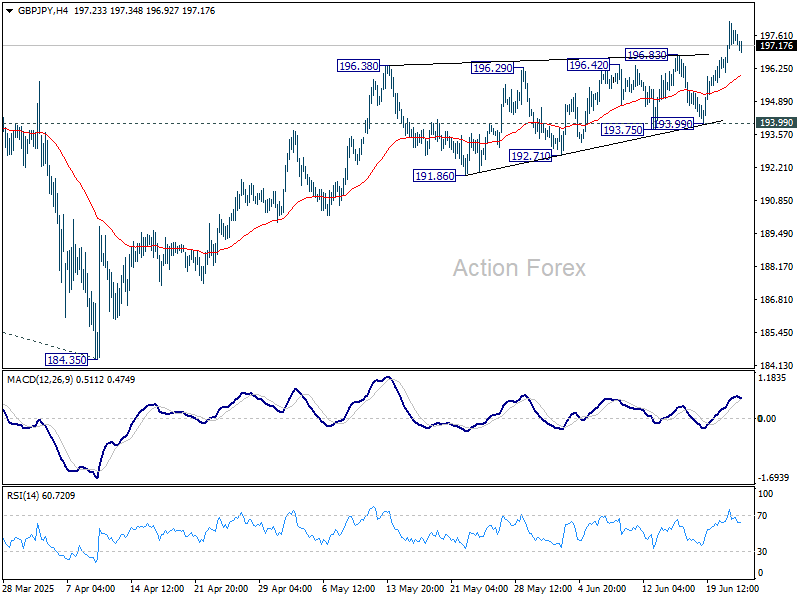
GBP/JPY Daily Outlook
Daily Pivots: (S1) 196.51; (P) 197.35; (R1) 198.50; More...
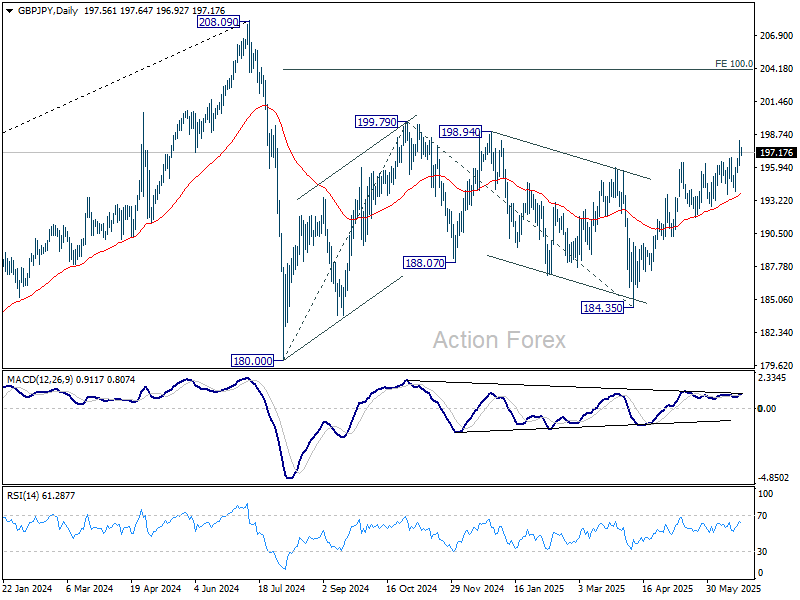
Intraday bias in GBP/JPY remains mildly on the upside for the moment. Current rise from 184.35 should target 199.79 resistance. Break there will target 100% projection of 180.00 to 199.79 from 184.35 at 204.14. For now, near term outlook will stay bullish as long as 193.99 support holds, in case of retreat.
In the bigger picture, price actions from 208.09 are seen as a correction to rally from 123.94 (2020 low). Strong support should be seen from 38.2% retracement of 123.94 to 208.09 at 175.94 to contain downside. However, sustained break of 175.94 will bring deeper fall even still as a correction.
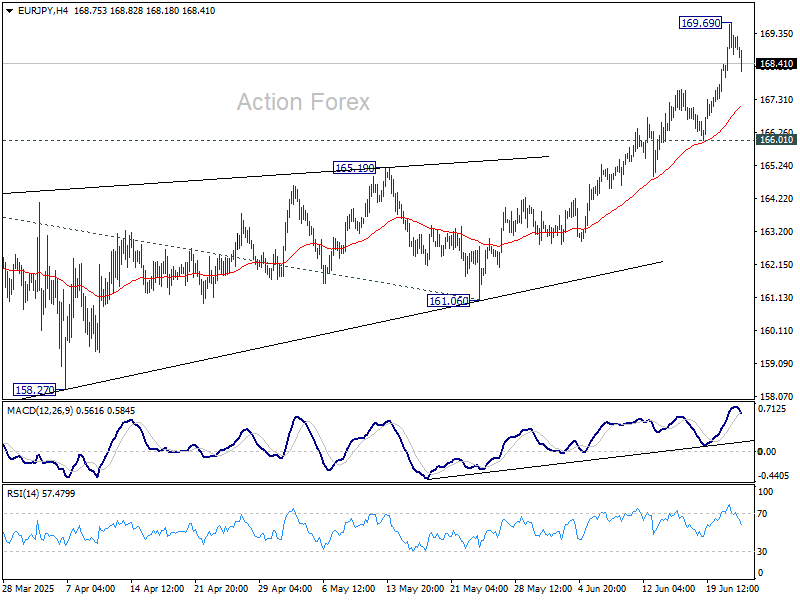
EUR/JPY Daily Outlook
Daily Pivots: (S1) 168.26; (P) 168.99; (R1) 169.97; More...
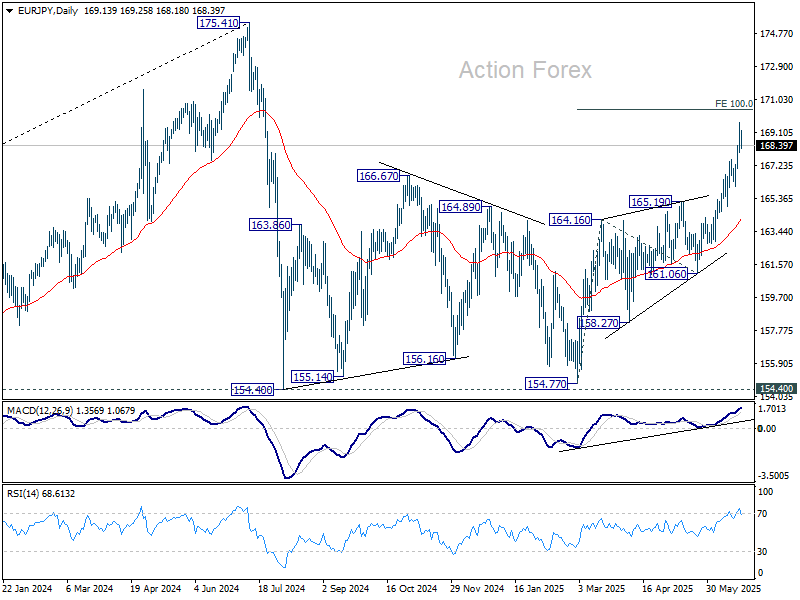
Intraday bias in EUR/JPY is turned neutral first with current retreat and some consolidations could be seen. Further rally is expected as long as 166.01 support holds. Break of 169.69 temporary top will resume the rise from 154.77 and target 100% projection of 154.77 to 165.19 from 161.06 at 170.45.
In the bigger picture, price actions from 175.41 are seen as correction to up trend from 114.42 (2020 low). Strong support should be seen from 38.2% retracement of 114.42 to 175.41 at 152.11 to contain downside. However, sustained break of 152.11 will bring deeper fall even still as a correction.
EUR/GBP Daily Outlook
Daily Pivots: (S1) 0.8546; (P) 0.8560; (R1) 0.8576; More...
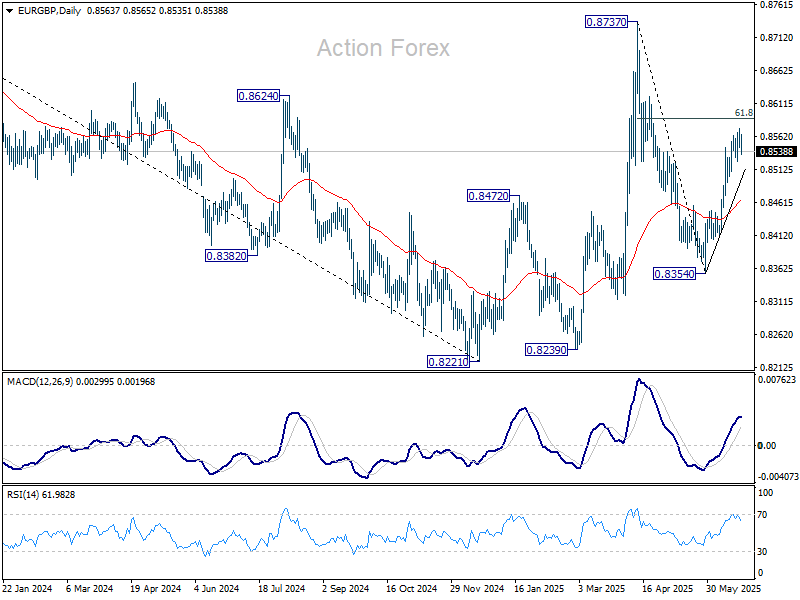
Intraday bias in EUR/GBP is turned neutral first with current retreat. Further rise is mildly in favor as long as 0.8492 support holds. Above 0.8573 temporary top will target r 61.8% retracement of 0.8737 to 0.8354 at 0.8591. Firm break there will pave the way to 0.8373 resistance.
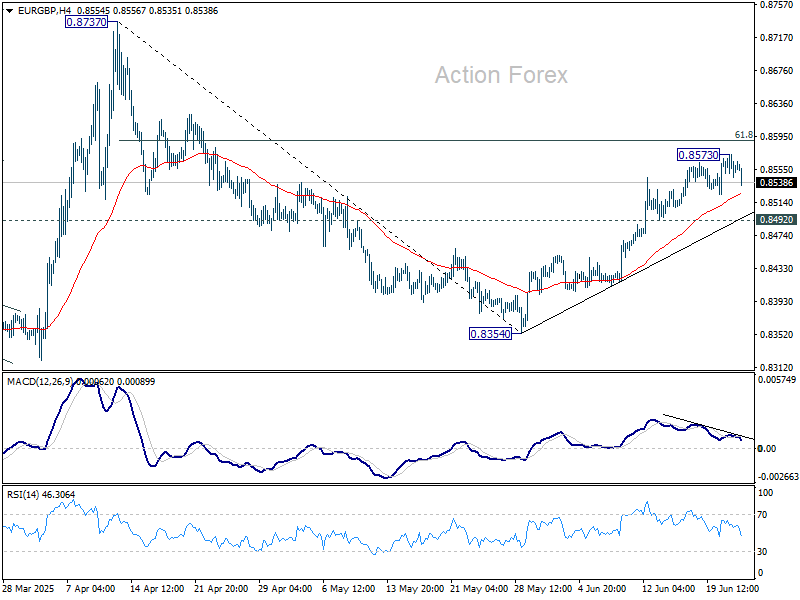
In the bigger picture, price actions from 0.8221 medium term bottom are merely forming a corrective pattern to the down trend from 0.9267 (2022 high). Nevertheless, there is no clear momentum to break through 0.8201 key support (2022 low) yet. Hence, range trading is expected between 0.8221/8737 for now.
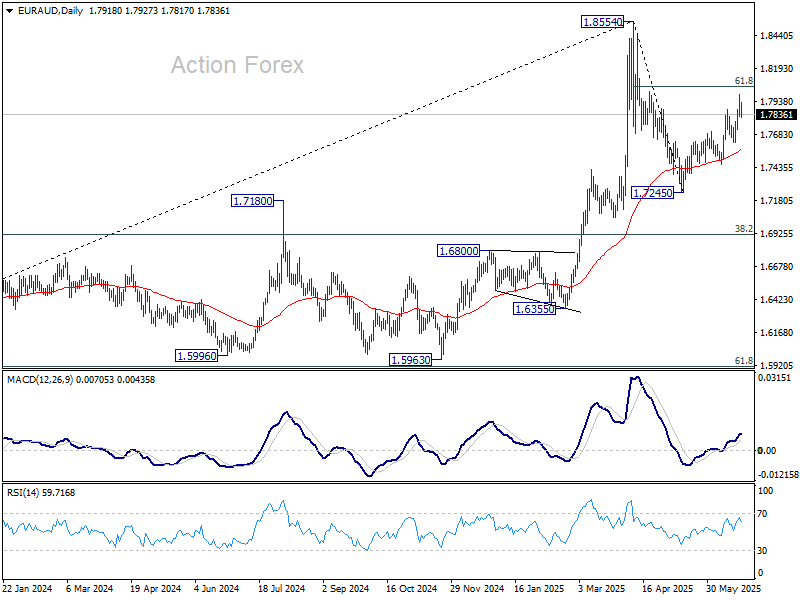
EUR/AUD Daily Outlook
Daily Pivots: (S1) 1.7828; (P) 1.7910; (R1) 1.8007; More...
Intraday bias in EUR/AUD is turned neutral with current retreat. Further rise is expected as long as 1.7626 support holds. Above 1.7989 will target 61.8% retracement of 1.8554 to 1.7245 at 1.8054. Firm break there will pave the way to 1.8554.
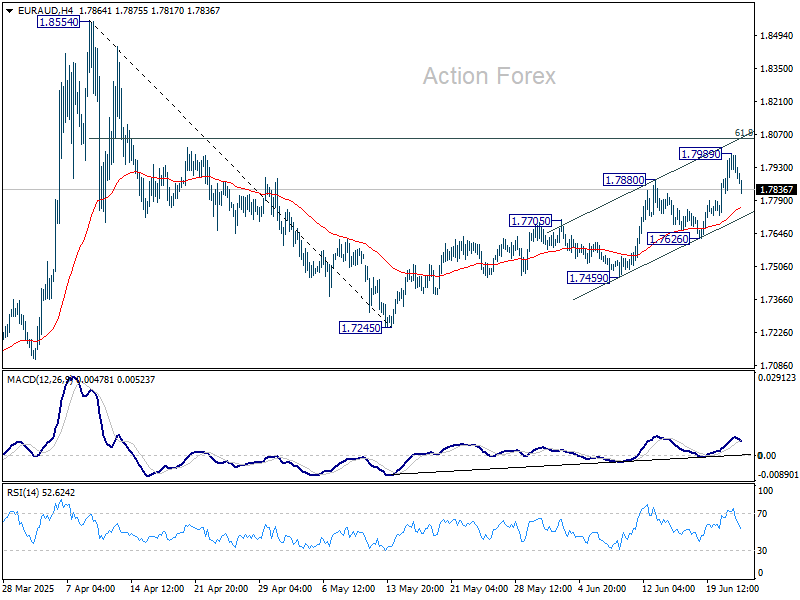
In the bigger picture, price actions from 1.8554 medium term are currently seen as a corrective pattern. While deeper pullback might be seen, downside should be contained by 38.2% retracement of 1.4281 (2022 low) to 1.8554 at 1.6922 to bring rebound. Up trend from 1.4281 is expected to resume at a later stage.
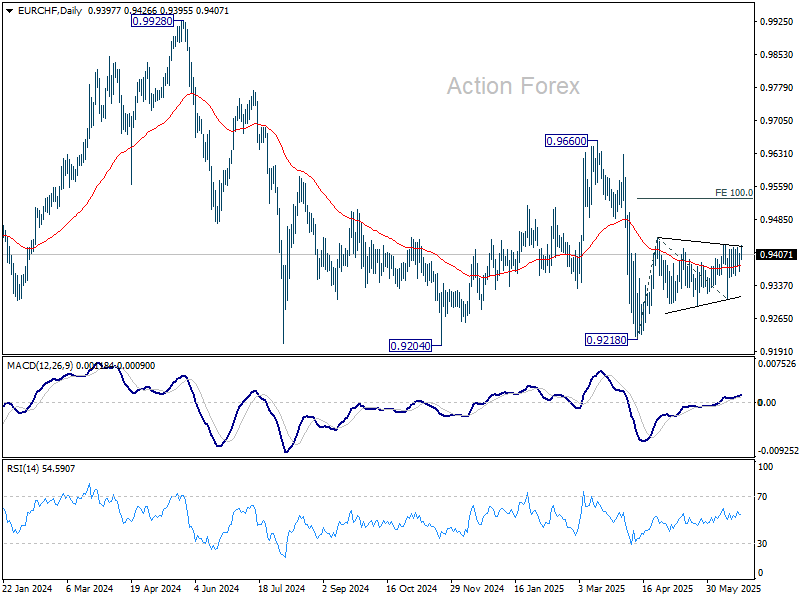
EUR/CHF Daily Outlook
Daily Pivots: (S1) 0.9377; (P) 0.9394; (R1) 0.9427; More....
EUR/CHF is still bounded in established range and intraday bias stays neutral. On the upside, break of 0.9428/45 resistance zone will resume the rebound from 0.9218, target 100% projection of 0.9218 to 0.9445 from 0.9306 at 0.9533. On the downside, break of 0.9291 will bring retest of 0.9218 low instead.
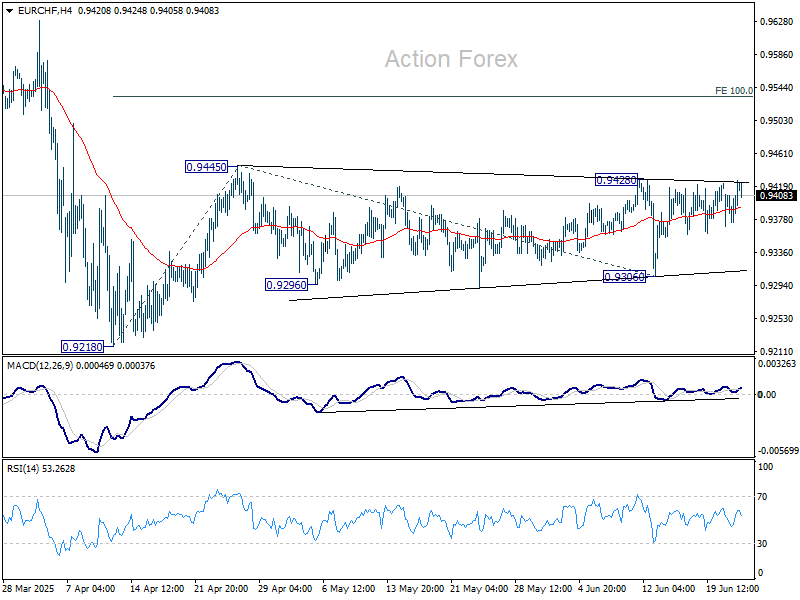
In the bigger picture, prior rejection by long-term falling channel resistance (now at 0.9511) retains medium term bearishness. That is, down trend from 1.2004 (2018 high) is still in progress. Firm break of 0.9204 (2024 low) will confirm resumption. This will remain the favored case as long as 0.9660 resistance holds.
Stock Markets Rebound Following Ceasefire Announcements in the Middle East
Last night, U.S. President Donald Trump made a social media post announcing a ceasefire agreement between Iran and Israel. According to his own words, the ceasefire is set to last “forever.” This announcement triggered a sharp bullish impulse (indicated by the blue arrow) on the S&P 500 index chart (US SPX 500 mini on FXOpen), pushing the price to a new high above the 6074 level.
Just yesterday, traders feared that the United States could be drawn into yet another costly war following bomber strikes on Iran’s nuclear facilities. However, today the stock markets are recovering, signalling growing optimism and a waning of fears over a major escalation of the conflict.
Technical Analysis of the S&P 500 Chart
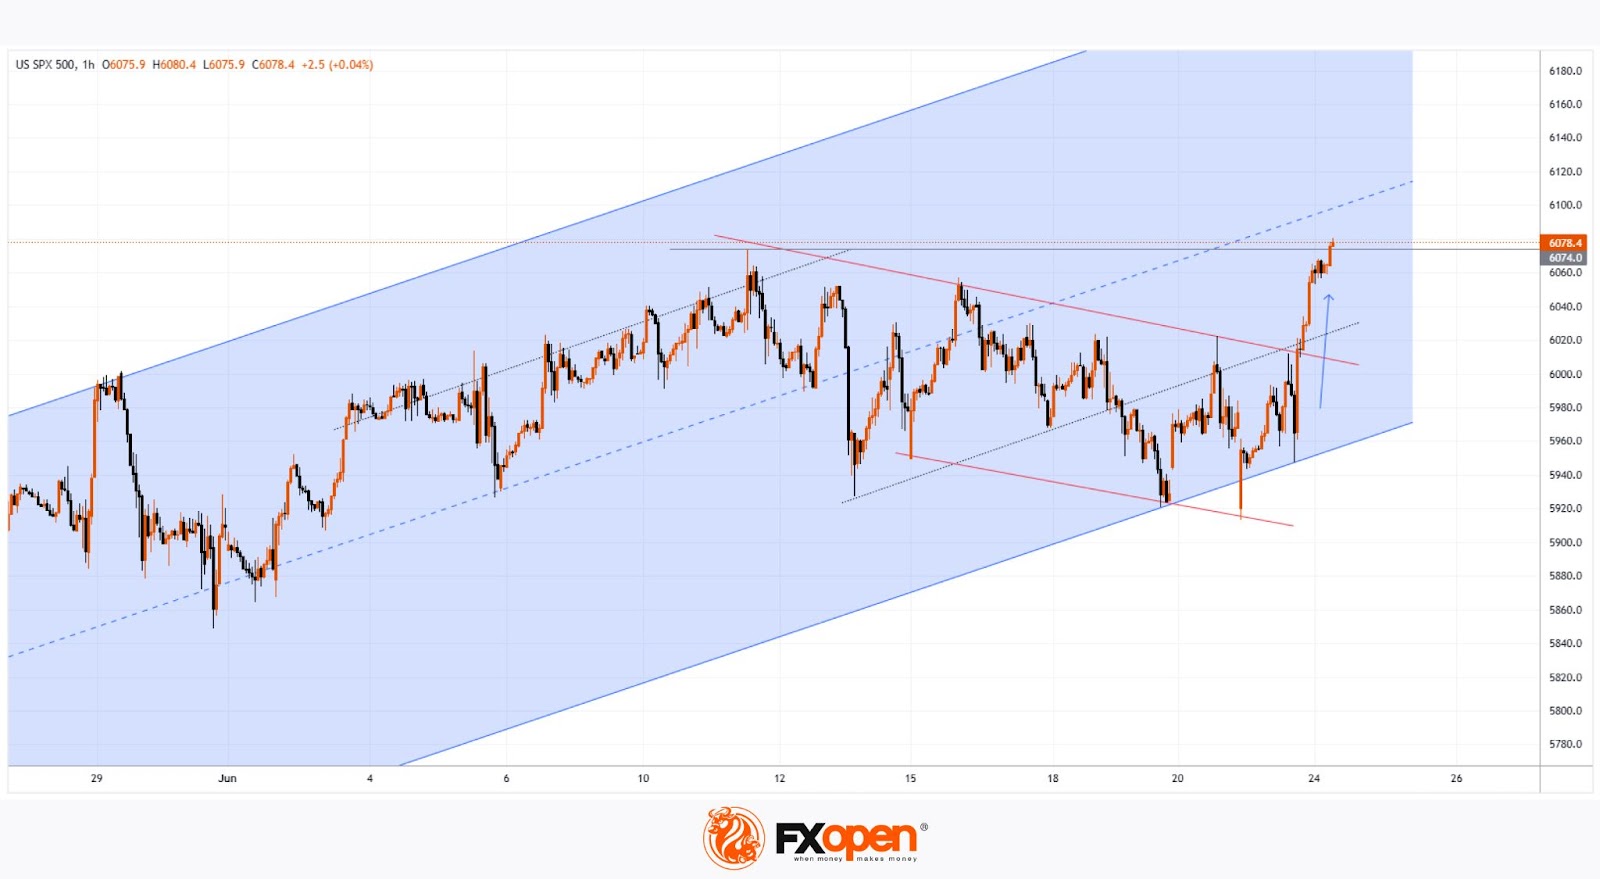
When analysing the S&P 500 index chart (US SPX 500 mini on FXOpen) seven days ago, we identified an ascending channel. The angle of the trend remains relevant, while the width of the channel has expanded due to the downward movement caused by tensions in the Middle East.
Notably:
→ the price marked the lower boundary of the channel as well as the internal lines (shown by black dots) dividing the channel into quarters;
→ the latest bullish impulse suggests that the upward trend is resuming after breaking out of the correction phase (indicated by red lines).
It is possible that in the near future, the S&P 500 index (US SPX 500 mini on FXOpen) could reach the median line of the channel. There, the price may consolidate, reflecting a balance between buyers and sellers—particularly if the peace in the Middle East proves to be lasting.
Trade global index CFDs with zero commission and tight spreads. Open your FXOpen account now or learn more about trading index CFDs with FXOpen.
This article represents the opinion of the Companies operating under the FXOpen brand only. It is not to be construed as an offer, solicitation, or recommendation with respect to products and services provided by the Companies operating under the FXOpen brand, nor is it to be considered financial advice.
Focus Well Remain on Sustainability of Isael-Iran ‘Ceasefire’
Markets
Markets yesterday felt some kind of ‘four seasons in one day experience’ with market themes/focus constantly switching throughout the day. A mild initial reaction after the weekend US air strike on Iran nuclear facilities, a growing risk-off feeling intraday, largely ignored EMU and US PMI’s and some Fed governors (Bowman, Goolsbee) fueling the debate on a July rate cut if the pass-through of tariffs costs remains limited. Later during US trading hours, markets gradually came to understand that the tensions in the Israel-US-Iran conflict might be cooling. Iranian retaliations in the form of an attack on a US military base in Qatar was limited and said to be well preannounced. Later after the close of US markets, US president Trump announced that a ceasefire between Israel and Iran had been agreed. The prospect of easing tensions caused the oil price to fall off a cliff with Brent currently trading near $70 p/b compared to levels near $80 yesterday. (US) equities, admittedly with a temporary setback, gained traction as the US trading proceeded, supported by more benign headlines from the Middle East, but also by interest rate markets taking notice of the July rate comments from Goolsbee and Bowman. The S&P closed 0.96 % in green. US yields at the end of the session eased between 4.5 bps (2-y) and 1.5 bps (30-y). Despite recent guarded ‘guidance’ from Fed Chair Powell, a 25 bps cut at the September meeting is now again almost fully discounted. German yields were little changed (about 1 bp across the curve) as the EMU PMI’s confirmed a lackluster growth performance and mixed inflation picture. Also quite an impressive intraday reversal in FX markets. The dollar outperformed on high oil prices and geopolitical uncertainty during the European session, but made a sharp U-turn initially triggered by the debate on a July Fed rate cut and accelerated by easing geopolitical tensions and the sharp drop in the oil price. DXY touched 99.40 intraday but closed at 98.41. EUR/USD rebounded from the 1.1455 area to finish the day at 1.1578. USD/JPY in a similar move tumbled from the 148 area to close at 146.15. Most smaller currency (AUD, NZD,….) facing strong headwinds intraday also reversed most/all intra-day losses.
Asian markets this morning evidently are in an outright risk-on modus after the announcement of ceasefire in the Middle East. Most indices are up between 1% and 2.0%. The dollar is losing further ground with EUR/USD regaining the 1.16 mark. In a first instance, the focus well remain on the sustainability of the Isael-Iran ‘ceasefire’. However, if it holds, other themes (Fed policy , US budget, trade) soon will return to the forefront. Regarding the data, US consumer confidence of the Conference board is worth looking at. However, even more attention will go to Fed Powell’s semi-annual appearance before House financial Committee. We assume that Bowman and Goolsbee were among the softer dots in a highly dispersed ‘forecast’ in last week’s SEP. Even so, any indication of the Fed Chair giving more weight to soft labour market tendencies and/or milder CPI risks, won’t go unnoticed at the short end of the US yield curve and might weigh further on the dollar. DXY (98.05) is nearing the YTD low (97.60). EUR/USD (1.1603) is only a whisker away from the 1.1631 top.
News & Views
The EU yesterday released its funding plan for the second half of this year. The EC intends to issue €70bn of EU bonds via 4 syndications (focus on 5y, 7y, 15y and 30y) and 6 regular bond auctions. That’s less than the €90bn targeted between January and June, but €5bn more than H2 2024. NextGenerationEU Green Bond issuances will take place via tapping of existing bonds to support the liquidity of these lines before launching a new line. As of autumn (exact date to be confirmed) the EC will implement a non-competitive auction allocation to EU primary dealers allowing for the allocation of additional amounts of auctioned bonds (20% of initially allocated auction volume) the day following the bond auction. The EC will also continue to issue EU-Bills (3m, 6m and 12m).
French President Macron and German Chancellor Merz published an op-ed in the Financial Times ahead of this week’s NATO Summit labeled “Europe must arm itself in an unstable world”. France and Germany will reaffirm their support for US efforts to bring an end to the Russian war in Ukraine. But shouldering responsibilities goes beyond Ukraine. France and Germany will aim to reach 3.5% of GDP in defense spending and 1.5% in broader expenses contributing to the defense effort in order to strengthen the European pillar of NATO. Nuclear deterrence will remain the cornerstone of the alliance’s security. Leaders also eye a reform of procurement systems by applying the “three S’s”: standardization, simplification and scale.
USD/CAD Daily Outlook
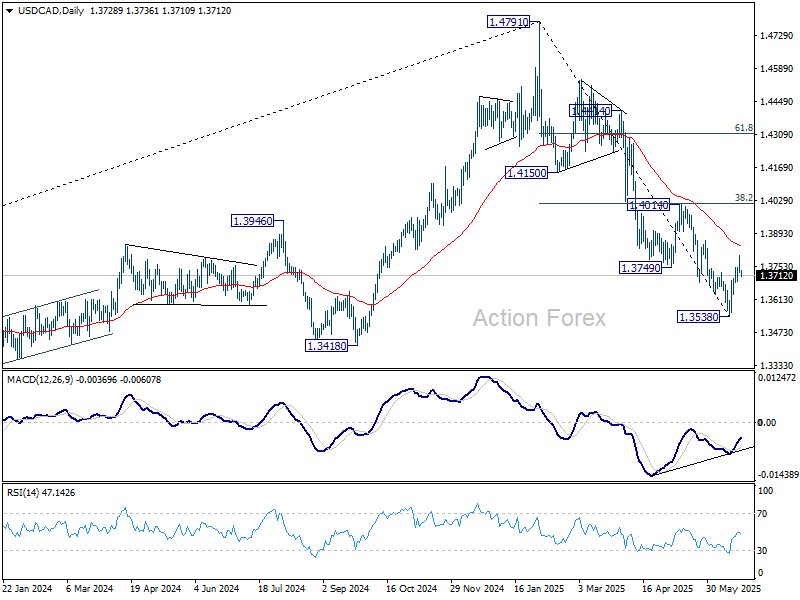
Daily Pivots: (S1) 1.3708; (P) 1.3753; (R1) 1.3782; More...
USD/CAD retreated after hitting 1.3797 and intraday bias is turned neutral first. On the upside, above 1.3797 will resume the rebound from 1.3538 short term bottom, as a correction to fall from 1.4791. But upside should be limited by 1.4014 cluster resistance (38.2% retracement of 1.4791 to 1.3538 at 1.4017), at least on first attempt. On the downside, below 1.3633 will bring retest of 1.3538 low.
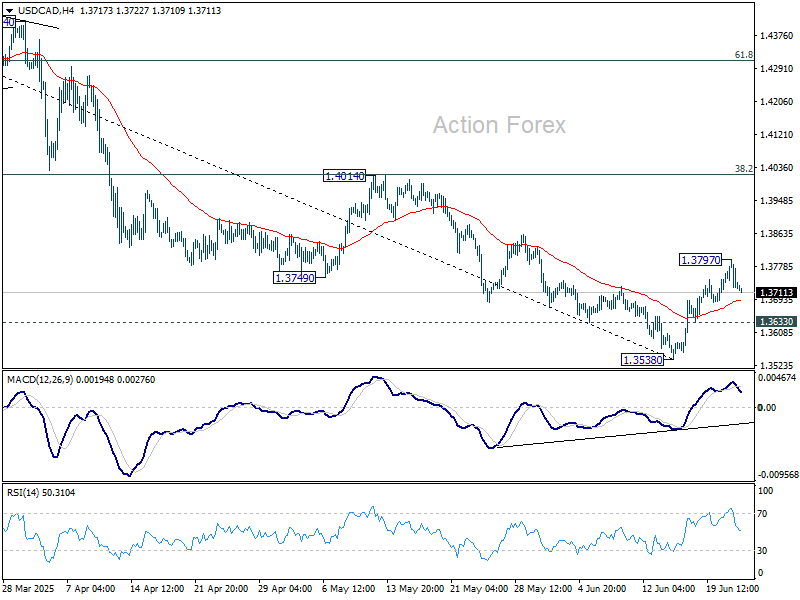
In the bigger picture, price actions from 1.4791 medium term top could either be a correction to rise from 1.2005 (2021 low), or trend reversal. In either case, further decline is expected as long as 1.4014 resistance holds. Next target is 61.8% retracement of 1.2005 (2021 low) to 1.4791 at 1.3069.
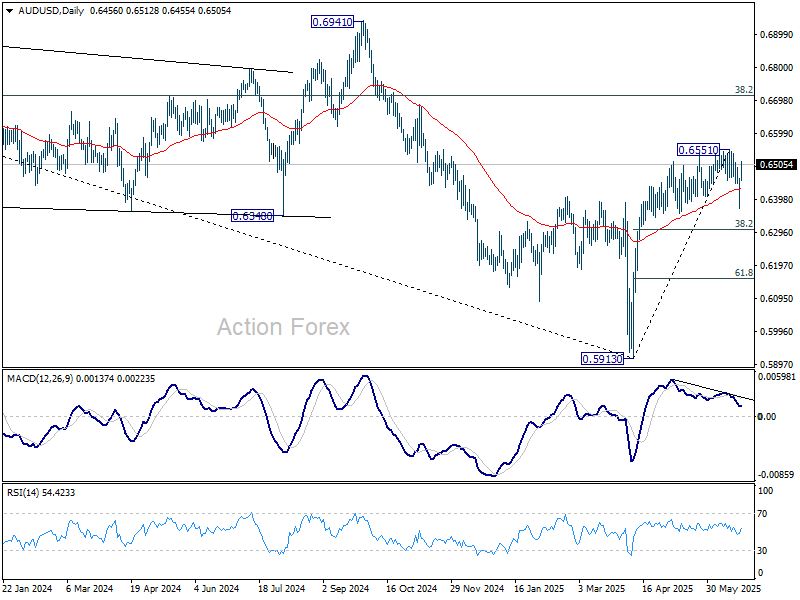
AUD/USD Daily Report
Daily Pivots: (S1) 0.6400; (P) 0.6432; (R1) 0.6490; More...
AUD/USD's strong rebound suggests that pullback from 0.6551 has completed at 0.6372 already. Intraday bias is turned neutral first. Consolidation pattern from 0.6551 could extend with another falling leg. But near term outlook will stay bullish as long as 38.2% retracement of 0.5913 to 0.6551 at 0.6307 holds. Firm break of 0.6551 will resume the rally from 0.5913.
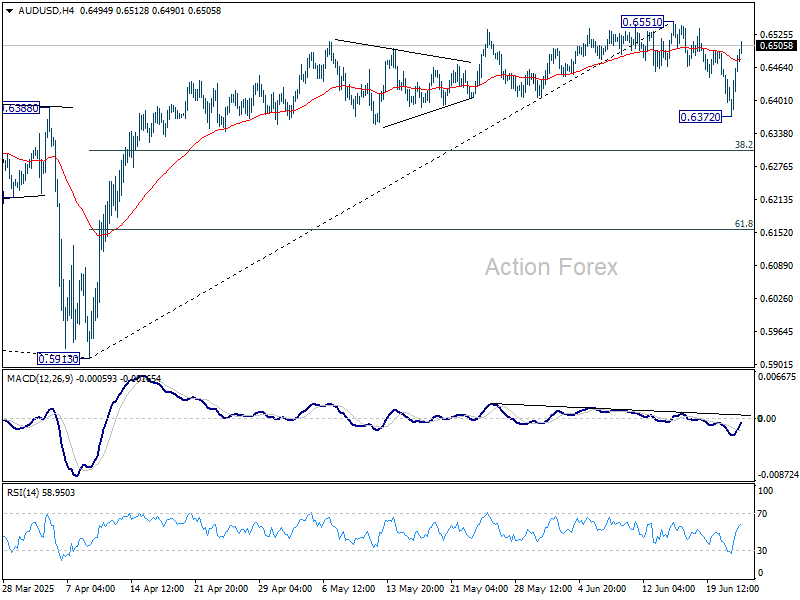
In the bigger picture, there is no clear sign that down trend from 0.8006 (2021 high) has completed. Rebound from 0.5913 is seen as a corrective move. While stronger rally cannot be ruled out, outlook will remain bearish as long as 38.2% retracement of 0.8006 to 0.5913 at 0.6713 holds. Nevertheless, considering bullish convergence condition in W MACD, even in case of another fall through 0.5913, downside should be contained above 0.5506 (2020 low).