
Sample Category Title
ECB’s Lagarde sees near-term weakness, but also resilience ahead
ECB President Christine Lagarde acknowledged in a speech that Eurozone faces "weaker prospects" in the near term. Survey data suggest slowing momentum, with higher tariffs and a stronger Euro expected to weigh on exports. Elevated uncertainty is also delaying corporate investment. Risks remain "tilted to the downside", with trade tensions, fragile market sentiment, and geopolitical instability posing ongoing threats to the outlook.
Still, Lagarde emphasized several sources of resilience. A strong labor market, rising real incomes, and robust private sector balance sheets are expected to support consumption. Recent rate cuts are also contributing to easier financing conditions, while increased spending on defence and infrastructure could help offset external headwinds.
"A swift resolution to trade and geopolitical tensions or a further increase in defence and infrastructure spending could spur activity by more than expected," Lagarde said.
On inflation, Lagarde noted the outlook is “more uncertain than usual.” Trade frictions are creating both upward and downward pressures—supply chain fragmentation could lift prices, while weaker global demand may suppress Eurozone export growth.
Yen Slides on Oil Supply Jitters After US Attack on Iran
The Japanese yen has started the week with sharp losses. In the European session, USD/JPY has jumped 1.2% on the day and is trading at 147.82. The yen has fallen to five-week lows against the US dollar.
Yen sinks as oil prices rise
The fallout from the US attack on Iranian nuclear facilities over the weekend is being felt in the currency markets. The Japanese yen, traditionally a safe-haven currency, continues to depreciate, in response to rising oil prices.
Oil prices rose to their highest level since January on Monday after the US attack on Iranian nuclear facilities. Iran has threatened to close the Straits of Hormuz, a critical trade route through which 20% of the world's oil supply passes through each day. Oil prices have jumped about 10% since the Israel-Iran war started on June 13 and fears of a disruption to oil supply could further boost oil prices.
As oil prices have climbed, the yen has lost ground, declining 3.0% since the Israel-Iran war started. Japan imports almost all of its oil and the rise in oil prices is hurting Japan's trade balance.
Japan Core CPI rises to 3.7%
Japan's core inflation rate climbed 3.7% y/y in May, up from 3.5% in April. Core CPI has accelerated for a third straight month and hit its highest level since Jan. 2023. This was above the market estimate of 3.6%. Headline inflation ticked lower to 3.5% from 3.6% in April, below the forecast of 3.6%.
The rise in core CPI supports the case for the Bank of Japan to boost interest rates, but the uncertainty over tariffs and the Israel-Iran war will likely mean that the BoJ will stay on the sidelines in the coming months.
USD/JPY Technical
- There is resistance at 146.91. Next, USD/JPY is testing resistance at 147.61
- 146.51 and 145.81 are the next support levels
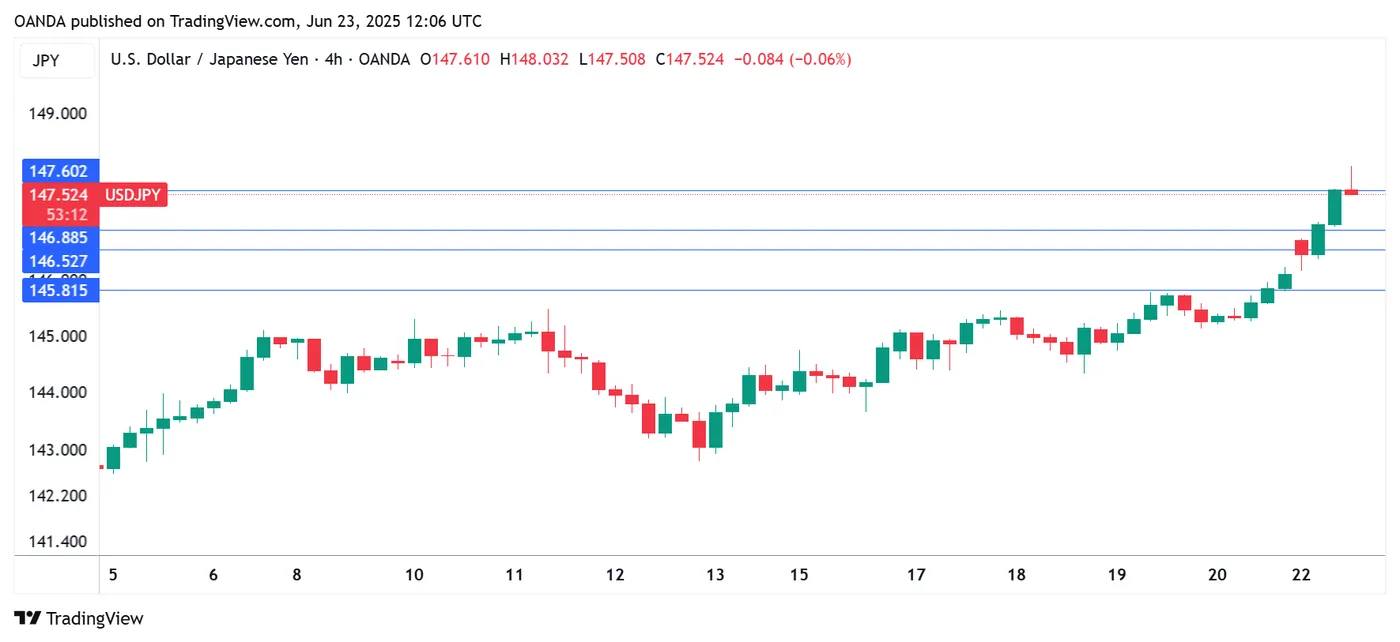
USDJPY 1-Day Chart, June 23, 2025
USD/JPY Mid-Day Outlook
Daily Pivots: (S1) 145.41; (P) 145.81; (R1) 146.51; More...
Intraday bias in USD/JPY remains on the upside for the moment. Firm break of 148.64 resistance will resume whole rise from 139.87. Next target is 100% projection of 151.56. On the downside, below 146.67 minor support will turn intraday bias neutral again first.
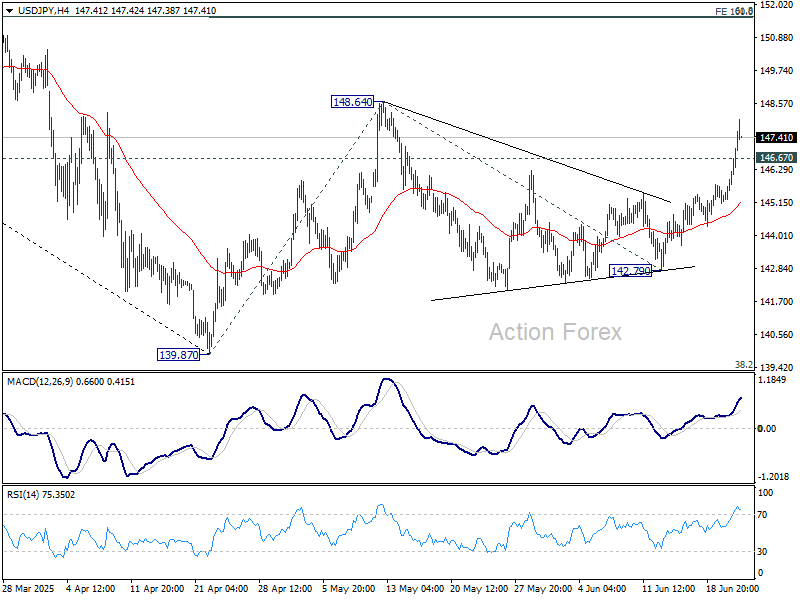
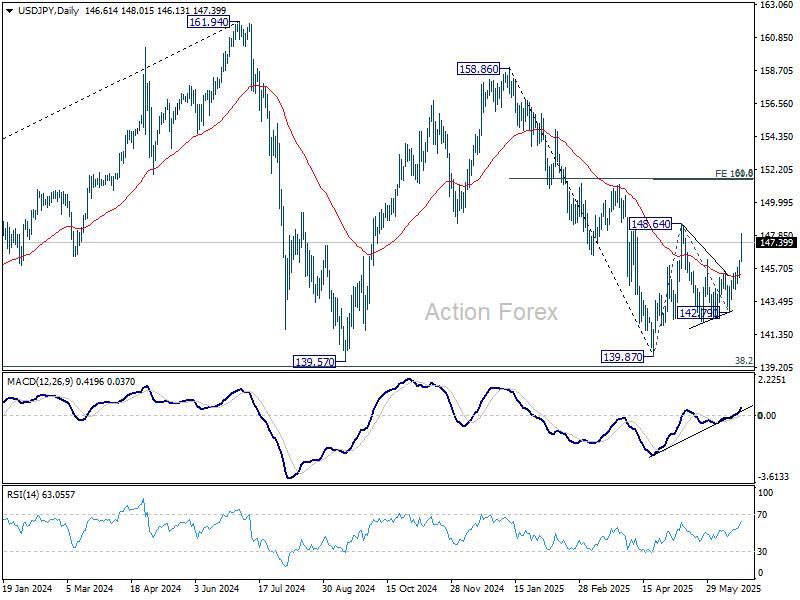
In the bigger picture, price actions from 161.94 are seen as a corrective pattern to rise from 102.58 (2021 low), with fall from 158.86 as the third leg. Strong support should be seen from 38.2% retracement of 102.58 to 161.94 at 139.26 to bring rebound. However, sustained break of 139.26 would open up deeper medium term decline to 61.8% retracement at 125.25.
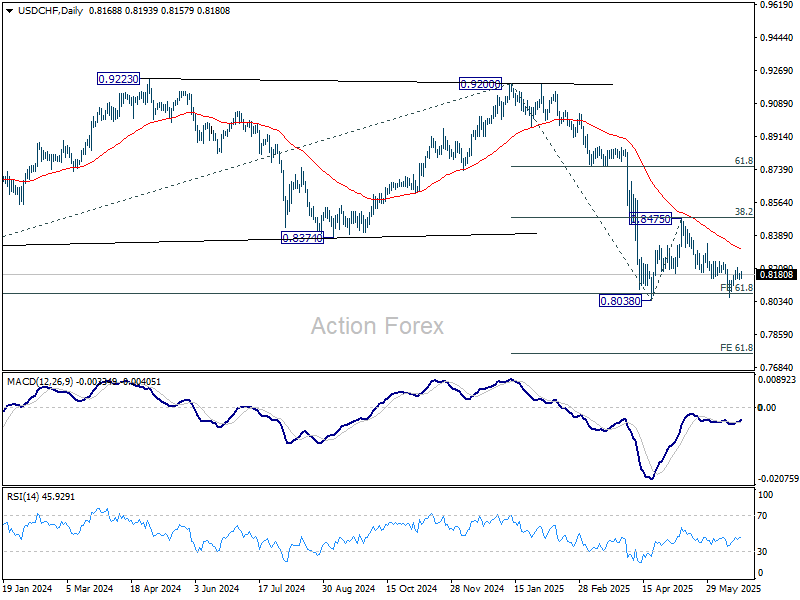
USD/CHF Mid-Day Outlook
Daily Pivots: (S1) 0.8160; (P) 0.8173; (R1) 0.8193; More….
No change in USD/CHF's outlook and intraday bias stays neutral. Further decline is expected as long as 0.8247 resistance holds. On the downside, below 0.8054 will bring retest of 0.8038 low first. Firm break there will resume larger down trend to 61.8% projection of 0.9200 to 0.8038 from 0.8475 at 0.7757. Nevertheless, firm break of 0.8247 will extend the corrective pattern from 0.8038 with another rising leg, and target 0.8475 resistance again.
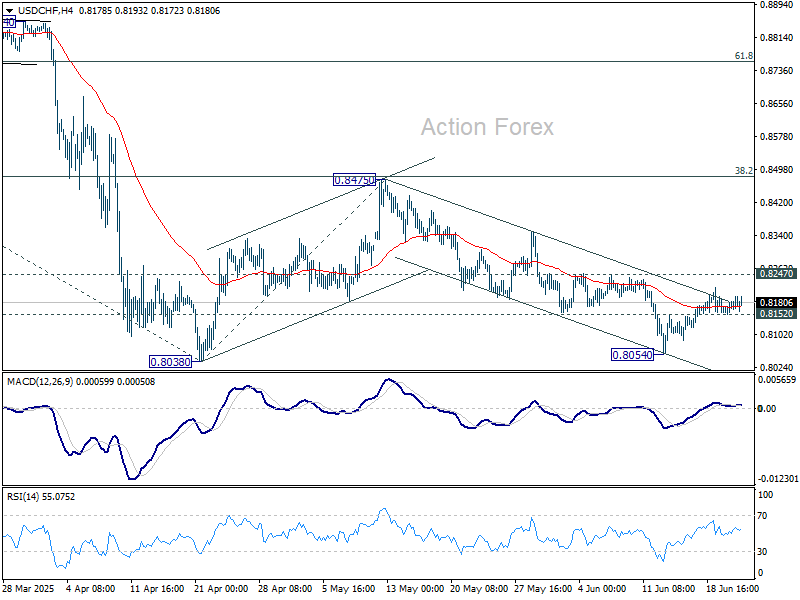
In the bigger picture, long term down trend from 1.0342 (2017 high) is still in progress and met 61.8% projection of 1.0146 (2022 high) to 0.8332 from 0.9200 at 0.8079 already. In any case, outlook will stay bearish as long as 55 W EMA (now at 0.8640) holds. Sustained break of 0.8079 will target 100% projection at 0.7382.
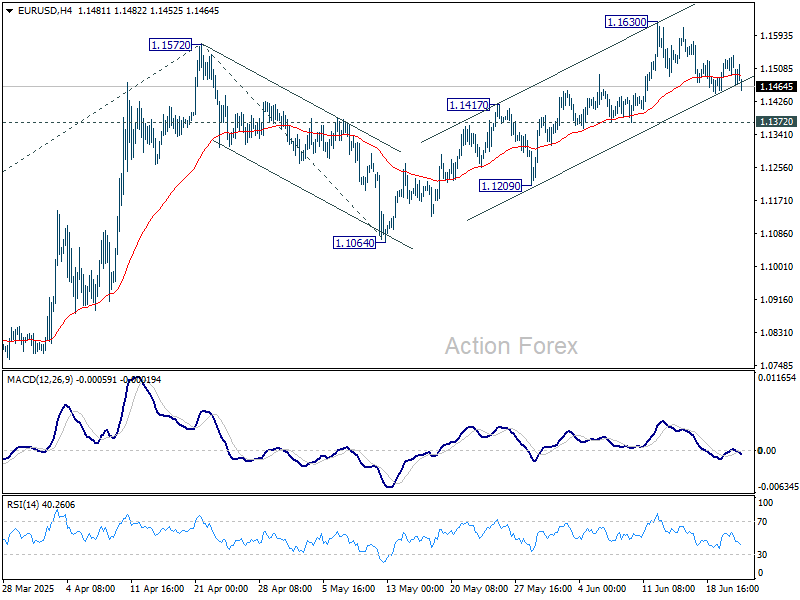
EUR/USD Mid-Day Outlook
Daily Pivots: (S1) 1.1492; (P) 1.1518; (R1) 1.1548; More...
Intraday bias in EUR/USD remains neutral and more consolidations could be seen below 1.1630. With 1.1372 support intact, further rally is expected. Break of 1.1572 will extend the rise from 1.0176. Next target is 61.8% projection of 1.0176 to 1.1572 from 1.1064 at 1.1927. However, break of 1.1372 support will indicate short term topping, and turn bias to the downside for deeper pullback.
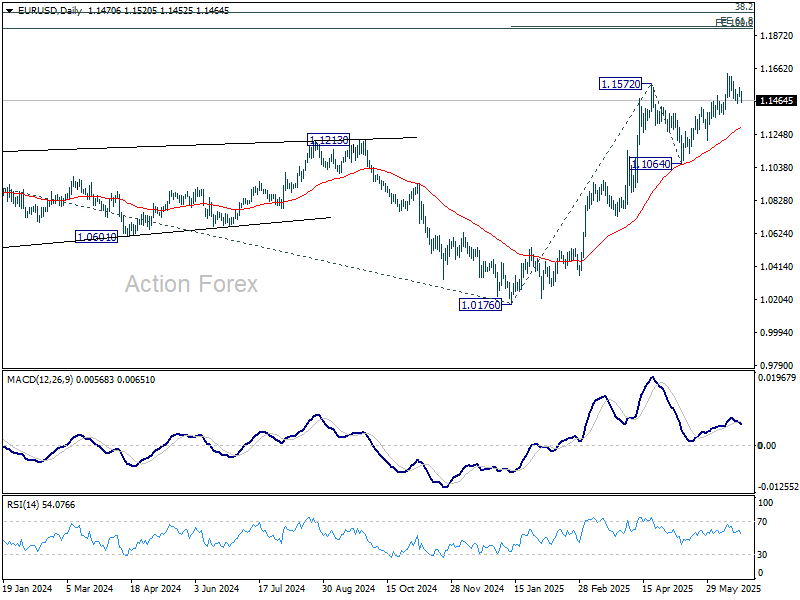
In the bigger picture, rise from 0.9534 long term bottom could be correcting the multi-decade downtrend or the start of a long term up trend. In either case, further rise should be seen to 100% projection of 0.9534 to 1.1274 from 1.0176 at 1.1916. This will now remain the favored case as long as 1.1604 support holds.
GBP/USD Mid-Day Outlook
Daily Pivots: (S1) 1.3422; (P) 1.3467; (R1) 1.3492; More...
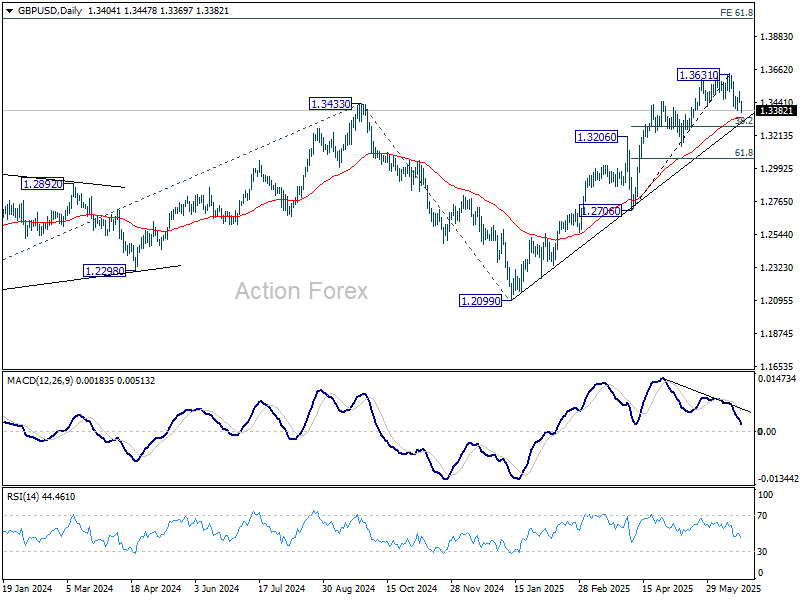
GBP/USD's fall from 1.3631 short term top resume by breaking 1.3381 temporary low. Intraday bias is back on the downside for 38.2% retracement of 1.2076 to 1.3631 at 1.3278. Strong support should be seen there to bring rebound. Break of 1.3509 resistance will turn bias back to the upside for retesting 1.3631 high. However, decisive break of 1.3278 will suggests that larger scale correction is underway and target 1.3206 resistance turned support and below.
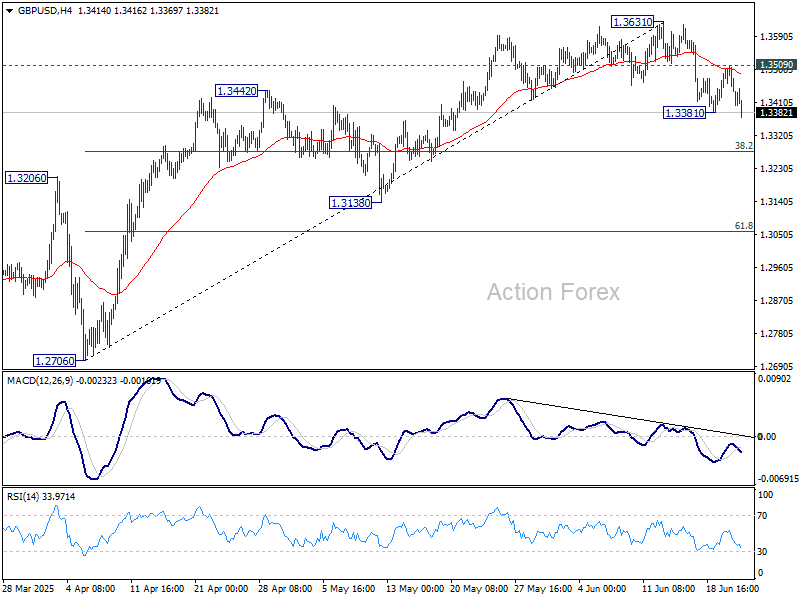
In the bigger picture, up trend from 1.3051 (2022 low) is in progress. Next medium term target is 61.8% projection of 1.0351 to 1.3433 from 1.2099 at 1.4004. Outlook will now stay bullish as long as 55 W EMA (now at 1.2948) holds, even in case of deep pullback.
Dollar Gains on Middle East Tensions, But Broader Markets Hold Steady
Dollar continues to dominate currency markets as geopolitical anxiety keeps providing support. Safe haven demand, sparked by fears of escalating conflict between the US and Iran, has put economic data on the back burner. While Iran has reiterated threats of retaliation after the US bombing of its underground nuclear sites, it has yet to act in a meaningful way. That delay may be giving markets some breathing room, but tensions remain high—especially with reports that some vessels have already paused transit through the Strait of Hormuz.
Despite the elevated geopolitical backdrop, broader market reaction has been relatively restrained. European equity indexes are modestly in the red, and US futures are pointing to a flat open. Oil prices, which spiked sharply at the start of the week, have retraced most of those gains, while Gold continues to struggle for momentum despite the rise in geopolitical risk. Investors appear to be awaiting Iran’s next move before taking more directional bets.
In the currency markets, Dollar and Swiss Franc lead gains, joined by Euro. Commodity currencies are bearing the brunt of the risk-off tone, with Kiwi and Aussie sitting at the bottom of the daily performance chart. Yen has been softer despite the cautious mood, while Sterling and the Loonie are trading in the middle of the pack.
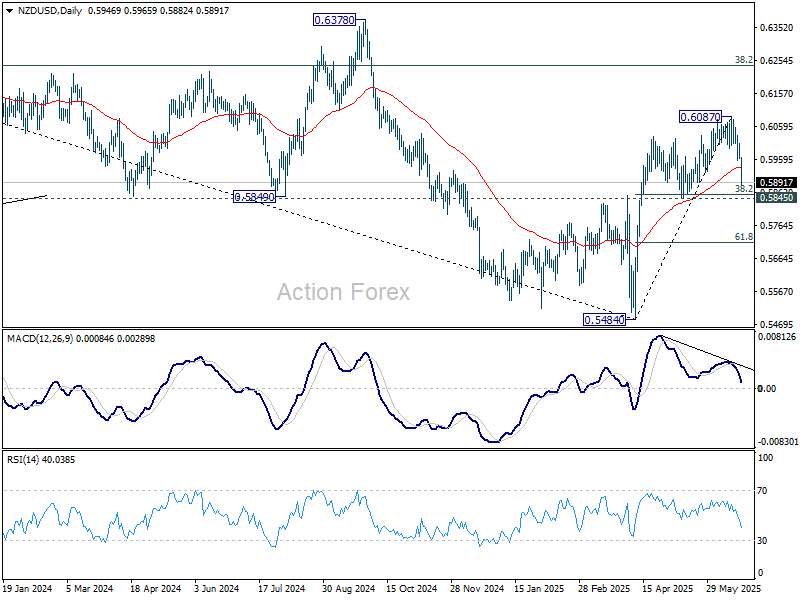
Technically, as NZD/USD's fall from 0.6807 short term top accelerates, focus is now on 0.5845 cluster support (38.2% retracement of 0.5484 to 0.6087 at 0.5857). Strong bounce from the levels will retain near term bullishness for another rally through 0.6087 at a later stage. However, considering bearish divergence condition in D EMA, sustained break of 0.5845/57 will raise the chance of near term bearish reversal, and target 61.8% retracement at 0.5714 next.
In Europe, at the time of writing, FTSE is down -0.22%. DAX is down -0.56%. CAC is down -0.75%. UK 10-year yield is down -0.039 at 4.505. Germany 10-year yield is down -0.017 at 2.503. Earlier in Asia, Nikkei fell -0.13%. Hong Kong HSI rose 0.67%. China Shangi SSE rose 0.65%. Singapore Strait Times fell -0.11%. Japan 10-year JGB yield rose 0.0087 to 1.411.
UK PMI composite rises to 50.7, weak growth and softening inflation
The UK economy showed marginal improvement in June, with PMI Composite inching from 50.3 up to 50.7, suggesting the economy is narrowly expanding. PMI Services rose from 50.9 to 51.3, while Manufacturing remained below the 50 threshold, albeit improving from 46.4 to 47.7.
S&P Global’s Chris Williamson described the picture as one of “lackluster” activity, with data pointing to just 0.1% GDP growth in Q2. Beyond weak growth, the survey flagged ongoing uncertainty from recent UK policy shifts, global trade frictions, and geopolitical instability, including increased Middle East tensions.
Crucially, inflationary pressures have cooled significantly because of the above developments. With growth near stall speed and inflation slowing, the path is opening for BoE to deliver another rate cut in August.
Eurozone PMI composite unchanged at 50.2, inflation risk contained for ECB
Eurozone flash PMIs offered little cause for celebration in June, as the economy continued to tread water. PMI Composite held steady at 50.2. PMI Manufacturing was unchanged in contraction at 49.4. Services ticked back from 49.7 to the 50.0 mark, barely returning to expansion.
According to Hamburg Commercial Bank’s Cyrus de la Rubia, the bloc is “struggling to gain momentum,” with both manufacturing and services showing only marginal progress. Germany showed faint signs of improvement, but France continues to act as a drag. Still, firms remain cautiously optimistic: employment has been broadly stable, and expectations have improved modestly according to the survey.
For ECB, while services inflation remains “slightly tense” due to sticky input costs, this is counterbalanced by disinflation in goods and the dampening effects of a strong Euro and US tariffs. Energy prices—now rebounding due to Middle East tensions—could become a concern, though much of the impact is not yet captured in the current PMI readings.
Japan PMI composite rises to 51.4, but trade uncertainty weighs on demand
Japan’s private sector showed a modest rebound in June, with PMI Composite rising from 50.2 to 51.4, the highest reading since February. The pickup was led by stronger services sector, which rose from 51.0 to 51.5. PMI Manufacturing returned to expansion territory at 50.4, up from 49.4.
Annabel Fiddes of S&P Global noted that business activity gained momentum into quarter-end, but demand conditions remained fragile. New business rose only slightly, while foreign demand for manufactured goods weakened further. Firms cited ongoing concerns over US tariffs and global trade uncertainty, which continued to weigh on client orders and export sales.
Still, there were signs of easing cost pressures, with input prices rising at the slowest pace in 15 months. Employment also improved, with overall job creation accelerating to the fastest rate in nearly a year.
Australia PMIs improve modestly, support case for further RBA cuts
Australia’s private sector showed modest improvement in June, with the S&P Global PMI Composite rising from 50.5 to 51.2. PMI Services climbed from 50.6 to 51.3, while PMI manufacturing held steady at 51.0.
According to S&P Global’s Jingyi Pan, forward-looking indicators present a mixed picture. While output expectations remain positive, divergences between sectors were notable. New orders and future output softened more clearly in manufacturing, while services continued to gain traction. Weak external demand remains a concern, with export orders seeing their sharpest drop in nearly a year.
Combined with signs of easing inflation and slower employment growth, the PMI report supports the case for further rate cuts by RBA in the second half of 2025.
GBP/USD Mid-Day Outlook
Daily Pivots: (S1) 1.3422; (P) 1.3467; (R1) 1.3492; More...
GBP/USD's fall from 1.3631 short term top resume by breaking 1.3381 temporary low. Intraday bias is back on the downside for 38.2% retracement of 1.2076 to 1.3631 at 1.3278. Strong support should be seen there to bring rebound. Break of 1.3509 resistance will turn bias back to the upside for retesting 1.3631 high. However, decisive break of 1.3278 will suggests that larger scale correction is underway and target 1.3206 resistance turned support and below.
In the bigger picture, up trend from 1.3051 (2022 low) is in progress. Next medium term target is 61.8% projection of 1.0351 to 1.3433 from 1.2099 at 1.4004. Outlook will now stay bullish as long as 55 W EMA (now at 1.2948) holds, even in case of deep pullback.
WTI Oil: Near Term Sentiment Cooled After Gap-Higher Opening
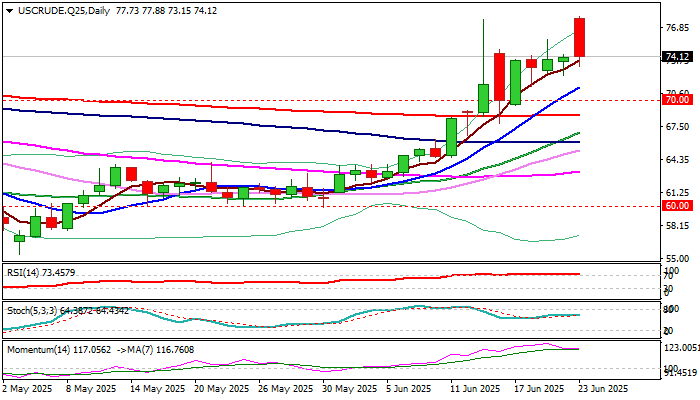
WTI oil eased quickly from new six-month high ($77.88, hit after Monday’s gap-higher opening), signaling that traders are not very much concerned about growing threats of strong supply disruptions, though overall picture remains firmly bullish.
The oil opened around 5% higher on Monday, after the US attacked Iran during the weekend, in action that was strongly criticized by a number of countries, including two superpowers, China and Russia.
The timing of attack was important, as Israel started the conflict by launching attacks on Iran last Friday that prevented panic market reaction (as the markets were closed) and leaving enough time for traders to digest news before taking the action.
This comes after Trump’s tariff announcement (Liberation Day) which was announced on a weekday and caused a big damage, particularly to stock markets.
Although markets were worried of escalation of the conflict and anticipated that Iran’s immediate response will be closure of Hormuz strait that would cause significant disruption in oil supply and probably send the price towards $100 per barrel, this was not the case so far.
Markets will be closely watching the developments in Iran – US/Israel conflict and look for fresh signals as Iranian parliament has already voted for closure of Hormuz (awaiting verification), with focus on reaction from Russia (Iranian foreign minister is meeting President Putin today), as well comments from the UN Security Council which meets today on request of Iran.
Technical picture on daily chart remains bullish despite overnight’s drop in the price that caused weakening of positive momentum, as technical indicators are in bullish configuration and continue to underpin.
Solid supports at $72.50 zone (Fibo 23.6% of $55.40/$77.88 / higher base) should contain dips and keep firmly bullish near term structure intact for fresh attempts higher.
Rising 10DMA ($71.19) marks next support and guards lower breakpoints at $70.00/$69.29 (psychological / Fibo 38.2%) loss of which would sideline bulls.
Res: 77.88; 78.45; 79.35; 80.00.
Sup: 73.15; 72.57; 72.34; 71.19.
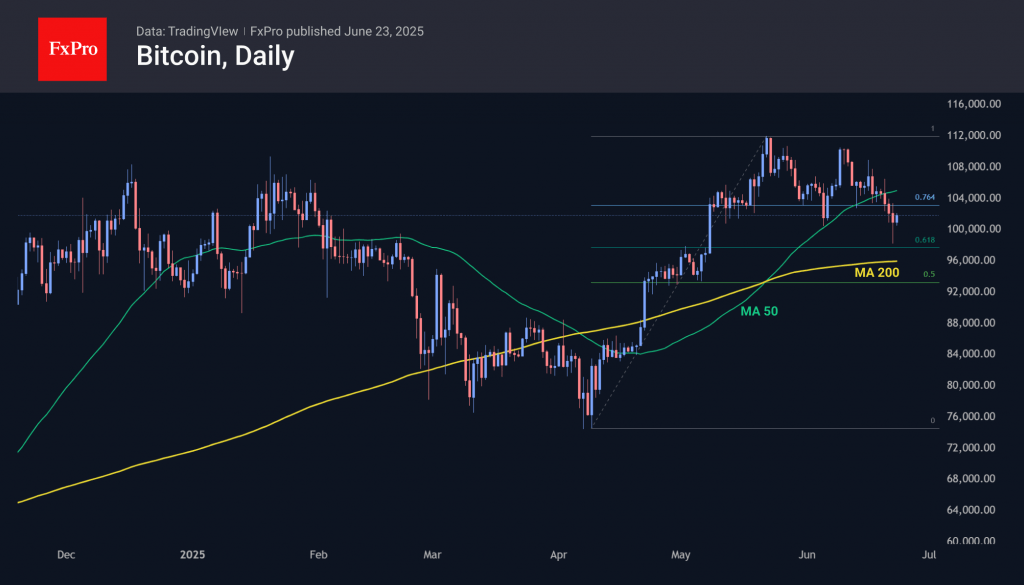
Crypto Market Jumped Out of Fear Zone
Market Picture
Market capitalisation fell to $3.03 trillion over the weekend, which is easier to attribute to the expectations of speculators working over the weekend that the markets would sell off due to US strikes on targets in Iran. However, the limited reaction of traditional financial markets brought buyers back to crypto, showing their interest in buying at a discount and returning capitalisation to $3.12 trillion.
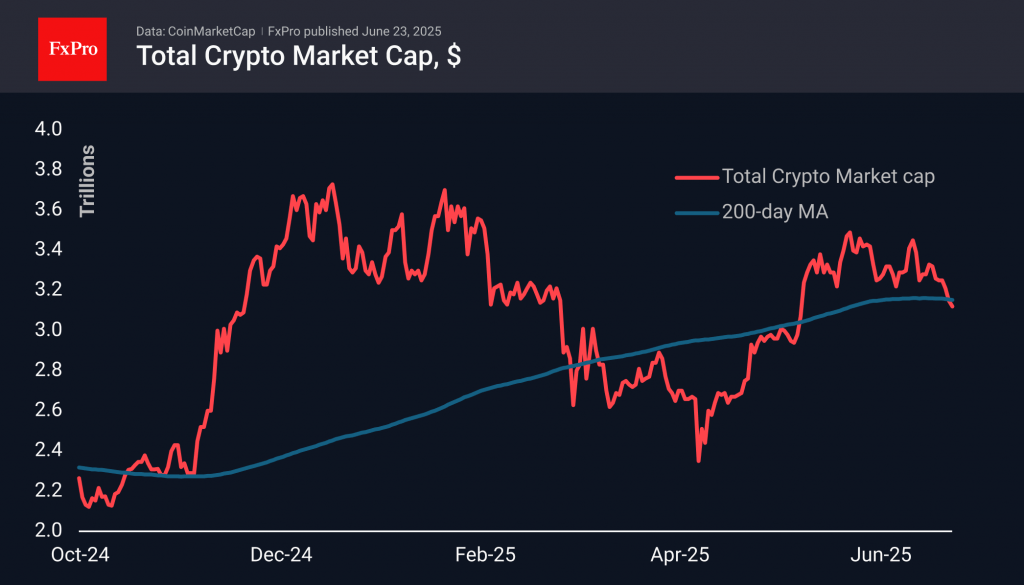
The cryptocurrency sentiment index fell to 42 on Sunday, its lowest level in two months, but rose to 47 at the start of the new week, jumping out of the fear zone into neutral territory.
Bitcoin slipped to $98K over the weekend. This was a touch of the classic support at 61.8% of the April-May rally, but at the start of the European trading session, it was already close to $102K, compared to $102.7K at the start of the day on Sunday. However, last week’s sell-off broke the support at the 50-day moving average under the weight of external circumstances. Breaking out of the $96–105K range will force us to wait for further movement in the direction of the breakout.
News Background
According to SoSoValue, net inflows into spot BTC ETFs fell to $1.02 billion last week. Total inflows since the approval of Bitcoin ETFs in January 2024 have increased to $45.61 billion.
Net inflows into spot Ethereum ETFs in the US fell sharply to $40.2 million last week, bringing the cumulative net inflow since the ETF’s launch in July to $3.89 billion.
Glassnode noted a drop in the daily number of transactions on the Bitcoin network and largely attributed it to the collapse of non-financial transactions and the growing dominance of large players.
South Korean authorities presented a roadmap for the approval of spot cryptocurrency ETFs. Measures to launch crypto ETFs will be prepared in the second half of 2025.
The Kraken exchange launched Bitcoin staking in collaboration with the BTCFi project Babylon. The integration will allow customers to receive rewards without using bridges or ‘wrapped’ assets. According to the statement, customers will retain full control over their coins, which will not leave the BTC blockchain.
UK PMI composite rises to 50.7, weak growth and softening inflation
The UK economy showed marginal improvement in June, with PMI Composite inching from 50.3 up to 50.7, suggesting the economy is narrowly expanding. PMI Services rose from 50.9 to 51.3, while Manufacturing remained below the 50 threshold, albeit improving from 46.4 to 47.7.
S&P Global’s Chris Williamson described the picture as one of “lackluster” activity, with data pointing to just 0.1% GDP growth in Q2. Beyond weak growth, the survey flagged ongoing uncertainty from recent UK policy shifts, global trade frictions, and geopolitical instability, including increased Middle East tensions.
Crucially, inflationary pressures have cooled significantly because of the above developments. With growth near stall speed and inflation slowing, the path is opening for BoE to deliver another rate cut in August.
