Sample Category Title
Euro Steadies at Support — EUR/USD Aims for a Break Higher
Key Highlights
- EUR/USD started a fresh increase from the 1.1440 zone.
- A major bearish trend line is forming with resistance at 1.1560 on the 4-hour chart.
- GBP/USD corrected gains and traded below the 1.3500 level.
- Bitcoin dipped sharply below $103,000 after the US strike On Iran.
EUR/USD Technical Analysis
The Euro started a downside correction and tested 1.1440 against the US Dollar. EUR/USD found support and now attempts a fresh increase above 1.1500.
Looking at the 4-hour chart, the pair traded above the 1.1480 resistance and settled well above the 100 simple moving average (red, 4-hour) and the 200 simple moving average (green, 4-hour). The pair is now showing positive signs and might aim for more gains.
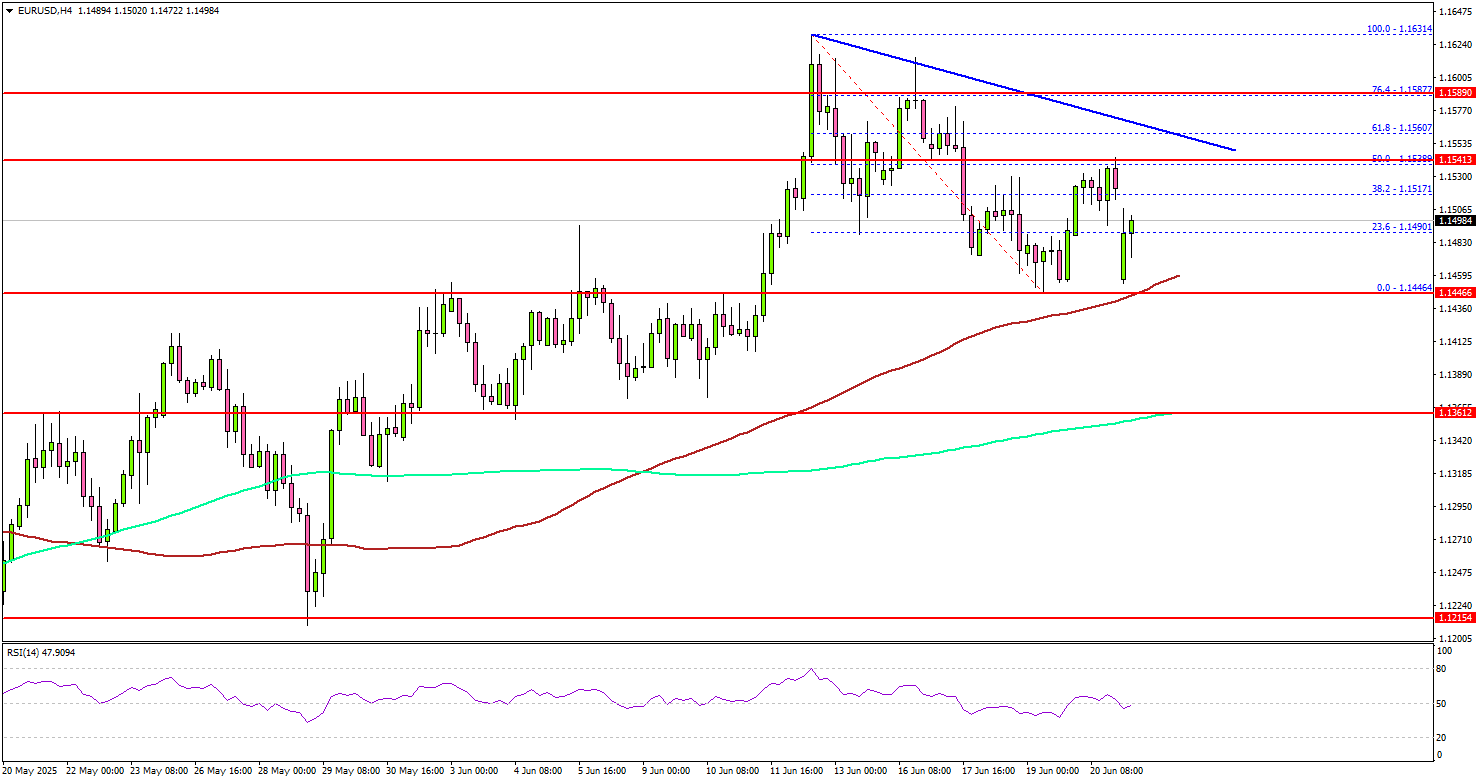
On the upside, the pair could face resistance near the 1.1550 level. There is also a major bearish trend line forming with resistance at 1.1560 on the same chart.
The next key resistance sits near the 1.1620. The first major resistance sits at 1.1650. A close above the 1.1650 level could set the pace for another increase. In the stated case, the pair could even clear the 1.1720 resistance. The next major stop for the bulls could be near the 1.1800 resistance.
On the downside, immediate support is near the 1.1480 level. The next key support sits near 1.1450 and the 100 simple moving average (red, 4-hour). Any more losses could send the pair toward the 1.1360 level and the 200 simple moving average (green, 4-hour).
Looking at GBP/USD, the pair dipped below the 1.3500 level and now remains at risk of more losses in the near term.
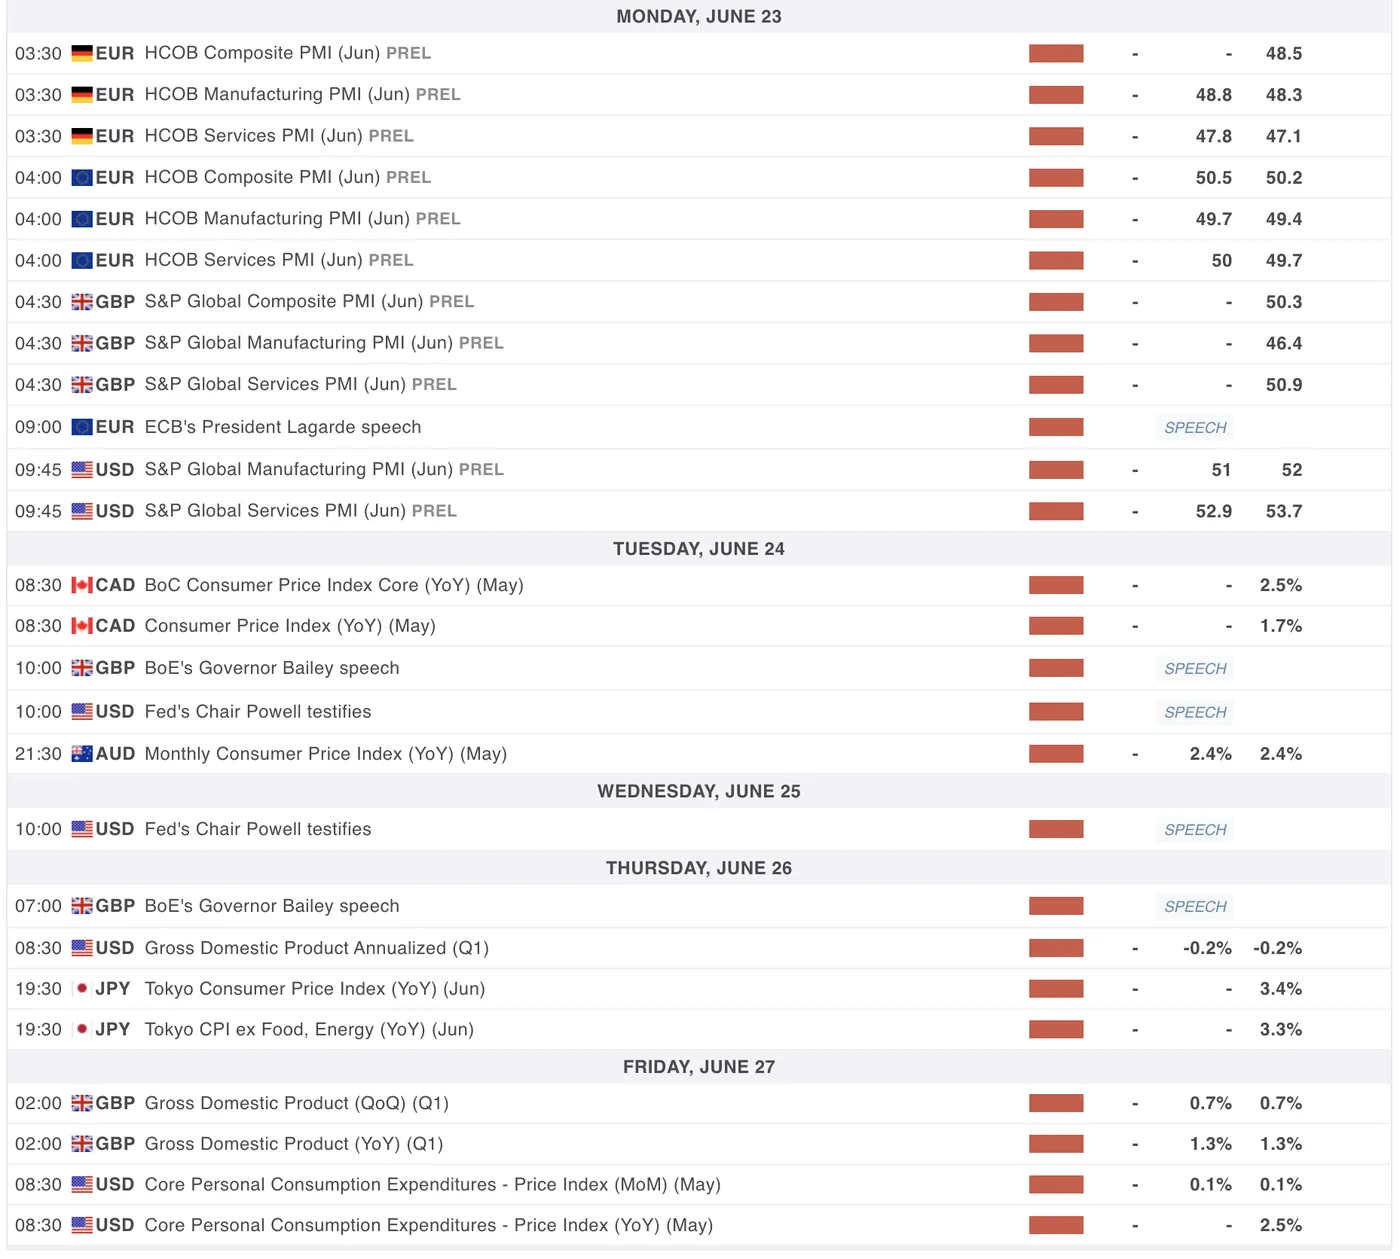
Upcoming Economic Events:
- Germany’s Manufacturing PMI for June 2025 (Preliminary) - Forecast 48.8, versus 48.3 previous.
- Germany’s Services PMI for June 2025 (Preliminary) - Forecast 47.8, versus 47.1 previous.
- Euro Zone Manufacturing PMI June 2025 (Preliminary) – Forecast 49.7, versus 49.4 previous.
- Euro Zone Services PMI for June 2025 (Preliminary) – Forecast 50.0, versus 49.7 previous.
- US Manufacturing PMI for June 2025 (Preliminary) – Forecast 51.0, versus 52.0 previous.
- US Services PMI for June 2025 (Preliminary) – Forecast 52.9, versus 53.7 previous.
WTI oil soars on US strikes in Iran; 80 now the line between calm and 100+ chaos
WTI crude surged at the start of the week as geopolitical tensions flared after US airstrikes hit Iranian nuclear targets over the weekend. The move marks a dramatic escalation in the long-simmering conflict between Iran and Israel, now drawing in direct US involvement. Investors are now awaiting Tehran’s next move after Iranian officials said “all options” remain on the table in response.
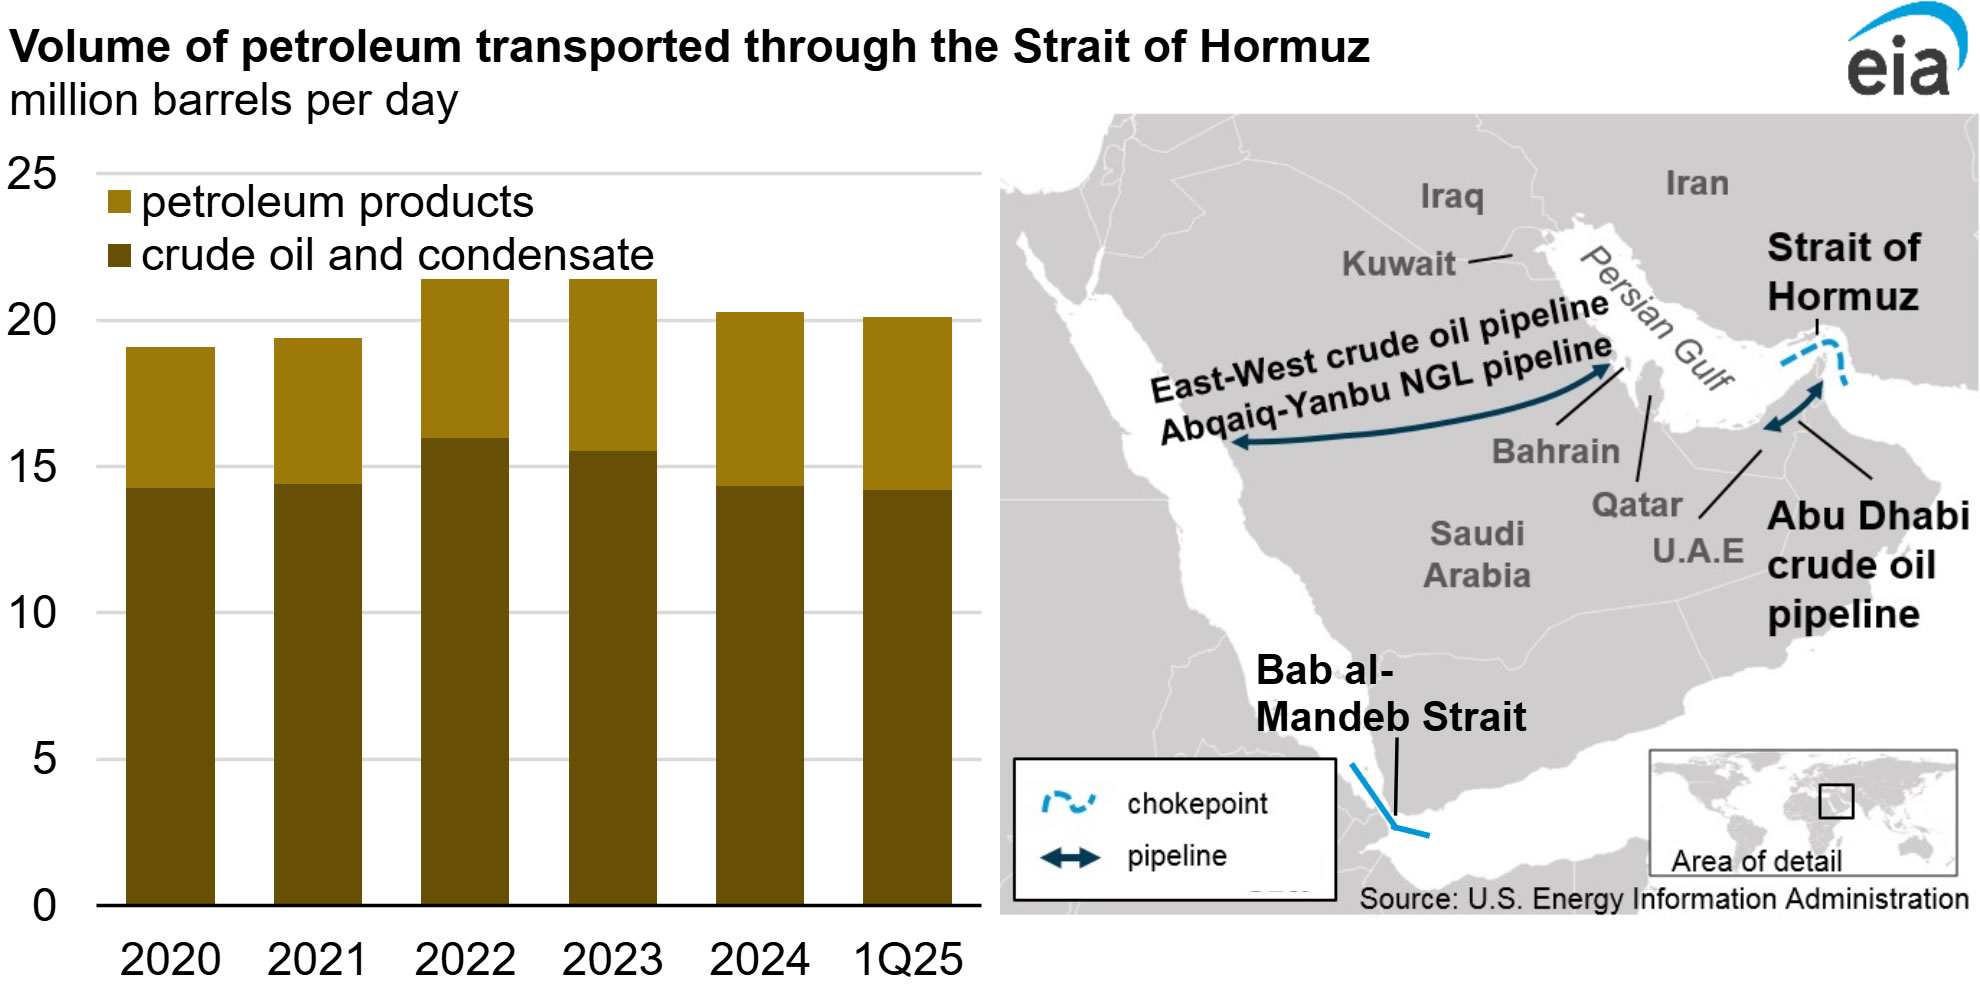
Attention is now centered on the Strait of Hormuz, a strategic waterway through which one-fifth of the world’s oil flows. Iranian lawmakers have approved a non-binding motion to shut down the strait, though the final decision lies with the National Security Council. Any disruption to shipments through Hormuz would have a profound impact on global supply chains and energy prices.
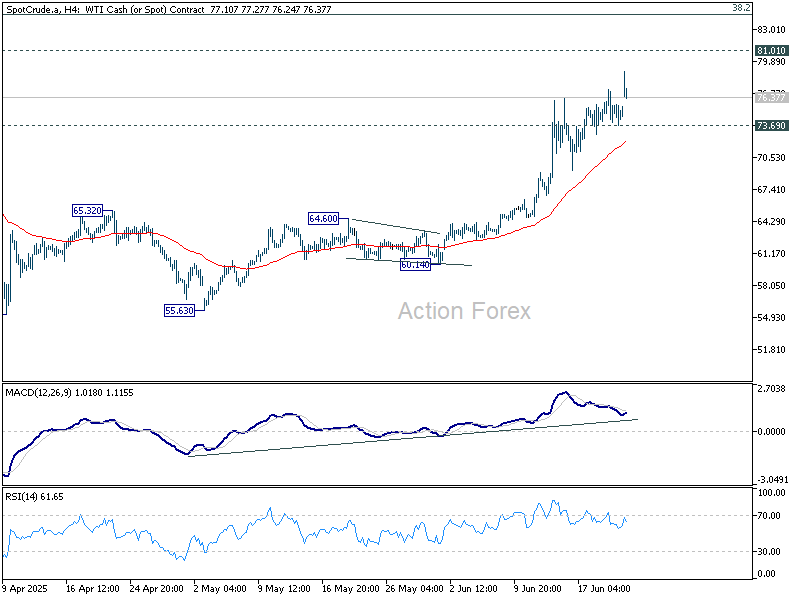
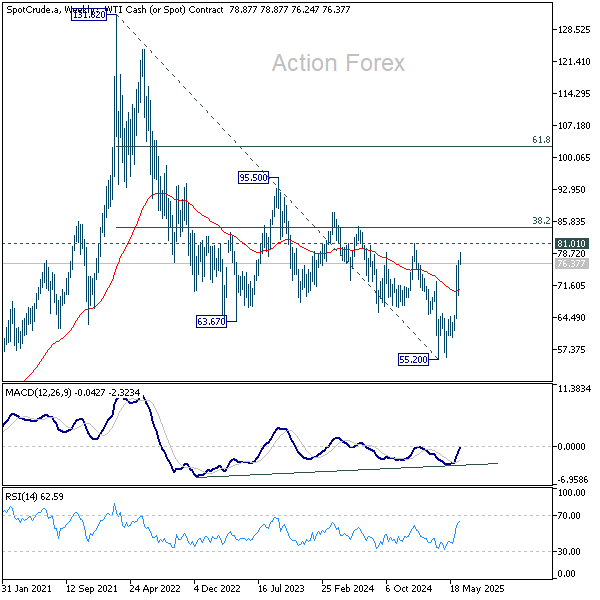
Technically, WTI crude’s surge from the 55.20 low is now approaching a key resistance at 81.01. Barring a broader escalation, the rally could stall here, especially with overbought momentum indicators flashing caution. A break below 73.69 would be an early sign of stabilization and may trigger profit-taking correction.
But if the conflict deepens and prices break decisively above 81.01, the rally could accelerate toward through 38.2% retracement of 131.82 (2022 high) to 55.20 at 84.46. Sustained break above 84.46 would mark a significant reversal of the long-term downtrend from the 2022 high and open the path to 95.50 or even to 61.8% retracement at 102.55.
With tensions high and the market highly headline-sensitive, holding below 80 will be key to preventing a return to 100+ oil—and renewed inflationary concerns worldwide.
Japan PMI composite rises to 51.4, but trade uncertainty weighs on demand
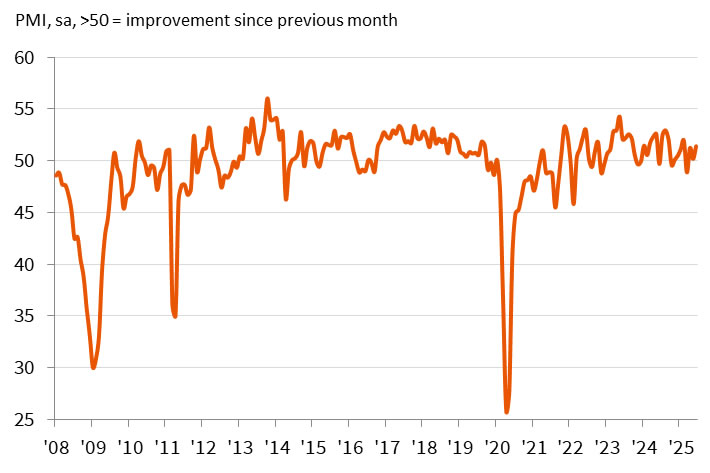
Japan’s private sector showed a modest rebound in June, with PMI Composite rising from 50.2 to 51.4, the highest reading since February. The pickup was led by stronger services sector, which rose from 51.0 to 51.5. PMI Manufacturing returned to expansion territory at 50.4, up from 49.4.
Annabel Fiddes of S&P Global noted that business activity gained momentum into quarter-end, but demand conditions remained fragile. New business rose only slightly, while foreign demand for manufactured goods weakened further. Firms cited ongoing concerns over US tariffs and global trade uncertainty, which continued to weigh on client orders and export sales.
Still, there were signs of easing cost pressures, with input prices rising at the slowest pace in 15 months. Employment also improved, with overall job creation accelerating to the fastest rate in nearly a year.
Australia PMIs improve modestly, support case for further RBA cuts
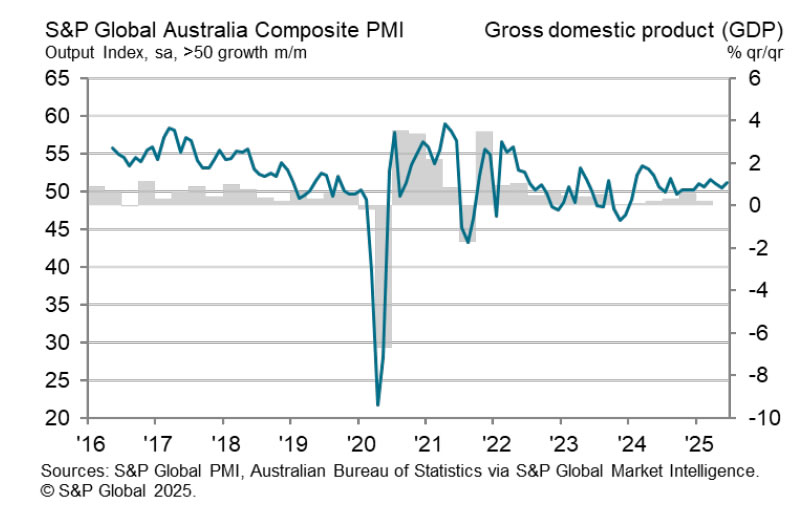
Australia’s private sector showed modest improvement in June, with the S&P Global PMI Composite rising from 50.5 to 51.2. PMI Services climbed from 50.6 to 51.3, while PMI manufacturing held steady at 51.0.
According to S&P Global’s Jingyi Pan, forward-looking indicators present a mixed picture. While output expectations remain positive, divergences between sectors were notable. New orders and future output softened more clearly in manufacturing, while services continued to gain traction. Weak external demand remains a concern, with export orders seeing their sharpest drop in nearly a year.
Combined with signs of easing inflation and slower employment growth, the PMI report supports the case for further rate cuts by RBA in the second half of 2025.
Brent Crude (BZ) Oil Signals Bottom, Advances Higher
Brent Crude Oil (BZ) is a major global benchmark for crude oil pricing, primarily sourced from the North Sea between the United Kingdom and Norway. It is a light, sweet crude oil, characterized by a low sulfur content (sweet) and low density (light), making it ideal for refining into gasoline and diesel. Brent Crude is traded on the Intercontinental Exchange (ICE) under the ticker symbol “BZ” and serves as a reference price for approximately two-thirds of the world’s internationally traded oil supplies. In this article, we will look at the Elliott Wave outlook for Brent Crude and when to anticipate the pullback is complete.
Brent Crude Weekly Elliott Wave Chart
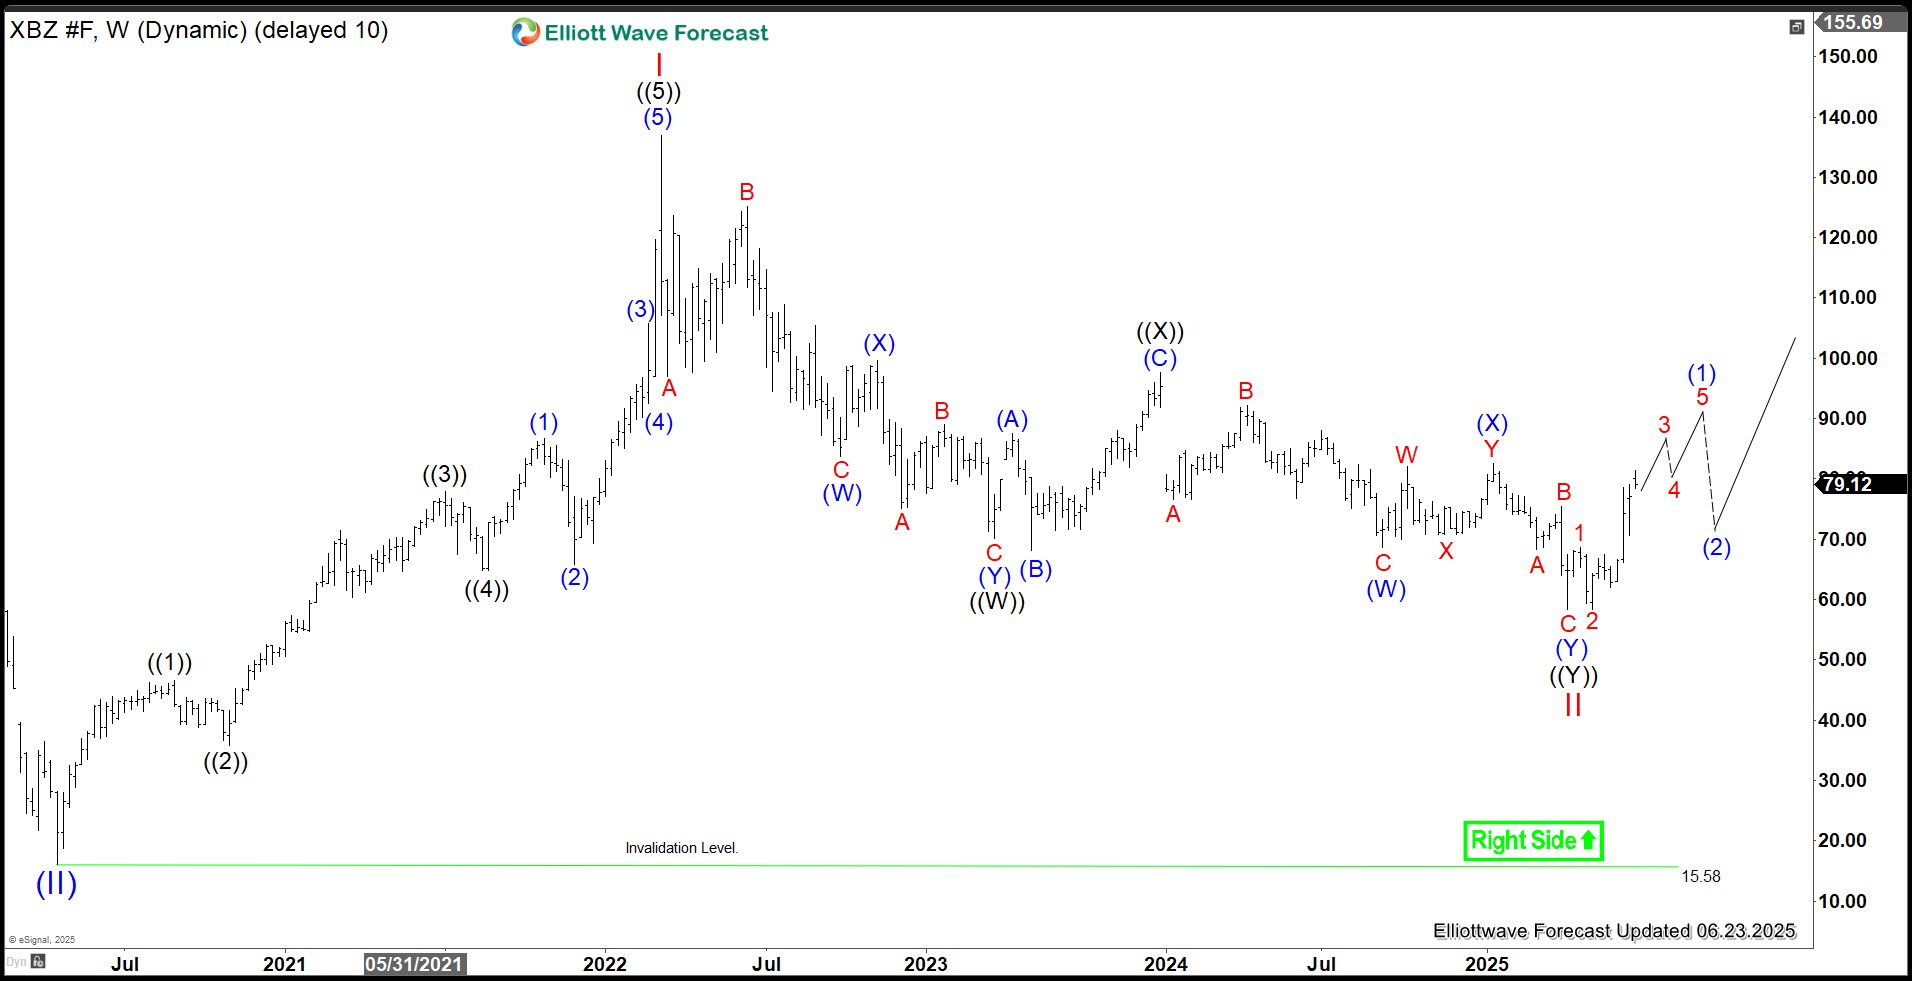
The weekly Elliott Wave Chart for Brent Crude indicates a Super Cycle wave (II) low of $15.74 in April 2020 during the COVID-19 selloff. Since then, it has rallied, completing wave I at $137 in March 2022. The wave II pullback concluded on April 9, 2025, at $58.39, with the instrument now advancing in wave III. Anticipate pullbacks to attract buyers at the 3, 7, and 11 swing levels, supporting further upside in the coming months and years.
Brent Crude Daily Elliott Wave Chart
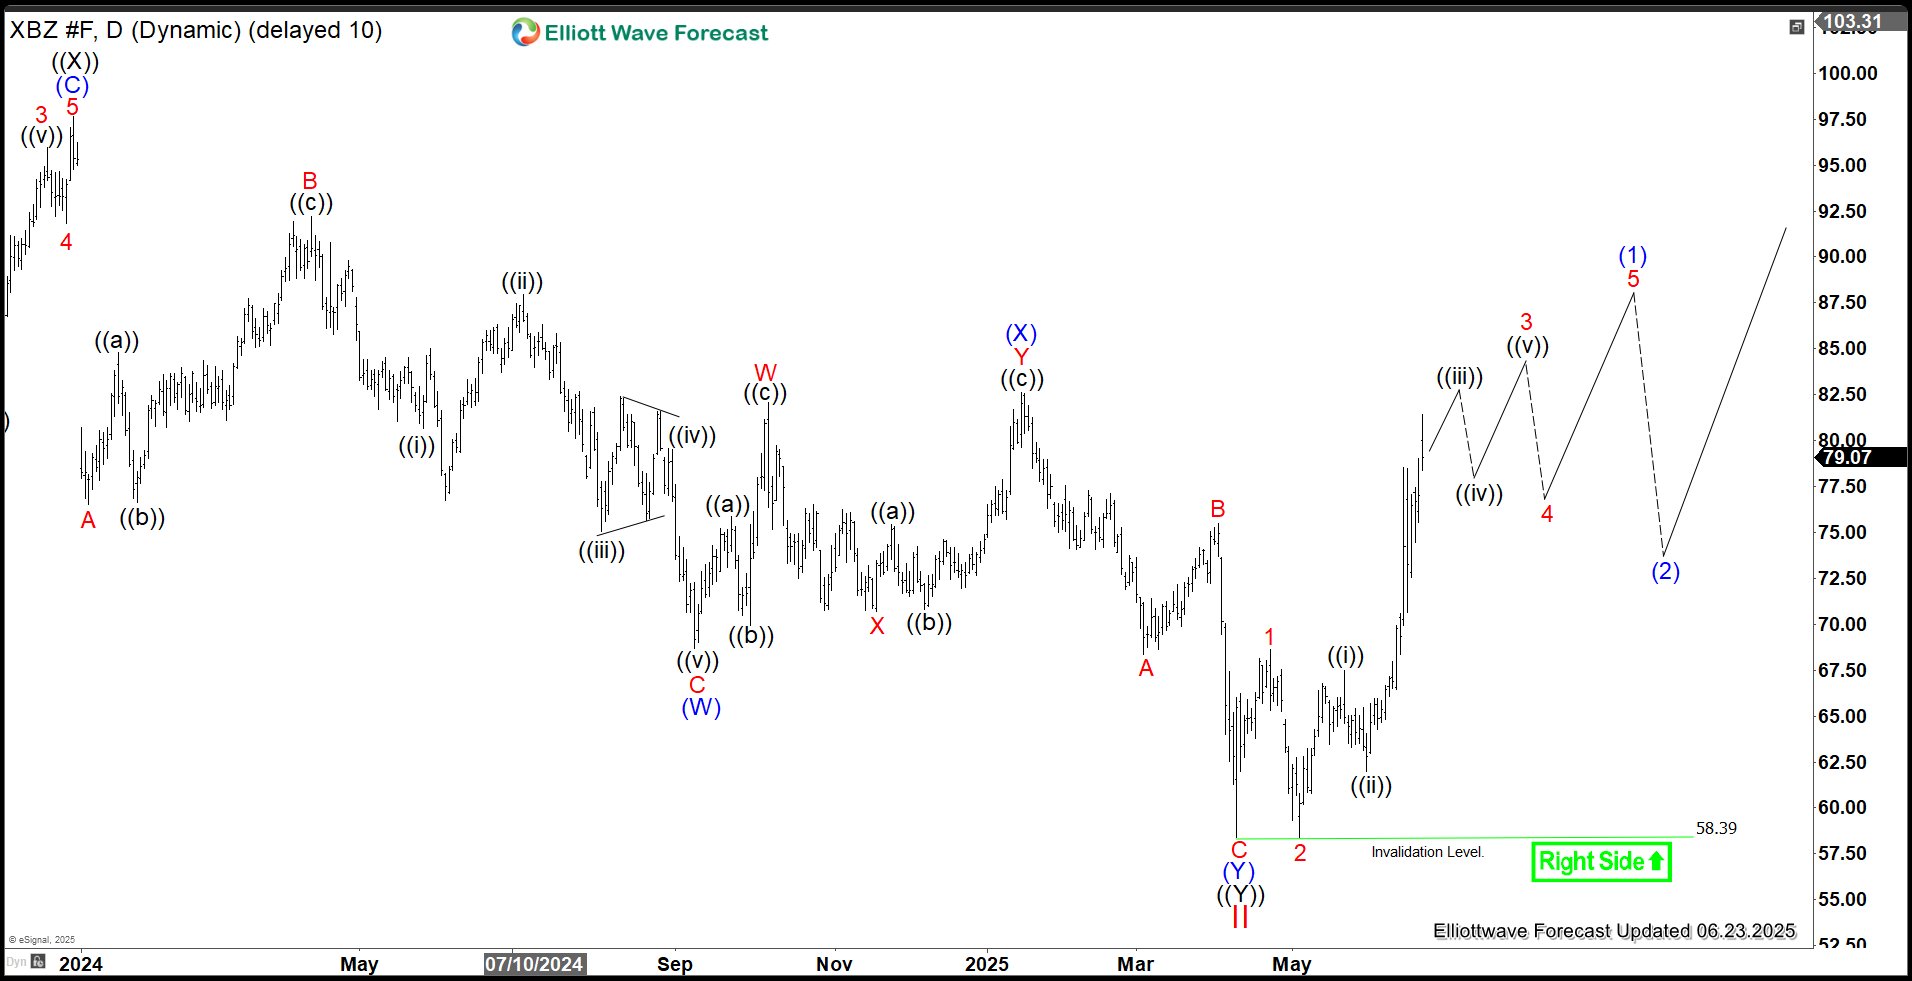
The Daily Chart of Brent Crude Oil illustrates a decline from the wave I peak, unfolding as a double-three Elliott Wave structure. From wave I, wave ((W)) concluded at $70.13, followed by a wave ((X)) rally ending at $97.63 as an expanded flat. The instrument then resumed its decline in wave ((Y)), reaching $58.39, completing wave II in Cycle Degree on April 9, 2025. Brent Crude has since rallied with an impulsive internal subdivision, confirming the low is in place and signaling the start of a new bullish cycle.
Brent Crude Elliott Wave Technical Video
https://www.youtube.com/watch?v=IopjxxWLCnM
AUDCHF Sells From Blue Box, Aligning With Long-Term Bearish Sequence
AUDCHF is on the verge of completing a multi-decade bearish cycle from April 1992. However, it appears sellers will continue to push in the shorter cycles. Thus, the pair should attract short-term sellers, while long-term sellers should watch out.
AUDCHF has been in a long-term bearish cycle from April 1992 in a somewhat corrective sequence. The structure appears to be a double zigzag — a 7-swing structure. Wave (W) of the supercycle degree ended in October 2008. Afterwards, the corresponding wave (X) bounce followed and ended in August 2012. Since August 2012, the pair has been in another bearish cycle for wave (Y). Meanwhile, wave (Y) has now reached the 100% extension of wave (W) from (X) — which could indicate completion. It’s also notable that wave C of (Y) is completing an ending diagonal structure from September 2014. Overall, the entire cycle from April 1992 may very well end within the 0.5385–0.4213 extreme zone.
A closer look at the diagonal wave C shows its sub-waves — waves ((1)), ((2)), ((3)), and ((4)) — ended in January 2015, February 2017, March 2020, and February 2021 respectively. Thus, the last known bearish cycle within this long-term bearish market is wave ((5)) of C of (Y), which started in February 2021.
AUDCHF Weekly Chart Analysis
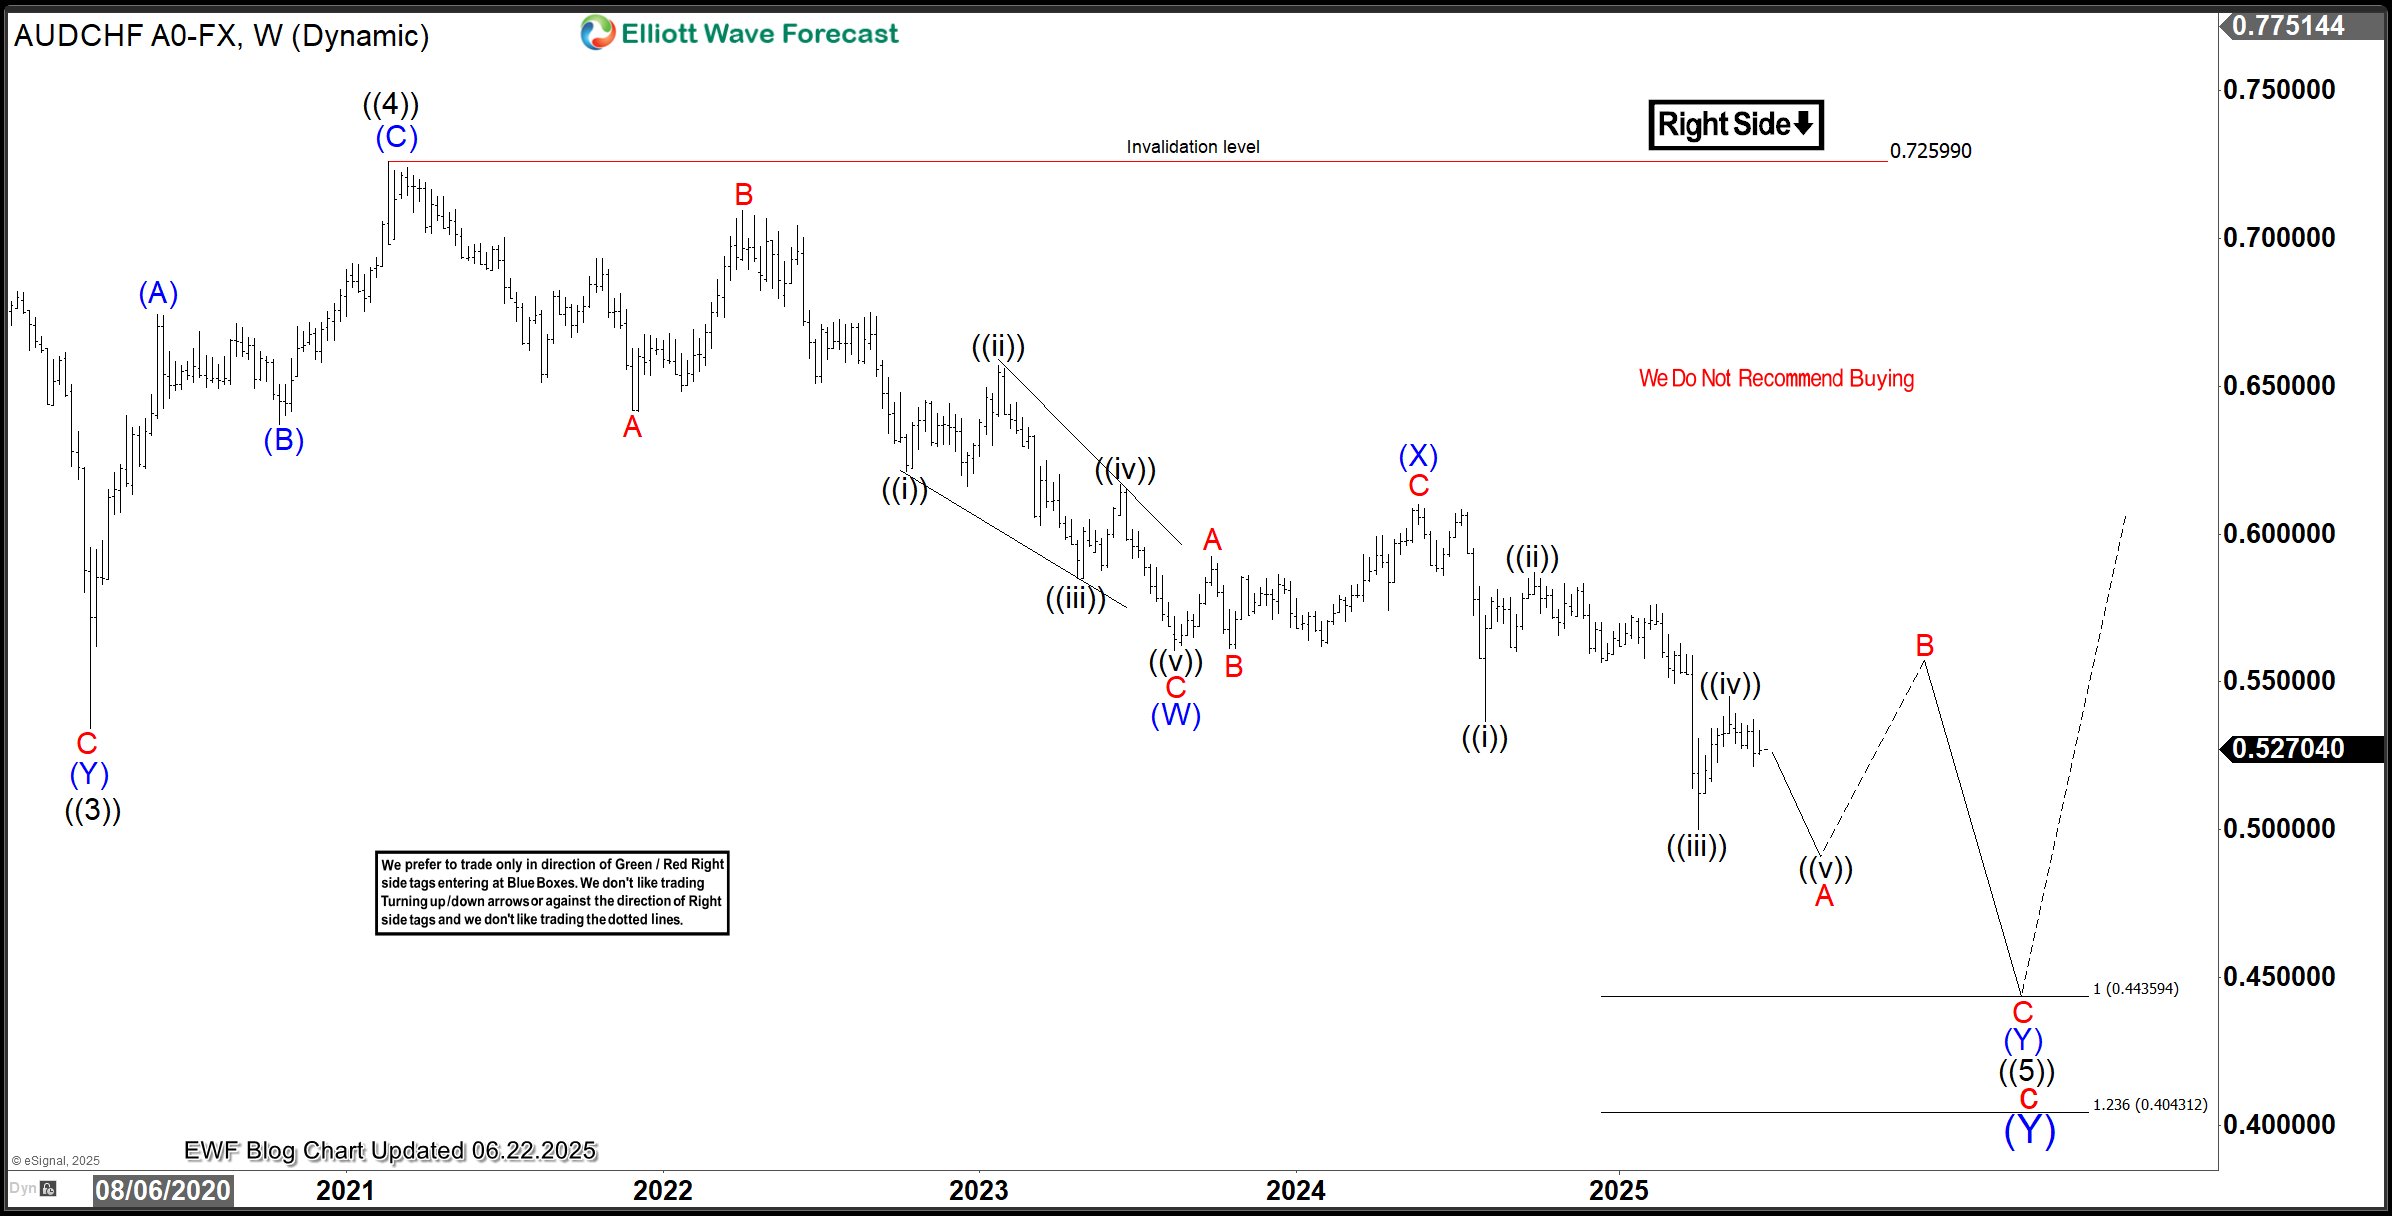
AUDCHF Weekly
On the weekly chart above, the wave ((4)) cycle from February 2021 is evolving as a double zigzag structure. Wave (W) of ((5)) ended in August 2023. Afterwards, a corrective bounce for wave (X) followed to the high of May 2024 and then returned to the downside. The break of the wave (W) low opened fresh opportunities for sellers from the extremes of bounces.
The weekly chart shows the price still in wave A of (Y) of ((5)), likely to finish a diagonal structure. A closer look shows price has completed wave ((iv)) of A and is now in ((v)) of A. Thus, it supports selling bounces from the extremes of 3/7/11 swing structures on the shorter cycle, as the wave ((5)) cycle could extend to the 0.4435–0.4043 extreme — which is within the 0.5385–0.4213 extreme.
AUDCHF H4 Chart Analysis
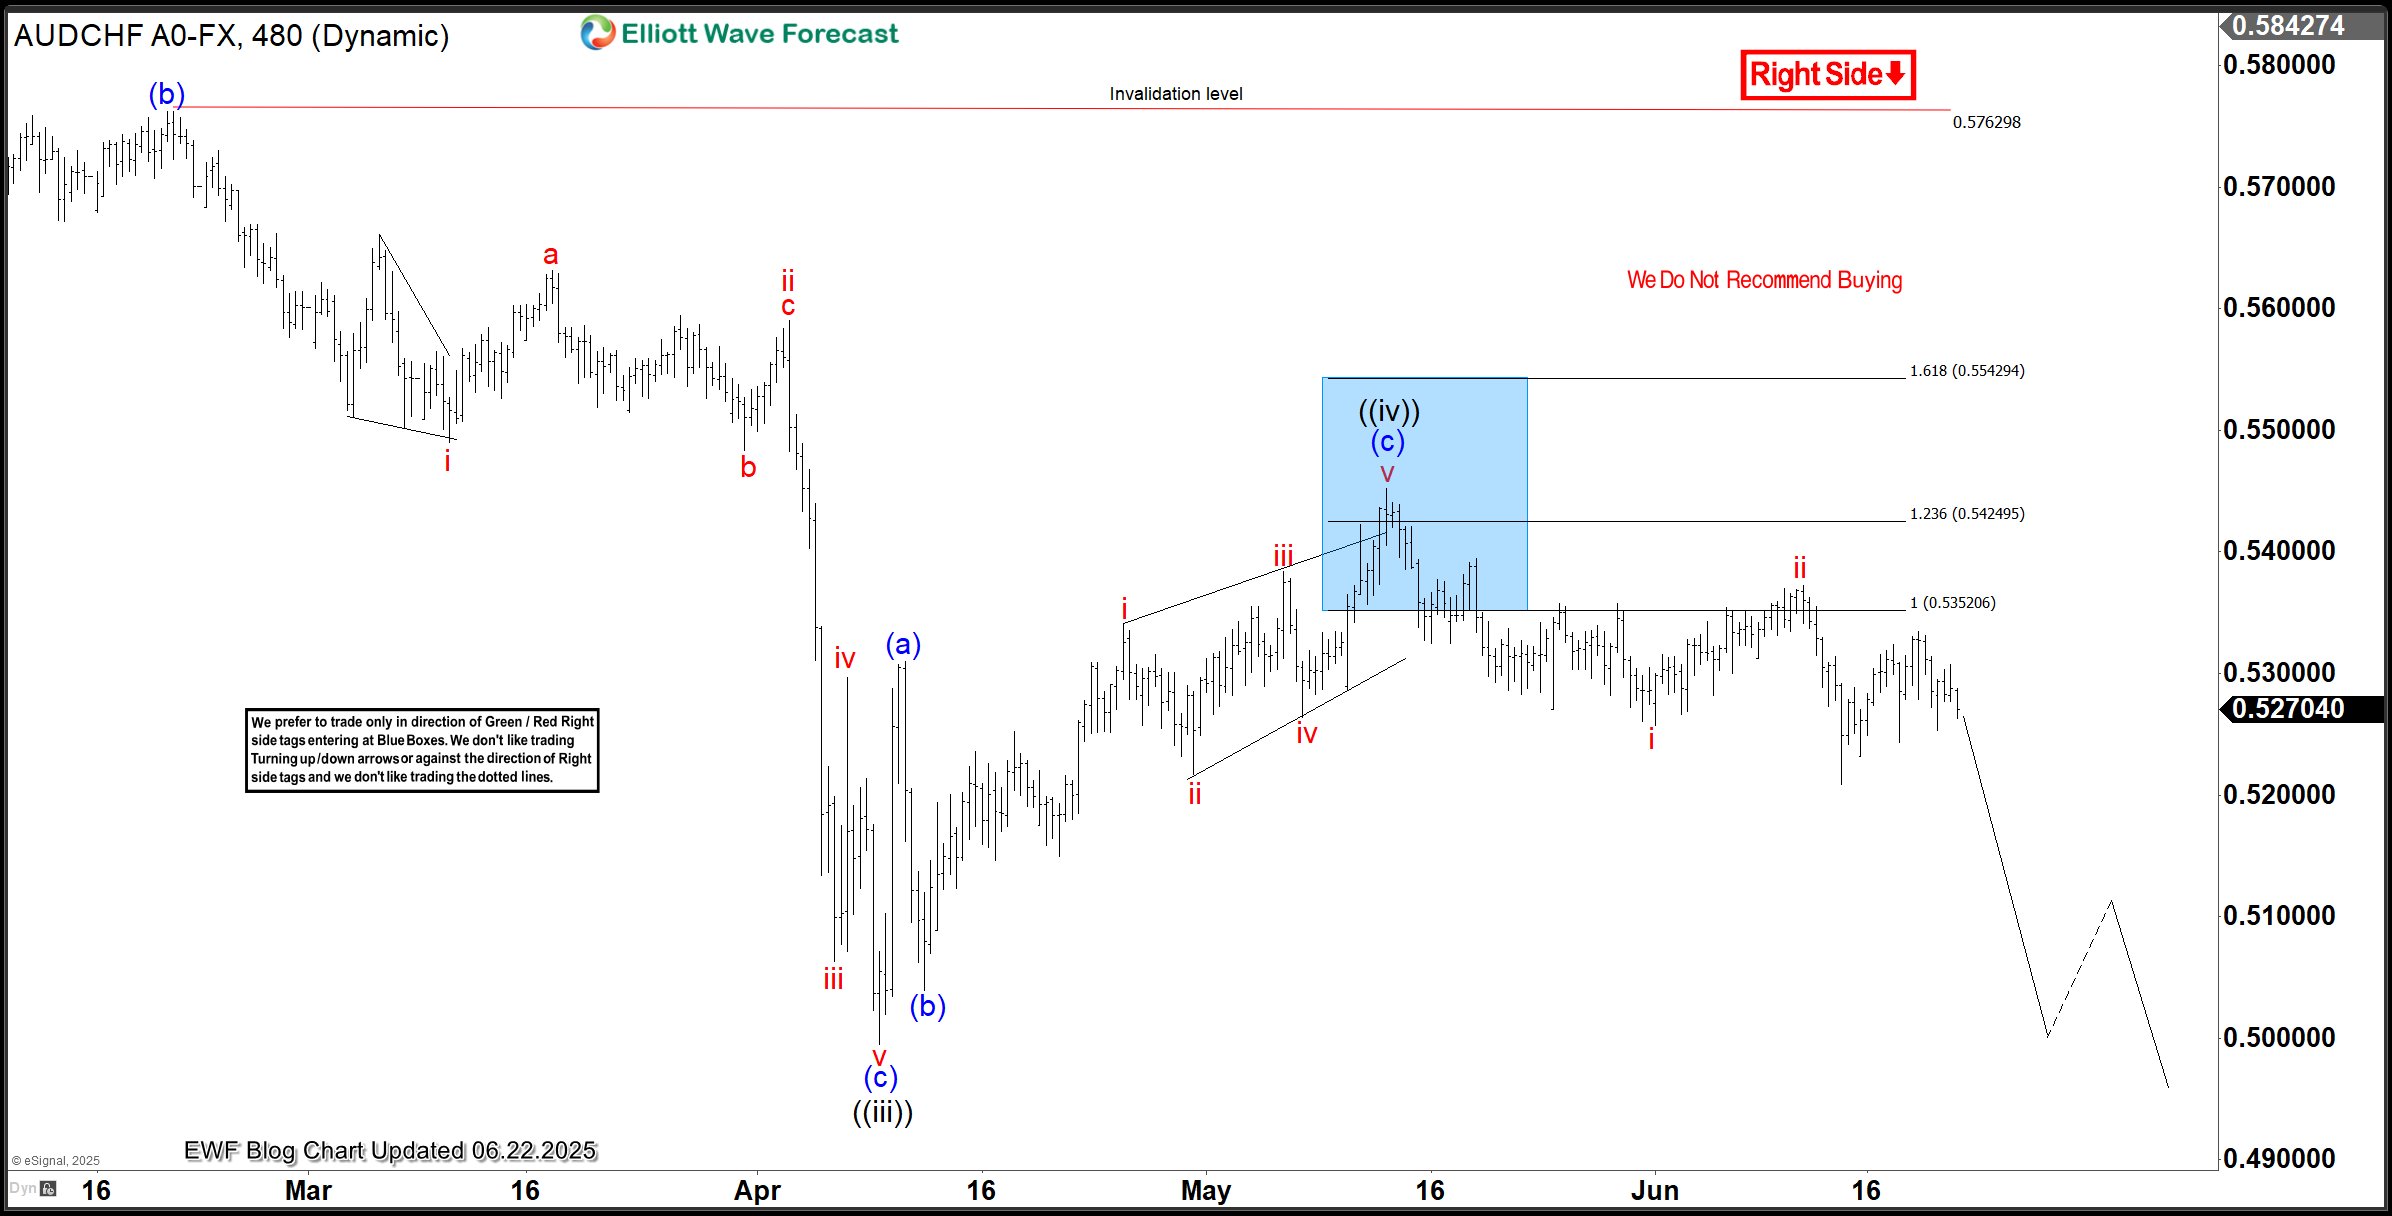
AUDCHF, H4
On the H4 chart above, the wave ((iv)) bounce found resistance at the extreme (blue box), and sellers sold. In the coming days, the pair is expected to reach at least 0.5178–0.5132, where sellers from the blue box could take some profit.
Going forward, sellers should either sell higher if ((iv)) makes a double correction higher, or wait for ((v)) to break below the ((iii)) low and then sell the next 3/7/11 swing bounce off the blue box. Ultimately, the next big opportunity will be to sell off the extreme of wave B, as the weekly chart shows.
GBPUSD Wave Analysis
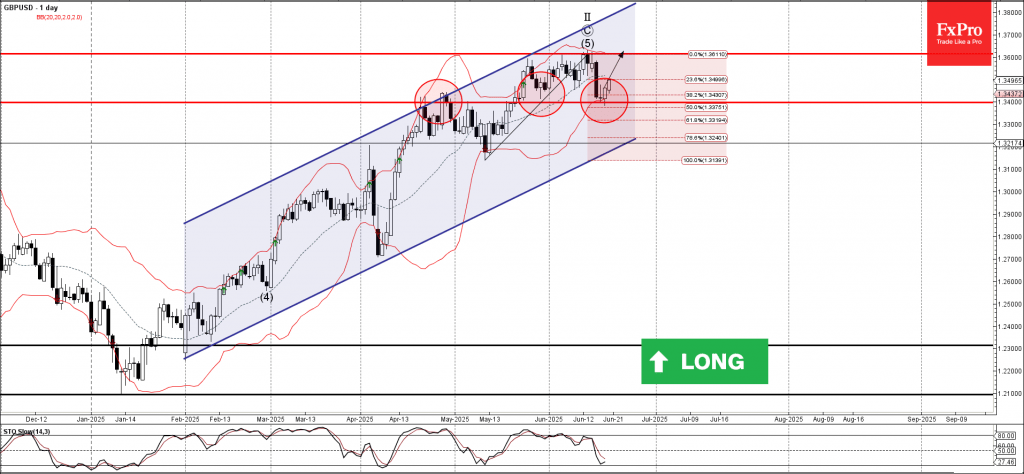
GBPUSD: ⬆️ Buy
- GBPUSD reversed from support zone
- Likely to rise to the resistance level at 1.3600
GBPUSD currency pair recently reversed up from the support zone located between the support level 1.3400 (former resistance from April), lower daily Bollinger Band and 50% Fibonacci correction of the upward impulse from May.
The upward reversal from this support zone continues the active daily uptrend from the start of this year.
GBPUSD currency pair can be expected to rise to the next resistance level at 1.3600 (which stopped the previous impulse wave (5) earlier this month).
Markets Weekly outlook – US PCE, GDP , Canadian CPI and Many Speeches from Heads of Central Banks
Week in review: Central Bank Rate decisions and ongoing Israel-Iran conflict
Geopolitical tensions remain high as Iran continues launching ballistic missiles toward Israel, prompting retaliatory strikes from Israel on Iranian military and nuclear infrastructure.
While headlines are still arriving by the minute, the market’s sensitivity has declined somewhat this week, with the conflict increasingly priced in.
Equity indices corrected earlier but rebounded midweek—now selling off again as traders close positions ahead of the weekend, pricing in renewed geopolitical risk.
What has stirred markets more recently is the possibility of U.S. intervention in the conflict. President Trump has indicated a decision may come within the next two weeks, adding a layer of uncertainty.
For position traders, it’s worth noting the elevated risk of price gaps when markets reopen on Sunday evening.
U.S. crude oil is trading higher on the week but has pulled back after a failed breakout attempt near key resistance, closing the week around $75.
On the monetary policy front, major central banks—including the Fed, Bank of England, Swiss National Bank, Bank of Japan, and People’s Bank of China—held rate decisions this week.
Only the SNB moved, cutting rates to 0% and signaling that a return to negative territory remains on the table if the Swiss franc strengthens excessively. This reflects growing concern over a slowing domestic economy and weakening exports.
In forex, the U.S. dollar staged a comeback as dollar selling positions became overcrowded and risk sentiment tilted more cautious. Traders are leaning back into the greenback amid global uncertainty.
The Week ahead: Inflation reports, Central Bank heads scheduled
Keep your expectations for volatility high, with conflict headlines still being released throughout the day in every session and a potential US Intervention that would surely be market moving.
Asia Pacific Markets - Australian CPI and another Inflation data point for Japan
APAC Markets aren't the busiest in the upcoming week but one thing to look at is a reversal of previous week gains on currencies such as the AUD and NZD, which had decent performance since the RBA and RBNZ Rate Decisions.
Tuesday evening should see the release of the Australian May Inflation report expected at 2.4% year-over-year.
Further reports on Japanese Inflation for June are also expected on Thursday at 19:30 ET with the Core data expected at 3.3% y/y.
Economic Data from Europe, UK and North America – US GDP, PCE and Canada CPI
This week also won't be the busiest in terms of data release, however markets will surely brace for both the US GDP and the Core PCE as markets keep assembling data on the effect of US Tariffs on the world's largest economy.
Core PCE data is expected at 0.1% month-over-month (Friday morning 8:30 ET) and the annualized Q1 GDP figure expected at -0.2% on Thursday at 8:30 A.M.
Canada will also see the release of their own CPI report on Wednesday at 8:30, with the Headline data forecasted at 1.5% and Core CPI expected at 2.6%.
Other than data, many Heads of Central Banks will be speaking with ECB's Lagarde on Monday speaking at the European Parliament in Brussels, Fed Chair Powell testifying on Wednesday (usually accompanied with a speech on Monetary outlooks), BOE's Bailey talking at the British Chambers of Commerce Global Annual Conference on Thursday.
FED's Williams will also be speaking on Friday (7:30) in Basel, Switzerland where we will see his own view on the upcoming Rate Decision after this morning's dovish surprise from Chris Waller.
Also, as always, stay in touch with the latest developments in the Middle-East to avoid being on the wrong side of sudden volatility spikes!
For all market-moving economic releases and events, see the MarketPulse Economic Calendar.
US Dollar performance versus other Forex Major counterparts
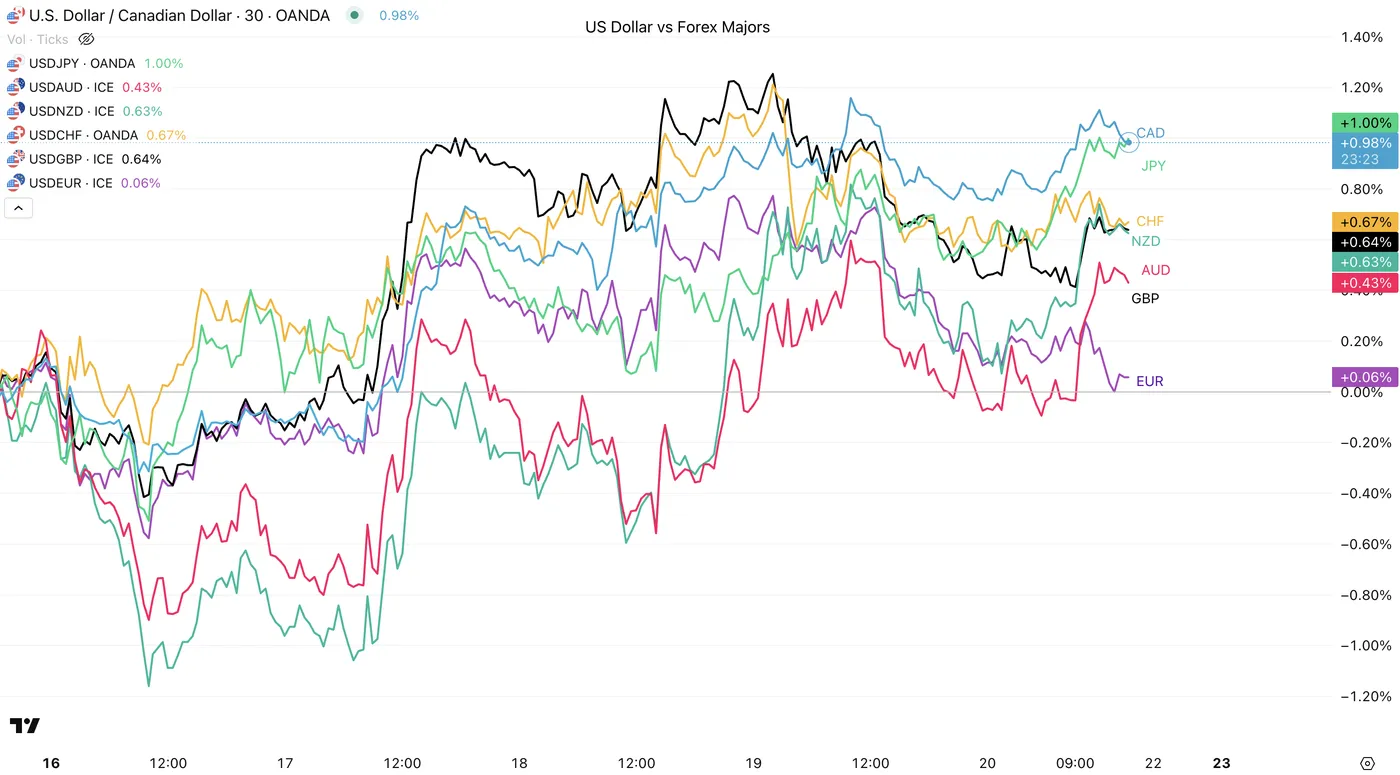
US Dollar performance vs Major Counterparts, June 20, 2025 – Source: TradingView
Have a good weekend, and Safe Trades for the week ahead!
Dollar Leads, But Euro’s Structural Story Gains Momentum
Markets were adrift last week as traders grappled with intensifying global risks. The unresolved twin threats of a full-blown trade war and escalating Middle East conflict kept investors on the defensive. Despite some tentative diplomatic efforts, neither front showed meaningful progress, leaving equities vulnerable after months of sustained gains. With investor confidence fraying, global indexes may soon face deeper corrections.
Amid the cautious mood, Dollar took the lead, buoyed by Fed’s policy hold and slower projected easing. Yet beneath the surface, Euro is gaining traction on improving confidence in the Eurozone economy, and divergence of ECB policy and other central banks.
In the week’s performance table, Euro and Aussie followed the greenback near the top. At the other end, Yen underperformed the most as doubts on BoJ rate hike grew. Sterling struggled on soft UK data, while Loonie also underwhelmed. Swiss Franc and Kiwi held to the middle of the pack.
Dual Pressures of Tariff Uncertainty and Middle East Conflict Continue
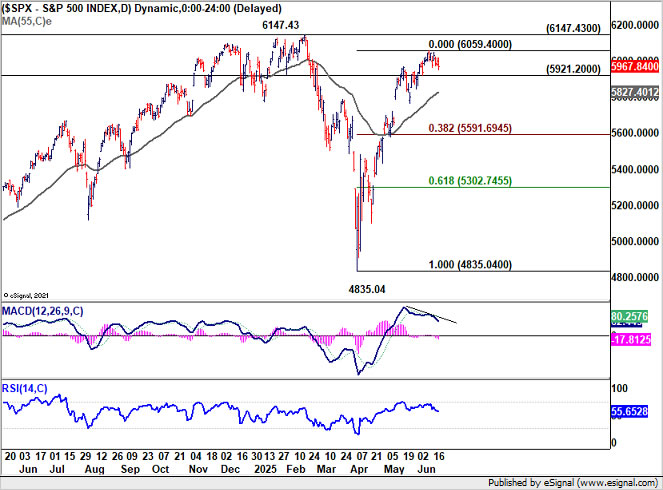
Global markets struggled for direction last week, as trade and geopolitical tensions weighed heavily on investor sentiment. Despite some optimism around diplomatic overtures, the outlook remains clouded by slow-moving negotiations and unresolved flashpoints. S&P 500, like many global indices, continued to show signs of fatigue amid the rising uncertainty.
On the geopolitical side, the highly anticipated meeting in Geneva between European foreign ministers and Iran's Abbas Araqchi yielded little progress. Iran reiterated its refusal to negotiate under threat and demanded that Israel cease its attacks and face accountability. While Tehran expressed openness to discussing uranium enrichment limits, it drew a firm red line against a full ban.
The fragile optimism quickly also faded as Israel and Iran exchanged fresh missile attacks on Saturday. The renewed violence signals that tensions are likely to persist into the coming week and beyond. While direct US intervention remains on hold, the risk of escalation remains ever-present and continues to cast a shadow over markets.
Meanwhile, there was scant progress on the trade front. It's reported that the EU is now pushing for a 10% reciprocal tariff framework to align with the US-UK deal, but no breakthrough has been reported. Canada's Prime Minister Mark Carney has threatened retaliatory tariffs by late July on US steel and aluminum imports. Meanwhile, Japan canceled a key bilateral security dialogue with Washington, as disputes over defense spending and trade policy intensified. The cancellation is a symbolic setback, revealing just how strained relations have become.
The most pressing concern for markets is the ticking clock on the 90-day tariff truce. With less than three weeks remaining, there's growing anxiety that US President Donald Trump may soon issue unilateral tariff letters to multiple trading partners. A unilateral tariff escalation could trigger sharp market reactions, especially given how sensitively investors have been pricing trade-related risk into both equities and currencies.
Technically, S&P 500 continued to lose upside momentum as seen in D MACD. While further rise cannot be ruled out, considering bearish divergence condition, strong resistance should emerge from 6147.43 high to limit upside. On the downside, break of 5921.20 support will be the first sign of short term topping, and bring deeper pullback to 55 D EMA (now at 5827.40). Further break there will target 38.2% retracement of 4835.04 to 6059.40 at 5991.69, with risk of near term bearish reversal.
Dollar Holds Ground on Fed Caution, While Waller Breaks Ranks
Dollar found a degree of footing last week as expectations around Fed policy injected some near-term stability. As anticipated, Fed kept its target range unchanged at 4.25–4.50%. The updated dot plot revealed a slower-than-expected easing path. While two rate cuts are still projected for 2025, the median forecast now sees just one cut per year in both 2026 and 2027, lifting the year-end federal funds rate forecasts to 3.6% and 3.4%, respectively.
Yet Fed Chair Jerome Powell was forthright in tempering the significance of these projections, saying no policymakers held their rate path “with a great deal of conviction.” The central bank’s Monetary Policy Report to Congress followed up with similar caution, noting that while tariff-induced inflation may be showing up in goods prices, it remains too early to assess the overall impact.
Nevertheless, Fed Governor Christopher Waller broke ranks slightly, floating the possibility of a rate cut as soon as July. Waller argued that the inflation impact from tariffs would likely be one-off and non-persistent. More concerning to him was the potential for labor market deterioration.
Waller's divergence from other Fed colleagues comes at a sensitive time politically. Powell’s current term expires in May 2026, and the likelihood of Trump installing a new Fed Chair—potentially someone more aligned with his view on interest rates—is growing. Waller, a 2020 Trump appointee to Fed Board, may be in the running. While no formal shortlist has emerged, markets may grow increasingly sensitive to such succession politics in coming months.
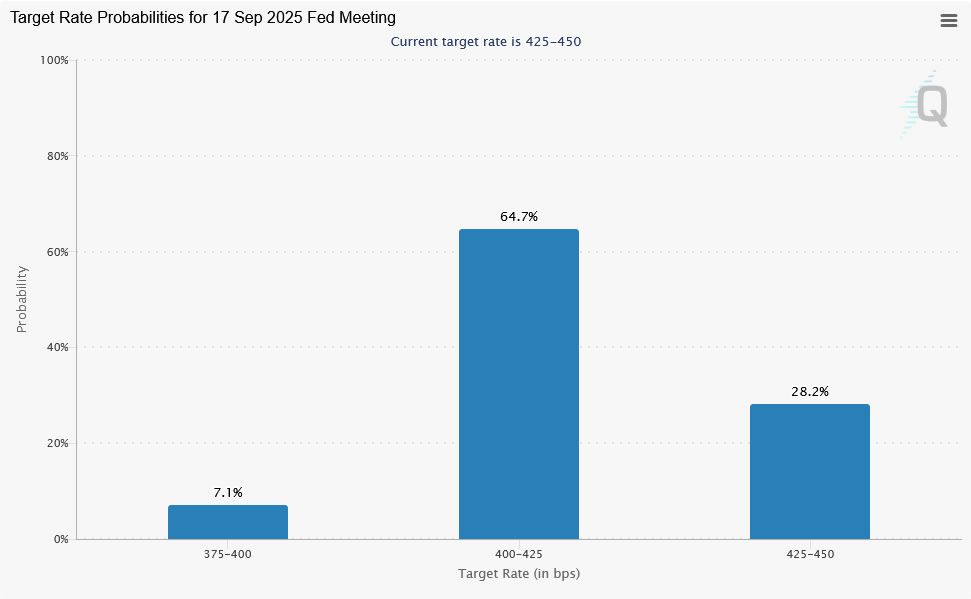
Despite Waller’s comments, market expectations for a July cut remain subdued, with fed fund futures still assigning a nearly 90% probability to a hold. September remains the market’s favored timeline for the next move, with over 70% chance.
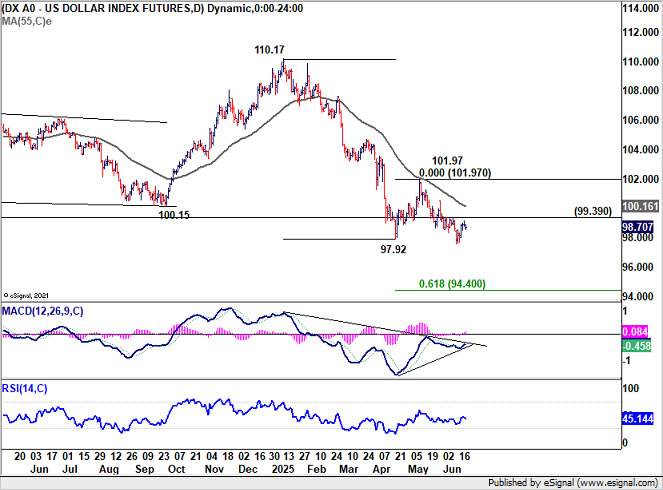
Technically, there is no clear sign of bottoming in Dollar Index yet with 99.39 resistance intact. Recent decline from 110.17 is still in favor to continue towards 61.8% projection of 110.17 to 97.92 from 101.97 at 94.40.
However, momentum could further diminish on the next fall. Selloff in Dollar is unlikely to be as one-sided as seen earlier in the year. At least, Yen would stay pressured due to diminishing hope of another BoJ rate hike this year. Commodity currencies and Sterling could be pressured if risk sentiment turned sour.
Meanwhile, firm break of 99.39 will confirm short term bottoming, and bring rebound through 55 D EMA (now at 100.16).
Euro Set to Outperform Again on Economic Optimism and Diverging Policy Paths
While the Dollar ended the week as the top performer, it’s Euro that is quietly showing greater underlying strength. EUR/USD’s late-week jump suggests the pair may soon breakout of range, with Euro outperforming the greenback again. Supporting this outlook is a clear improvement in economic sentiment, most notably in Germany, the Eurozone’s growth engine.
The June ZEW survey showed a remarkable 22.3-point jump in economic sentiment to 47.5. Current conditions improved by 10 points—the strongest rise in over a year. Growing investment and consumer demand are behind the pickup, helped by fiscal measures from the new German government. This policy mix, together with ECB’s earlier rate cuts, could finally lift Germany out of the stagnation that’s persisted for nearly three years.
Additionally, ECB’s easing cycle is certainly nearing its conclusion, possibly with just one recalibration cut remaining. That sets it apart from central banks like BoE, which is still on a "gradual and cautious" rate reduction path, and SNB, which may be forced into negative rates again. Even Fed, which has been on pause since late 2024, may soon re-join the global easing trend once tariff-driven inflation uncertainties clear.
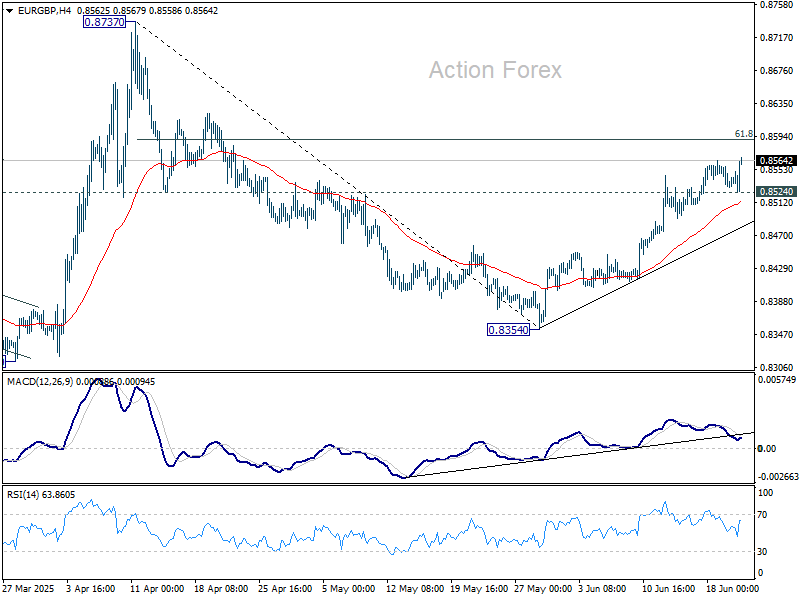
The technical picture supports Euro strength across the board too. EUR/GBP's rebound from 0.8354 extended higher last week. Further rise is expected to 61.8% retracement of 0.8737 to 0.8354 at 0.8591. Firm break there will pave the way to 0.8373 resistance.
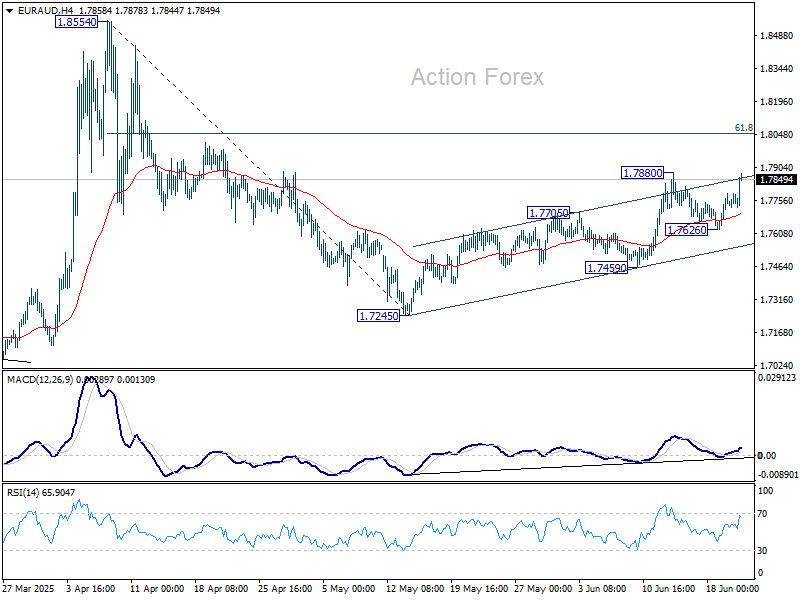
EUR/AUD's late rally suggests that retreat from 1.7880 might have completed at 1.7626 already. Break of 1.7880 will target 61.8% retracement of 1.8554 to 1.7245 at 1.8054. Firm break there will pave the way to 1.8554.
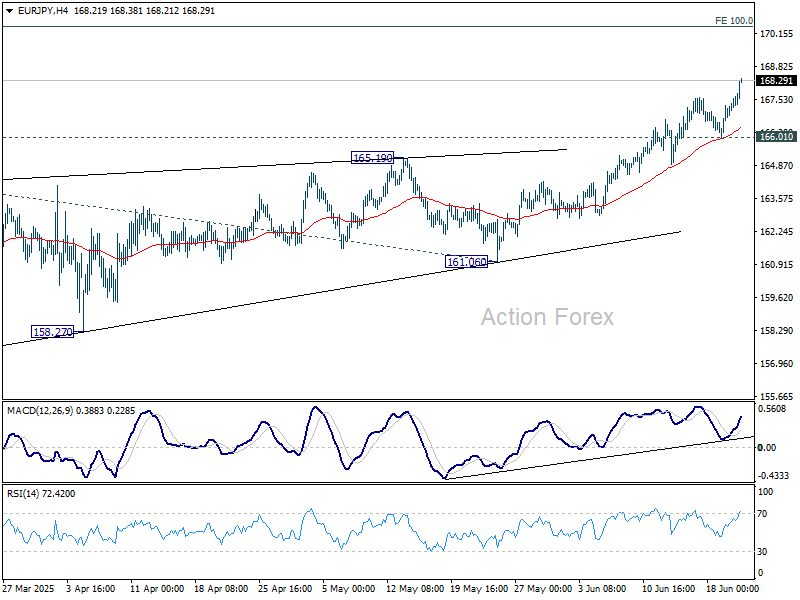
EUR/JPY's near term rise also continued last week, and it's on track to 100% projection of 154.77 to 164.16 from 161.06 at 170.45 next.
EUR/USD Weekly Outlook
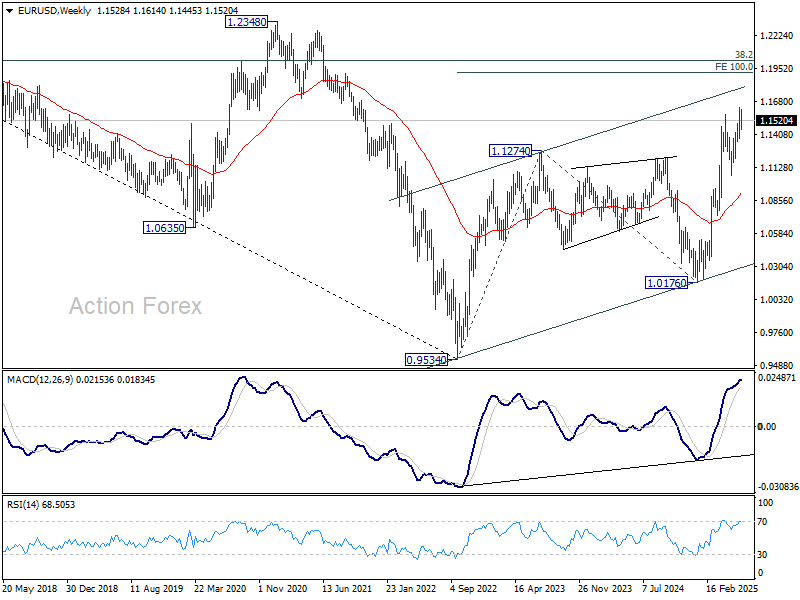
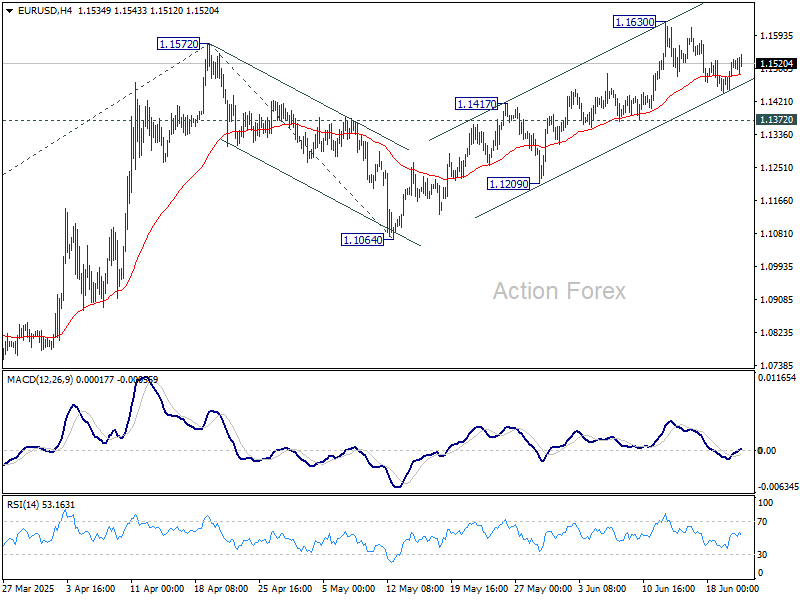
EUR/USD stayed in consolidations below 1.6300 last week and outlook is unchanged. Initial bias remains neutral this week first. Further rise is expected as long as 1.1372 support holds. Firm break of 1.1630 will resume the rise from 1.1076 and target 61.8% projection of 1.0176 to 1.1572 from 1.1064 at 1.1927 next.
In the bigger picture, rise from 0.9534 long term bottom could be correcting the multi-decade downtrend or the start of a long term up trend. In either case, further rise should be seen to 100% projection of 0.9534 to 1.1274 from 1.0176 at 1.1916. This will now remain the favored case as long as 1.1604 support holds.
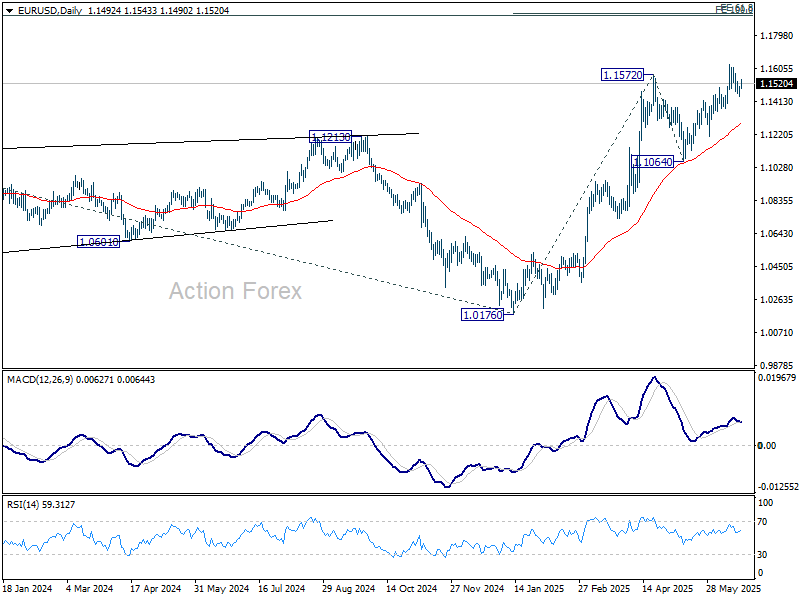
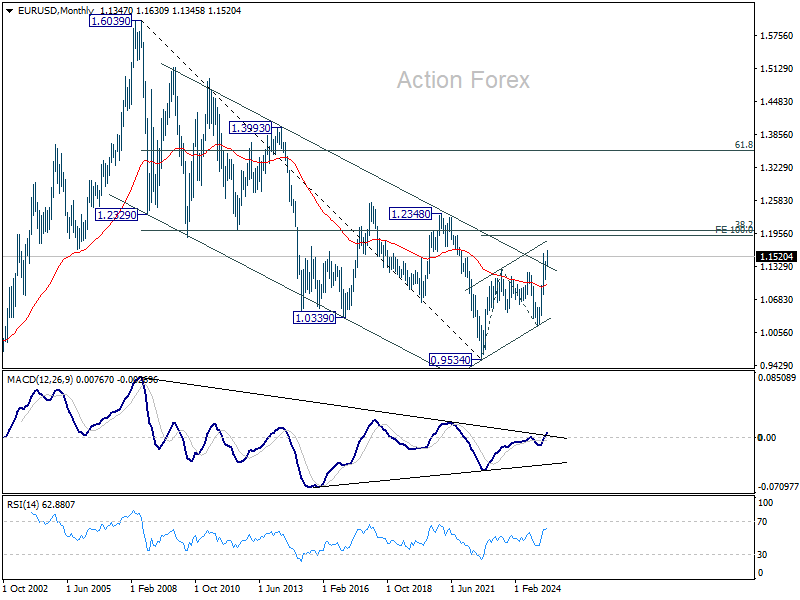
In the long term picture, a long term bottom should be in place already at 0.9534, on bullish convergence condition in M MACD. Rise from there could be a corrective bounce or the start of an up trend. In either case, next target is 38.2% retracement of 1.6039 to 0.9534 at 1.2019.