
Sample Category Title
EUR/USD Daily Outlook
Daily Pivots: (S1) 1.1492; (P) 1.1518; (R1) 1.1548; More...
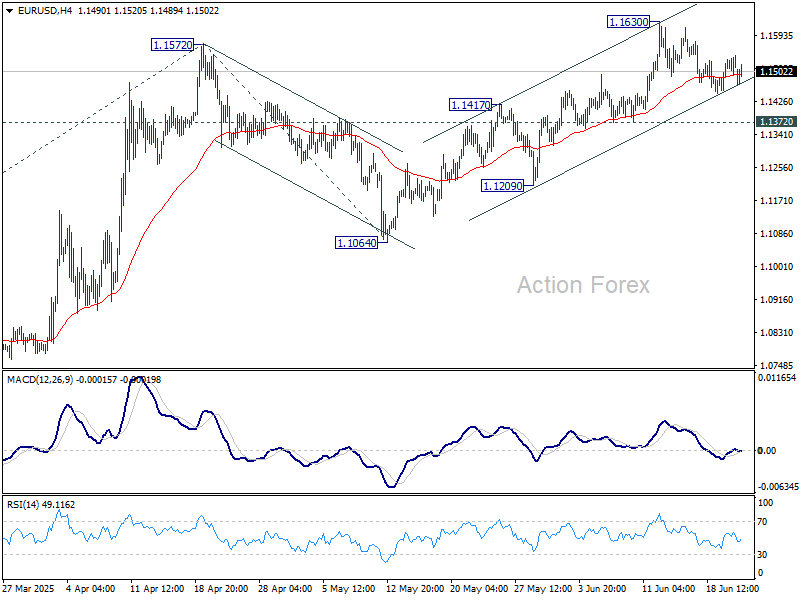
EUR/USD is staying in consolidations below 1.1630 and intraday bias remains neutral. With 1.1372 support intact, further rally is expected. Break of 1.1572 will extend the rise from 1.0176. Next target is 61.8% projection of 1.0176 to 1.1572 from 1.1064 at 1.1927. However, break of 1.1372 support will indicate short term topping, and turn bias to the downside for deeper pullback.
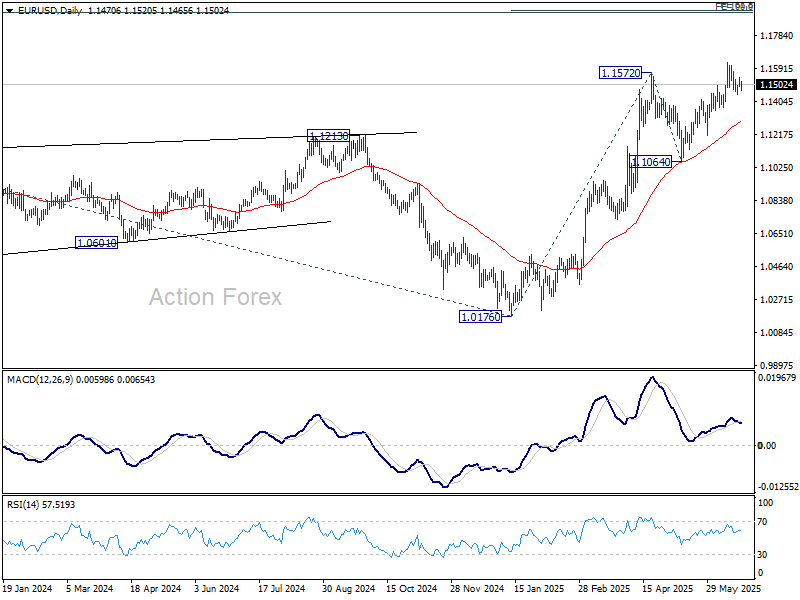
In the bigger picture, rise from 0.9534 long term bottom could be correcting the multi-decade downtrend or the start of a long term up trend. In either case, further rise should be seen to 100% projection of 0.9534 to 1.1274 from 1.0176 at 1.1916. This will now remain the favored case as long as 1.1604 support holds.
USD/JPY Daily Outlook
Daily Pivots: (S1) 144.88; (P) 145.32; (R1) 145.91; More...
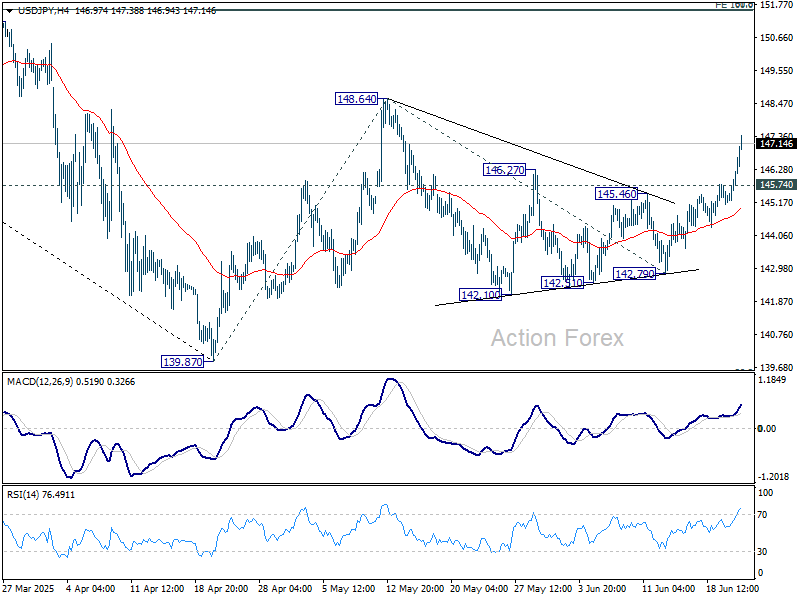
USD/JPY accelerates higher today and intraday bias stays on the upside for 148.64 resistance. Firm break there will suggest that rise from 139.87 is reversing the fall from 158.86. Next target is 100% projection of 139.87 to 148.64 from 142.79 at 151.56. On the downside, below 145.74 minor support will turn intraday bias neutral first.
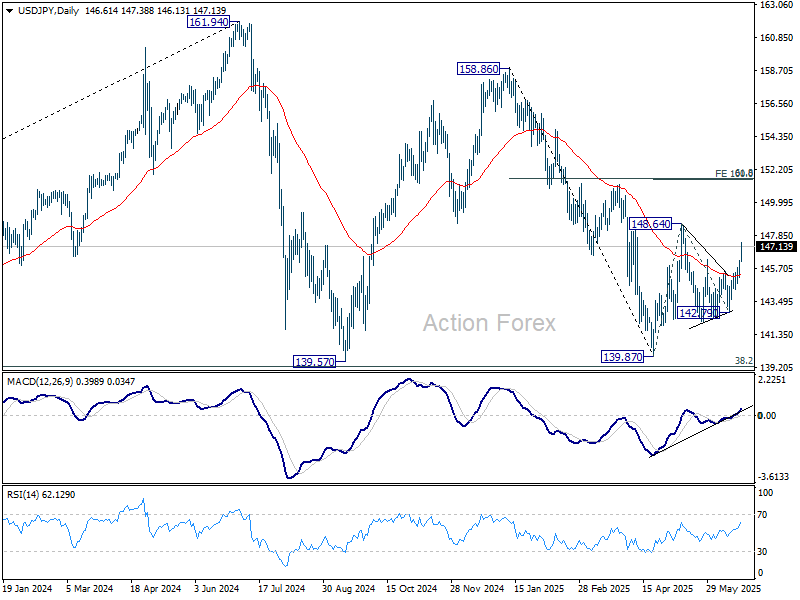
In the bigger picture, price actions from 161.94 are seen as a corrective pattern to rise from 102.58 (2021 low), with fall from 158.86 as the third leg. Strong support should be seen from 38.2% retracement of 102.58 to 161.94 at 139.26 to bring rebound. However, sustained break of 139.26 would open up deeper medium term decline to 61.8% retracement at 125.25.
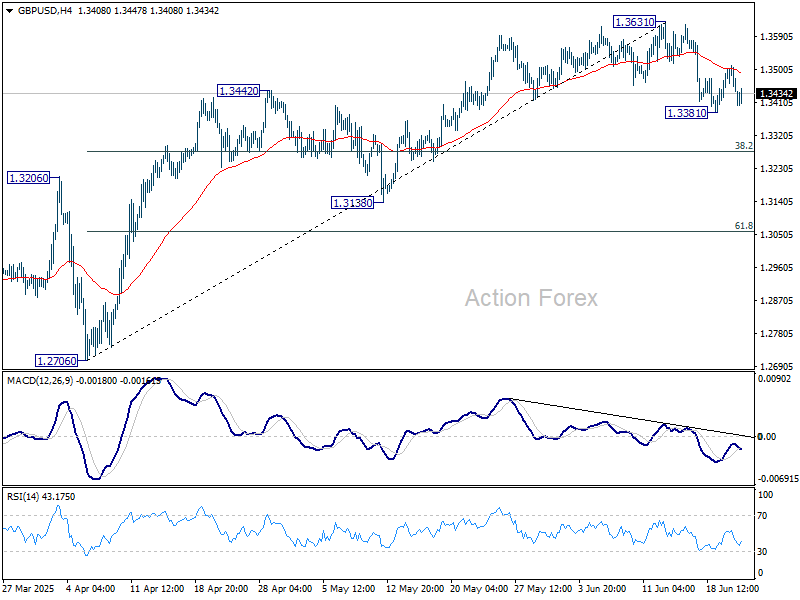
GBP/USD Daily Outlook
Daily Pivots: (S1) 1.3422; (P) 1.3467; (R1) 1.3492; More...
Intraday bias in GBP/USD remains neutral for the moment. Risk will stay mildly on the downside as long as 1.3631 resistance holds. Below 1.3381 will extend the corrective fall to 38.2% retracement of 1.2076 to 1.3631 at 1.3278.
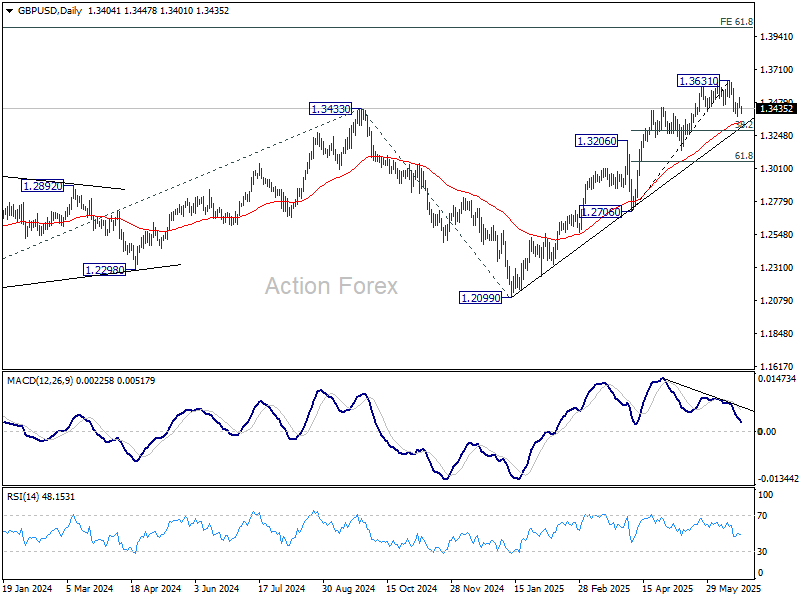
In the bigger picture, up trend from 1.3051 (2022 low) is in progress. Next medium term target is 61.8% projection of 1.0351 to 1.3433 from 1.2099 at 1.4004. Outlook will now stay bullish as long as 55 W EMA (now at 1.2923) holds, even in case of deep pullback.
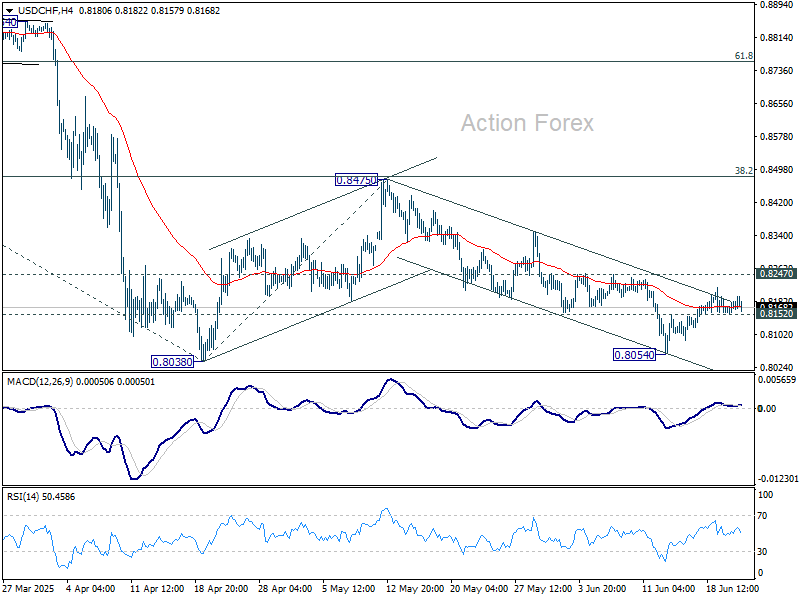
USD/CHF Daily Outlook
Daily Pivots: (S1) 0.8160; (P) 0.8173; (R1) 0.8193; More….
Intraday bias in USD/CHF remains neutral for the moment. Further decline is expected as long as 0.8247 resistance holds. On the downside, below 0.8054 will bring retest of 0.8038 low first. Firm break there will resume larger down trend to 61.8% projection of 0.9200 to 0.8038 from 0.8475 at 0.7757. Nevertheless, firm break of 0.8247 will extend the corrective pattern from 0.8038 with another rising leg, and target 0.8475 resistance again.
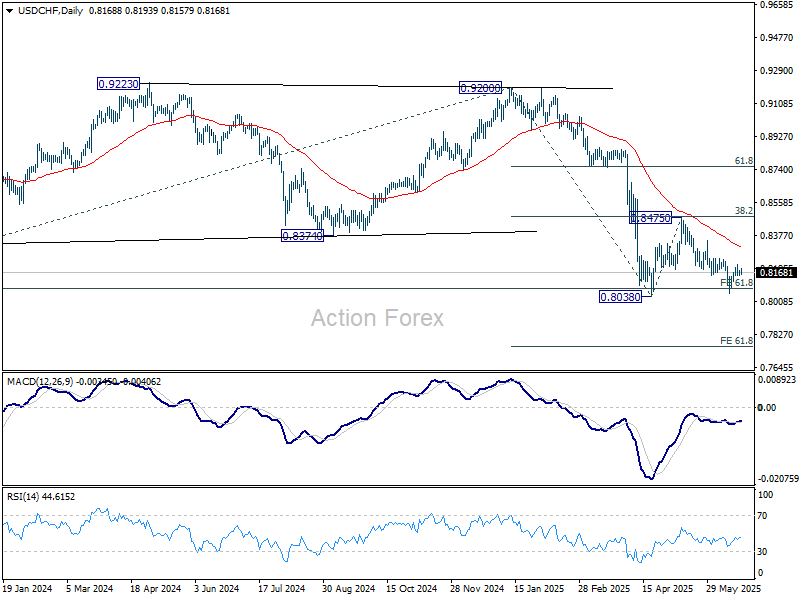
In the bigger picture, long term down trend from 1.0342 (2017 high) is still in progress and met 61.8% projection of 1.0146 (2022 high) to 0.8332 from 0.9200 at 0.8079 already. In any case, outlook will stay bearish as long as 55 W EMA (now at 0.8640) holds. Sustained break of 0.8079 will target 100% projection at 0.7382.
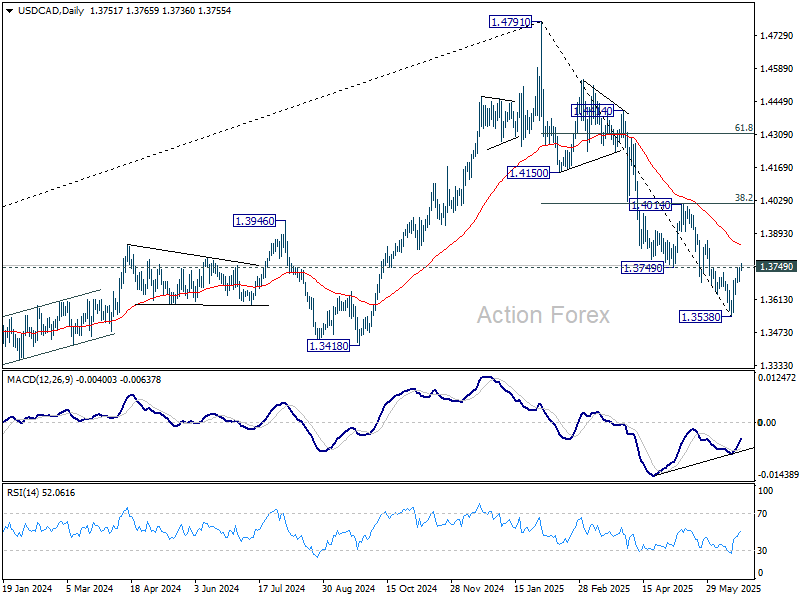
USD/CAD Daily Outlook
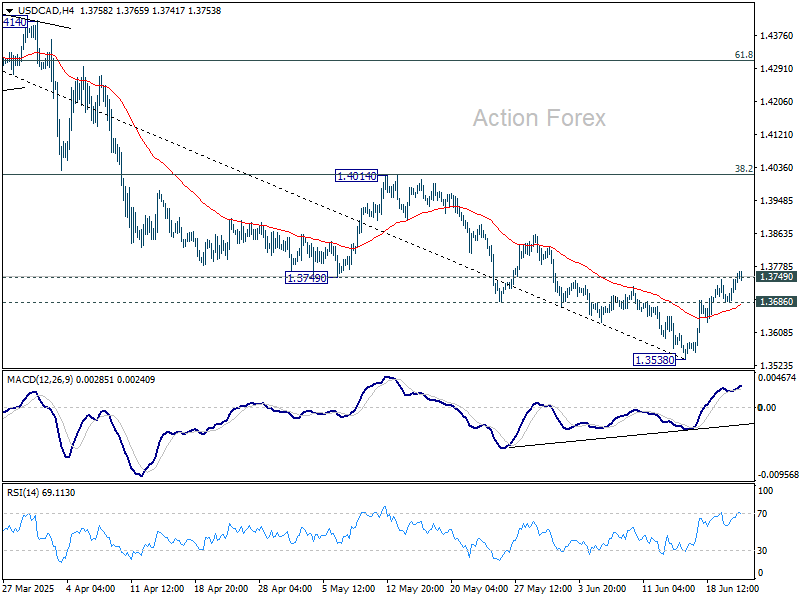
Daily Pivots: (S1) 1.3699; (P) 1.3723; (R1) 1.3759; More...
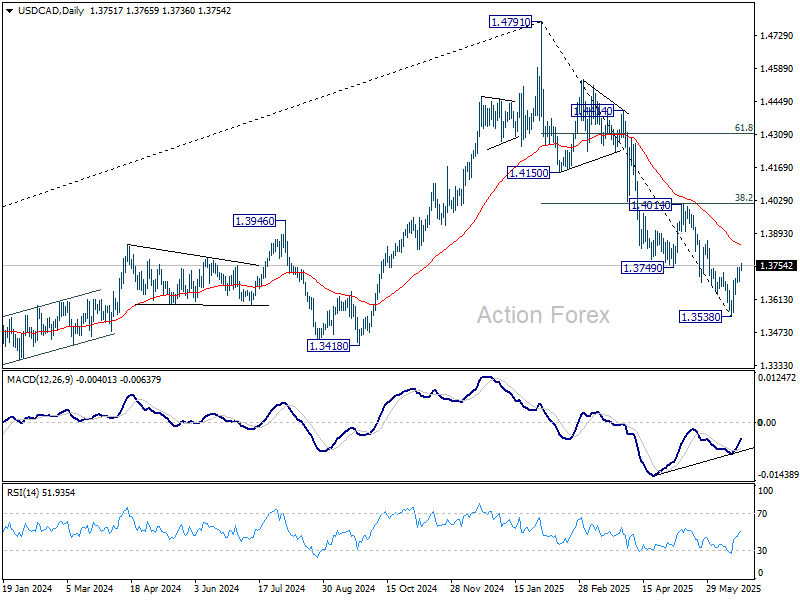
USD/CAD's breach of 1.3749 support turned resistance suggests short term bottoming in D MACD, on bullish convergence condition in 4H MACD. Rebound from 1.3538 is seen as forming a corrective pattern from to the five-wave decline from 1.4791. Intraday bias is now mildly on the upside for 55 D EMA (now at 1.3839) and above. But upside should be limited by 1.4014 cluster resistance (38.2% retracement of 1.4791 to 1.3538 at 1.4017), at least on first attempt. On the downside, below 1.3686 minor support will turn intraday bias neutral first.
In the bigger picture, price actions from 1.4791 medium term top could either be a correction to rise from 1.2005 (2021 low), or trend reversal. In either case, further decline is expected as long as 1.4014 resistance holds. Next target is 61.8% retracement of 1.2005 (2021 low) to 1.4791 at 1.3069.
Ever More Difficult to Hedge/React to (Geopolitical) Event Risk that Might Again Change Very Soon
Markets
European markets on Friday started with a cautious risk-on bias as US President Trump suggested that it could take up to two weeks for the US to decide whether to get involved in the military action against Iran. This kind of guidance of course still provided limited real visibility. The Eurostoxx 50 after a poor performance on Thursday closed 0.70% higher. US indices also opened positive after Juneteenth holiday but returned to a more cautious modus going into the weekend. (S&P 500 -0.2%). A similar reaction was visible in US yield markets. Yields initially gained a few bps but turned south later. Most Fed governors are holding the line that the Fed is in a good position the monitor the developments and decide later (e.g. Fed Daly, Barkin commenting). Fed Waller at least is a notorious exception to this rule as he is prepared to the consider a rate cut already at the July meeting. His comments at least contributed to the intraday reversal with US yields closing between 3.4 bps lower (2-y) and unchanged (30-y). Changes on the German yields were less than one bp across the curve. The dollar traded in the defensive for most of the day, but regained some momentum going into the close/weekend. (DXY close at 98.7 from 98.9, EUR/USD close 1.1523).
‘Two days’ also fell within US presidents Trump’s guidance of two weeks for the US to decide on the military action against Iran. Markets now try to assess the impact and the consequences of the US airstrike against Iran nuclear sites. The market focus now in the first place in is on a the potential retaliation of Iran. This adds another layer of uncertainty for the global economy and for markets. In a first reaction in Asia this morning, equities declined slightly, Brent oil briefly surpassed $80 p/b but eased back to $78. The dollar gained (modestly). Even so, the moves are limited and orderly. This might suggest that markets consider the Iran conflict will remain regional. At the same time, for markets it also becomes ever more difficult to hedge/react to (geopolitical) event risk that might again change very soon. In this respect, this morning’s modest reaction also feels a bit like ‘paralysis’ and being unable to anticipate the next step. US yields are marginally higher this morning. The dollar struggles to maintain early gains against the euro (EUR/USD 1.1505). The yen underperforms (USD/JPY 147.2). Geopolitical headlines will continue to set the tone for trading, but we also keep an eye at the preliminary PMI releases. European PMI’s printed rather bleak last month (50.2). For now, there is at least no better visibility on the outcome of the trade negotiations or on the geopolitical context. The US measure (expected at 52.1 from 53) last month still supported the Fed’s wait-and-see approach, but weaker figures might revive the market debate on an ‘earlier’ start (cf Waller supra). We also again take notice of the fact that geopolitical uncertainty at least at this stage isn’t a big support for the dollar, which is still captured in a sell-on-upticks pattern. ECB’s Lagarde also speaks to the European Parliament this afternoon.
News & Views
Japanese June PMIs improved across the board. The composite indicator rose from 50.2 to 51.4, the highest level in four months. The manufacturing sector printed the first 50+ reading since June 2024, thanks to renewed increase in output and stock purchases as well as a slightly quicker rise in employment. Demand conditions remain muted though as new (export) orders again declined. The services sector (51.5 from 51) signaled a stronger increase in new order flow, growing employment and accumulating backlogs. Both manufacturing and services input cost inflation held close to over a year-long low but remained sharp. Charged prices showed a diverging picture with manufacturing selling prices among the softest of the past four years but those in the services sector increased at the steepest pace since January. Japanese private sector firms remained cautious on the year-ahead outlook amid lingering trade uncertainty however. The PMIs had little impact on the yen this morning, being outweighed by the geopolitical (oil) narrative. USD/JPY rises to 147.1, the highest level since mid-May.
Sticking in Japan, PM’s Ishiba’s ruling party (Liberal Democratic Party) suffered a major blow in local assembly elections in Tokyo. His party won a record-low 22 seats in the 127-member assembly. The setback comes ahead of the July 20 upper house elections. A sizeable loss for the LDP could further cripple the wider coalition government’s ability to govern after lower house snap elections in October last year already stripped them off their majority. A cost of living crisis (with soaring rice prices as the poster child) is cited as one of the key reasons for the poor results. Ishiba has again pledged cash handouts for every citizen ahead of the upper house elections.
AUD/USD Daily Report
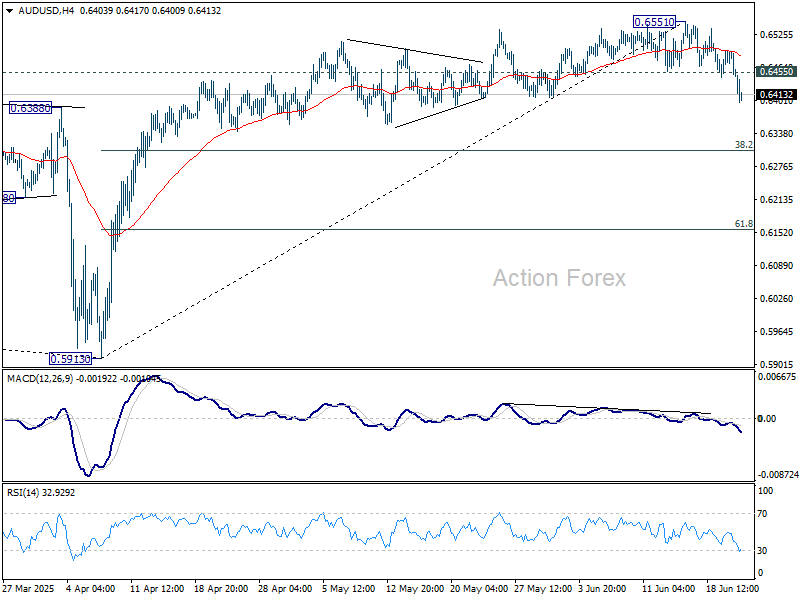
Daily Pivots: (S1) 0.6433; (P) 0.6465; (R1) 0.6481; More...
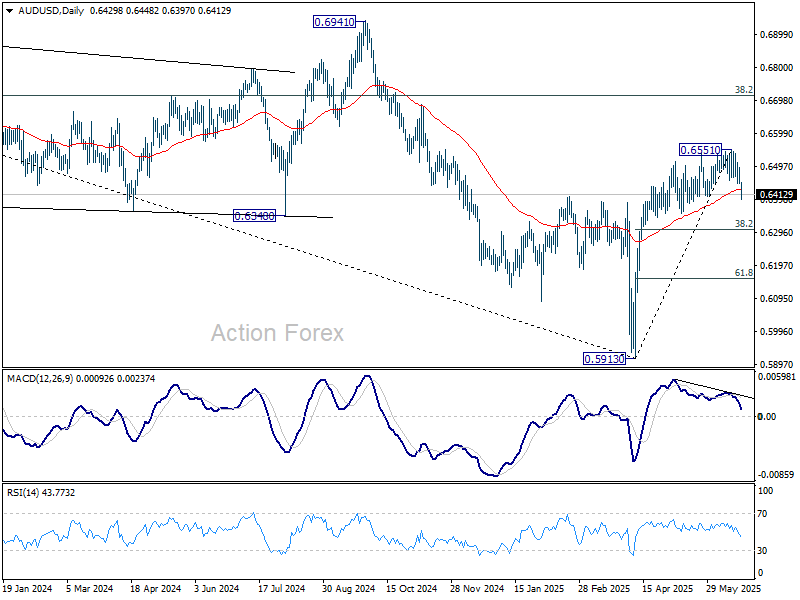
AUD/USD's downside acceleration today confirms short term topping at 0.6551. Intraday bias is now on the downside for 38.2% retracement of 0.5913 to 0.6551 at 0.6307, even as a correction. Strong bounce from there will keep the fall as a corrective move. However, decisive break of 0.6307 will argue that it's already reversing the rise from 0.5913 and target 61.8% retracement at 0.6157.
In the bigger picture, there is no clear sign that down trend from 0.8006 (2021 high) has completed. Rebound from 0.5913 is seen as a corrective move. While stronger rally cannot be ruled out, outlook will remain bearish as long as 38.2% retracement of 0.8006 to 0.5913 at 0.6713 holds. Nevertheless, considering bullish convergence condition in W MACD, even in case of another fall through 0.5913, downside should be contained above 0.5506 (2020 low).
Asia Shakes Off Iran Strike Fears, But Oil Market Still on Alert
Asian markets opened the week lower following the US military strikes on Iranian nuclear sites, marking a dramatic escalation in the Middle East. However, losses were limited and short-lived, with major indexes across the region quickly recovering earlier declines. Oil prices also staged a muted response. While WTI spiked on the news, the rally has since moderated.
There was no sign of panic selling (or buying in oil), suggesting that investors view the situation as contained for now. The tempered market reaction could be attributed to a sense of relief that a perceived nuclear threat in the region has been neutralized. Moreover, the conflict is currently isolated, with limited risk of broader regional contagion, at least in the near term.
Still, markets are not complacent. The possibility of Iran retaliating by disrupting oil shipments through the Strait of Hormuz remains a critical risk. The waterway handles roughly 20% of global crude flows, and any closure or threat to shipping lanes could propel WTI well above 100, as some analysts have warned.
In currency markets, nevertheless, safe haven demand is clearly evident. Swiss Franc is the strongest performer of the day so far. Dollar followed as it continues to benefit from Middle East tensions. Euro is also firmer, supported by its perceived reserve status. In contrast, commodity currencies such as the Aussie and Loonie are under pressure, alongside Yen and Pound.
Looking ahead, flash PMIs from the Eurozone, UK, and US will offer a crucial read on business sentiment as tariff and trade war effects ripple through supply chains. Later in the week, attention turns to Fed Chair Jerome Powell’s congressional testimony, though expectations for policy revelations remain low following last week’s FOMC hold and updated forecasts.
Technically, USD/CAD's breach of 1.3749 support confirms short term bottoming at 1.3538, on bullish convergence condition in D MACD. Rebound from there is now see as forming a corrective pattern to the five-wave decline from 1.4791. Further rise should be seen in the near term to 55 D EMA (now at 1.3839). But strong resistance should be seen from 1.4014 cluster resistance (38.2% retracement of 1.4791 to 1.3538 at 1.4017) to limit upside, at least on first attempt.
In Asia, at the time of writing, Nikkei is down -0.18%. Hong Kong HSI is up 0.65%. China Shanghai SSE is up 0.68%. Singapore Strait Times is down 0.26%. Japan 10-year JGB yield is up 0.008 at 1.411.
WTI oil soars on US strikes in Iran; 80 now the line between calm and 100+ chaos
WTI crude surged at the start of the week as geopolitical tensions flared after US airstrikes hit Iranian nuclear targets over the weekend. The move marks a dramatic escalation in the long-simmering conflict between Iran and Israel, now drawing in direct US involvement. Investors are now awaiting Tehran’s next move after Iranian officials said “all options” remain on the table in response.
Attention is now centered on the Strait of Hormuz, a strategic waterway through which one-fifth of the world’s oil flows. Iranian lawmakers have approved a non-binding motion to shut down the strait, though the final decision lies with the National Security Council. Any disruption to shipments through Hormuz would have a profound impact on global supply chains and energy prices.
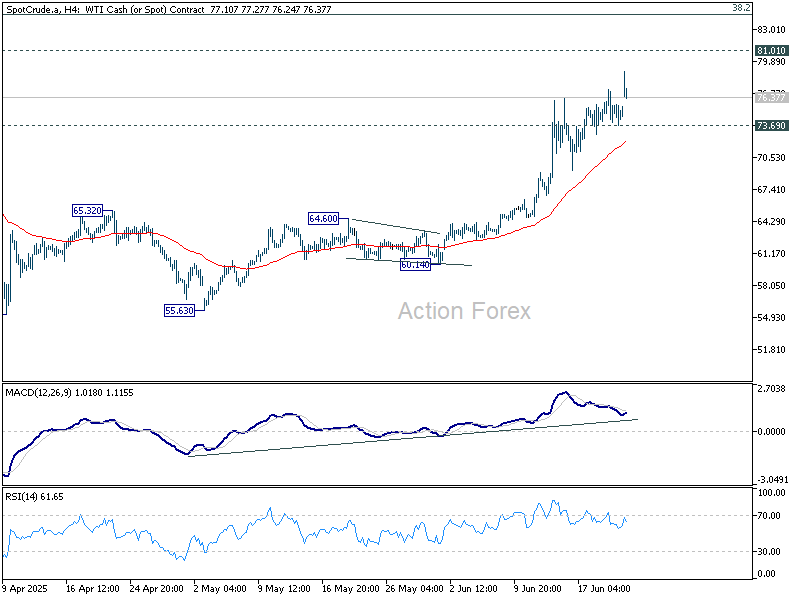
Technically, WTI crude’s surge from the 55.20 low is now approaching a key resistance at 81.01. Barring a broader escalation, the rally could stall here, especially with overbought momentum indicators flashing caution. A break below 73.69 would be an early sign of stabilization and may trigger profit-taking correction.
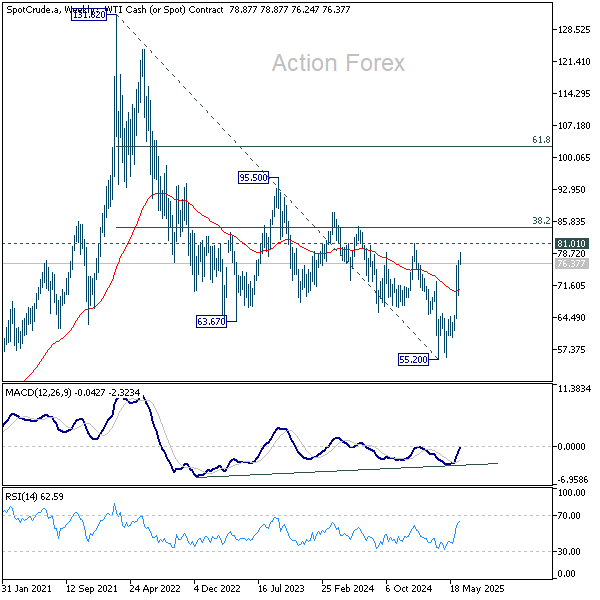
But if the conflict deepens and prices break decisively above 81.01, the rally could accelerate toward through 38.2% retracement of 131.82 (2022 high) to 55.20 at 84.46. Sustained break above 84.46 would mark a significant reversal of the long-term downtrend from the 2022 high and open the path to 95.50 or even to 61.8% retracement at 102.55.
With tensions high and the market highly headline-sensitive, holding below 80 will be key to preventing a return to 100+ oil—and renewed inflationary concerns worldwide.
Japan PMI composite rises to 51.4, but trade uncertainty weighs on demand
Japan’s private sector showed a modest rebound in June, with PMI Composite rising from 50.2 to 51.4, the highest reading since February. The pickup was led by stronger services sector, which rose from 51.0 to 51.5. PMI Manufacturing returned to expansion territory at 50.4, up from 49.4.
Annabel Fiddes of S&P Global noted that business activity gained momentum into quarter-end, but demand conditions remained fragile. New business rose only slightly, while foreign demand for manufactured goods weakened further. Firms cited ongoing concerns over US tariffs and global trade uncertainty, which continued to weigh on client orders and export sales.
Still, there were signs of easing cost pressures, with input prices rising at the slowest pace in 15 months. Employment also improved, with overall job creation accelerating to the fastest rate in nearly a year.
Australia PMIs improve modestly, support case for further RBA cuts
Australia’s private sector showed modest improvement in June, with the S&P Global PMI Composite rising from 50.5 to 51.2. PMI Services climbed from 50.6 to 51.3, while PMI manufacturing held steady at 51.0.
According to S&P Global’s Jingyi Pan, forward-looking indicators present a mixed picture. While output expectations remain positive, divergences between sectors were notable. New orders and future output softened more clearly in manufacturing, while services continued to gain traction. Weak external demand remains a concern, with export orders seeing their sharpest drop in nearly a year.
Combined with signs of easing inflation and slower employment growth, the PMI report supports the case for further rate cuts by RBA in the second half of 2025.
Fed Powell testimony in focus, but no surprises expected
Fed Chair Jerome Powell’s testimony to Congress, on Tuesday and Wednesday, is the marquee event for markets this week. But investors shouldn’t expect any fireworks. with Fed having just held rates steady at 4.25–4.50% and published updated economic projections last week, markets aren't expecting any major policy revelations. The subsequent Monetary Policy Report released Friday reinforced the central bank’s cautious, data-dependent stance in the face of tariff-related uncertainty.
Powell is likely to reiterate that monetary policy is “in a good place,” and that officials are watching closely to assess the pass-through of tariffs to inflation. Last week, he emphasized that no FOMC member is particularly confident in the current projections, highlighting just how clouded the outlook has become. While markets still expect rate cuts beginning in September, Powell will likely avoid committing to any specific timing.
In the meantime, US data flow will offer more clues on how the economy is absorbing the tariff shock. Durable goods orders, preliminary PMIs, goods trade balance, and consumer confidence are all due this week.
In Europe, hopes of a growth rebound are gaining traction. Analysts have pointed to signs that both Germany and the broader Eurozone could be turning a corner, helped by rising expectations of fiscal support. This week’s Eurozone PMIs and Germany’s Ifo index will either validate that story—or expose it as premature optimism.
Meanwhile, Summary of Opinions from BoJ's June meeting could reveal increasing skepticism among policymakers about delivering another rate hike this year. That would reinforce market expectations that the next tightening move will be pushed into 2026. Elsewhere, inflation data from Australia and Canada will be important for timing rate cuts from RBA and BoC, both of which remain in easing mode.
Here are some highlights for the week:
- Monday: Australia PMIs; Japan PMIs; Eurozone PMIs; UK PMIs; US PMIs, existing home sales.
- Tuesday: Germany Ifo business climate; Canada CPI; US current account, house price index, consumer confidence.
- Wednesday: New Zealand trade balance; BoJ summary of opinions; Australia monthly CPI; Swiss UBS expectations; US new home sales.
- Thursday: Germany Gfk consumer sentiment; US Q1 GDP final, jobless claims, durable goods orders, goods trade balance, pending home sales.
- Friday: Japan Tokyo CPI, retail sales; Canada GDP; US personal income and spending, PCE inflation.
AUD/USD Daily Report
Daily Pivots: (S1) 0.6433; (P) 0.6465; (R1) 0.6481; More...
AUD/USD's downside acceleration today confirms short term topping at 0.6551. Intraday bias is now on the downside for 38.2% retracement of 0.5913 to 0.6551 at 0.6307, even as a correction. Strong bounce from there will keep the fall as a corrective move. However, decisive break of 0.6307 will argue that it's already reversing the rise from 0.5913 and target 61.8% retracement at 0.6157.
In the bigger picture, there is no clear sign that down trend from 0.8006 (2021 high) has completed. Rebound from 0.5913 is seen as a corrective move. While stronger rally cannot be ruled out, outlook will remain bearish as long as 38.2% retracement of 0.8006 to 0.5913 at 0.6713 holds. Nevertheless, considering bullish convergence condition in W MACD, even in case of another fall through 0.5913, downside should be contained above 0.5506 (2020 low).
Fascinating Calm After US Attack on Iran
The week kicked off with a jump in oil prices as the US got involved in Middle East tensions, bombing Iranian nuclear facilities with what they call ‘bunker busters’ – an attempt to destroy underground nuclear infrastructure using powerful bombs that only the US reportedly possesses, if I understand correctly. It’s yet unclear how much damage the US has done – Trump says they’ve caused ‘monumental’ damage. Now, the world is holding its breath to see how Iran will respond.
The country said that ‘all options’ are on the table – including trade disruptions through the Strait of Hormuz, where 20% of global oil and gas flows transit. This could involve blocking the canal or attacking commercial ships, as the Houthis do. Another option could be striking nearby oil facilities, similar to the 2019 attack on Saudi Abqaiq that knocked out 7% of global oil supply.
But many remain optimistic that Iran will avoid a full-blown retaliation and regional chaos, to prevent its own oil facilities from becoming targets and to avoid a widening conflict that could hurt China, its biggest oil customer. So some think – and trade the idea – that the threat of disruption to oil trade will not materialize.
So, US crude opened the week at $78pb, but didn’t climb beyond $78.60 before sliding toward $76pb. Brent didn’t even reach the $78pb mark, while nat gas is up by less than 1% at the time of writing.
So far, satellite images reportedly suggest that oil continues to flow through the Strait, which may explain the muted market reaction to the news. Still, two supertankers – each capable of carrying 2 million barrels of oil – made a U-turn to avoid the region, according to Bloomberg. The Persian Gulf has been increasingly jammed since June 13th, tanker fees are soaring, and the US has issued warnings to the broader region, hinting that more action may be coming.
If things get uglier and Iran retaliates in a way that disrupts global oil and gas flows, the price of US crude could spike above the $100pb level. Top-selling plays on oil price jumps driven by geopolitical headlines look like the major trade of the moment. But holding a short position beyond a few hours is probably too risky. Setting stop-loss and take-profit levels could help limit risks in an increasingly uncertain geopolitical environment.
It’s worth remembering that it would take a few days to a few weeks to meaningfully disrupt global oil flows – and a weakened Iran, if left with no other options, could still go down that road.
A sustainable jump in oil prices – and by sustainable, I mean a rise to around $100pb for a few months – could have wider implications for the global economy by boosting inflation and preventing central banks from further easing. That, in turn, would weigh on production, business activity, and growth.
Therefore, global equities will likely remain under pressure at the open, but judging by how oil prices reacted to the weekend news, the selloff could remain relatively soft compared with the heaviness of the headlines. S&P futures are down about 0.30% – they’re behaving like a normal Monday. And that, I find extremely interesting. It really feels like markets have become increasingly unreactive to the news. The lack of reaction is fascinating.
Beyond oil, the US dollar jumped at the open, but gains remain relatively small. The US 10-year yield is softening, gold is giving back earlier gains, and the Swiss franc is not necessarily stronger – on the contrary. Traders are taking advantage of levels below 1.15 to flock back into the euro. Cable is bid into its 50-DMA. But the Asian majors are under greater pressure: the USDJPY, for example, jumped past its 100-DMA and is trending higher despite the softening in the US dollar after the initial spike. Meanwhile, the AUD/USD, which has decent exposure to China, slipped below its 200-DMA and remains under pressure, even though the broader market is not showing particular signs of stress.
Geopolitical tensions will remain top of the headlines this week. For those interested, there will be a set of PMI releases across Europe and the US today. Federal Reserve (Fed) Chair Jerome Powell will deliver his semi-annual testimony before Congress, and will probably say little more than “we don’t know what will happen amid high trade and geopolitical uncertainty, so the best approach is to wait and see.”
We’ll also watch the fresh US GDP update – expected to point to a solid decline in Q1 sales alongside sustained price pressures. By the end of the week, Japan and major Eurozone economies will release their latest inflation data. The relevance of those inflation prints will depend on the size of oil price movements. For now, they don’t look threatening. But oil prices have jumped more than 20% compared with pre-Iran tensions – and that’s something to keep an eye on.
US Strikes on Iran Escalate Middle East Conflict
In focus today
The conflict between Israel and Iran has now entered its second week. In a major escalation termed "Operation Midnight Hammer", the US joined the battle early Sunday morning, targeting Iran's nuclear ambitions with strikes on key sites: Natanz, Isfahan and Fordo using bunker buster bombs. While US officials claim victory, we await the full impact assessment. In our view, Iran's potential closure of the Strait of Hormuz - pending approval from the National Security Council - is a last option due to its economic reliance on the passage and the risk of provoking a strong US military response. However, if Supreme Leader Ali Khamenei perceives no alternatives, he may resort to this extreme action. For an in-depth analysis, see Research Global - What if Iran closes the Strait of Hormuz?, 22 June.
This week's macro data kicks off with a string of PMI releases: euro area manufacturing PMI has had a strong start of the year rising to 49.4 in May from 45.1 in December, while services has been on a declining trend, falling to 49.7 in May. We expect the manufacturing PMI to remain unchanged as the boost of front-loading of exports to the US has likely reversed while the ZEW rose in June in a more positive sign. We expect services to remain below 50 due to the weak consumer confidence that limits spending. We will also keep an eye on the US flash PMIs.
Key events for the rest of the week include the NATO summit and German IFO on Tuesday, with US PCE data set for release on Friday.
Economic and market news
What happened overnight
In the commodity space, Asian markets slipped as investors watched for Iran's response to US strikes. Oil prices briefly hit five-month highs, settling with a 2.0% rise and trading at USD78.5/barrel this morning. The escalation of the Middle East crisis is expected to lead to the traditional safe heaven effects, with rising oil prices, lower equity pricing and a stronger dollar. However, the impact on US Treasuries remains uncertain due to trade deficits, tariffs, and potential increases in Treasury supply from soft fiscal policy.
What happened since Friday
During the weekend, NATO members agreed to increase their defence spending target to 5% of GDP ahead of the summit, as advocated by US President Trump. Spain, however, announced it would not meet this target, aiming for only 2.1% due to social spending concerns - a stance that may heighten tensions with Trump.
In the euro area, consumer confidence declined in June to -15.3 from -15.2, in contrast to expectations of a rise to -14.9. The weak consumer confidence is a drag on activity and dampens growth especially in the services sector. However, a strong labour market, rising real wages and lower rates are helping consumption, which is growing. But consumption growth had been higher if it was not for the weak confidence.
In Denmark, consumer confidence increased from -18.4 to -15.1 in June, reaching its highest level since February, yet still low. This rise is driven by improved perceptions of the Danish economy amid easing international tensions. Despite positive indicators like job growth, consumers remain cautious about personal finances due to inflation fears. Crucially, consumer spending has not sharply declined, supporting domestic growth. April's payroll data revealed a strong increase of 5,400 employees, led by the private sector, despite ongoing tariff uncertainties.
Equities: Despite a barrage of geopolitical developments and a packed calendar of macroeconomic and monetary policy news last week, it is striking how little movement we saw across major asset classes. Yes, equities ended the week marginally lower overall, but the broad picture is one of stability. Cyclical sectors even slightly outperformed, volatility ticked up only marginally, and bond yields moved slightly lower - hardly the kind of response we would expect in such an environment. In the US on Friday, Dow +0.1%, S&P 500 -0.2%, Nasdaq -0.5% and Russell 2000 -0.2%.
FI and FX: Geopolitical tensions escalated over the weekend as the US conducted targeted strikes on three Iranian nuclear sites, which means that the US has now effectively joined Israel in its war in Iran. As a result, the oil price touched the USD80/bbl level as the market opened and traditional safe havens such as the USD and CHF have benefitted while US and European equity futures are trading lower. Key will be whether Iran resorts to closing the Strait of Hormuz from traffic, which would be a big shock the global economy and likely lead to a surge in energy prices and a sharp sell-off in risky assets.