Sample Category Title
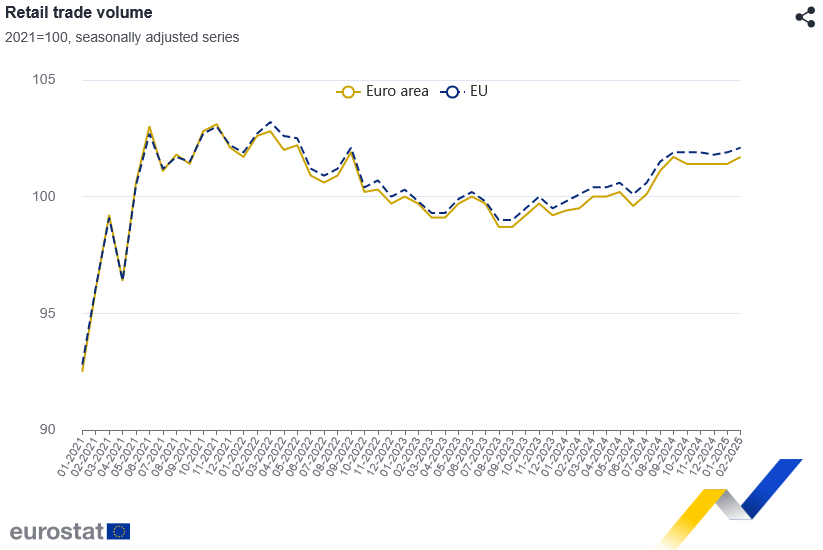
Eurozone retail sales rise 0.3% mom in Feb, EU up 0.2% mom
Eurozone retail sales volumes rose by 0.3% mom in February, falling short of the expected 0.5% mom increase. The breakdown showed modest improvements across key segments: food, drinks, and tobacco sales were up 0.3% mom; non-food products excluding automotive fuel also rose 0.3% mom; while automotive fuel sales edged up 0.2% mom.
Retail sales across the broader EU climbed just 0.2% mom, with notable divergence among member states. Cyprus led with a 4.7% gain, followed by Estonia (+2.2%) and Lithuania (+1.7%). Meanwhile, retail trade volumes declined in Bulgaria (-1.7%), the Netherlands (-1.4%), and Poland (-1.2%).
NZD/USD Analysis: Exchange Rate Nears 2025 Low
Less than a month ago, we analysed the NZD/USD chart and:
→ highlighted the key resistance level at 0.5800;
→ outlined a potential scenario involving a decline from that zone.
Now, the NZD/USD pair is trading close to its lowest level of 2025, recorded on 3 February near 0.5525. The latest surge in volatility appears to be driven by President Trump’s widely discussed decision to impose substantial tariffs on trade with multiple countries.
For context, the Australian dollar has fallen to a five-year low amid concerns that retaliatory trade measures could trigger a global recession. The New Zealand dollar, however, has remained somewhat more stable — possibly because traders are anticipating Wednesday’s Reserve Bank of New Zealand (RBNZ) meeting, where the central bank may signal efforts to stabilise the currency. According to Forex Factory, a rate cut from 3.75% to 3.50% is expected.
Technical analysis of NZD/USD chart
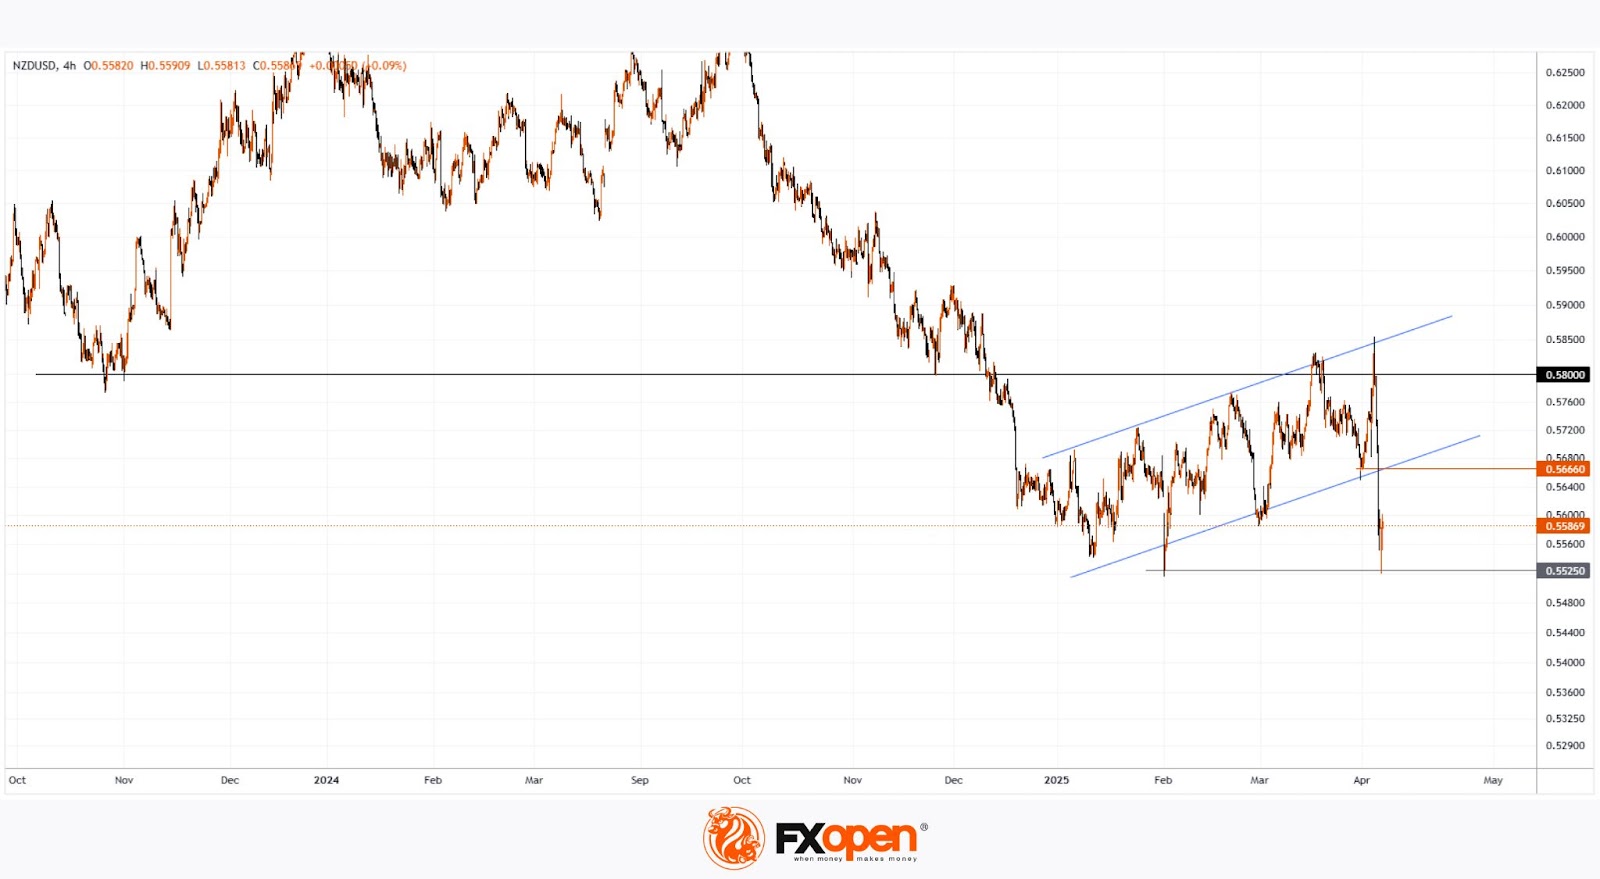
Price movements in 2025 have formed an ascending channel (marked in blue), but bears broke through the lower boundary late last week near the 0.5666 level.
This suggests that even if NZD/USD sees a short-term rebound, it may face resistance around that same level — a classic “break-and-retest” pattern often watched by traders.
Trade over 50 forex markets 24 hours a day with FXOpen. Take advantage of low commissions, deep liquidity, and spreads from 0.0 pips. Open your FXOpen account now or learn more about trading forex with FXOpen.
This article represents the opinion of the Companies operating under the FXOpen brand only. It is not to be construed as an offer, solicitation, or recommendation with respect to products and services provided by the Companies operating under the FXOpen brand, nor is it to be considered financial advice.
Nasdaq 100 Drops to Lowest Level Since January 2024
According to the chart of the Nasdaq 100 (US Tech 100 mini on FXOpen), the index opened this week around the 16,500 mark – a price level last seen in early 2024.
This suggests that the sharp sell-off in equities seen last Thursday and Friday may well continue today.
Stock indices respond to Trump’s tariffs
Treasury Secretary Scott Bessent said on NBC News’ Meet the Press that there is “no reason” to expect a recession.
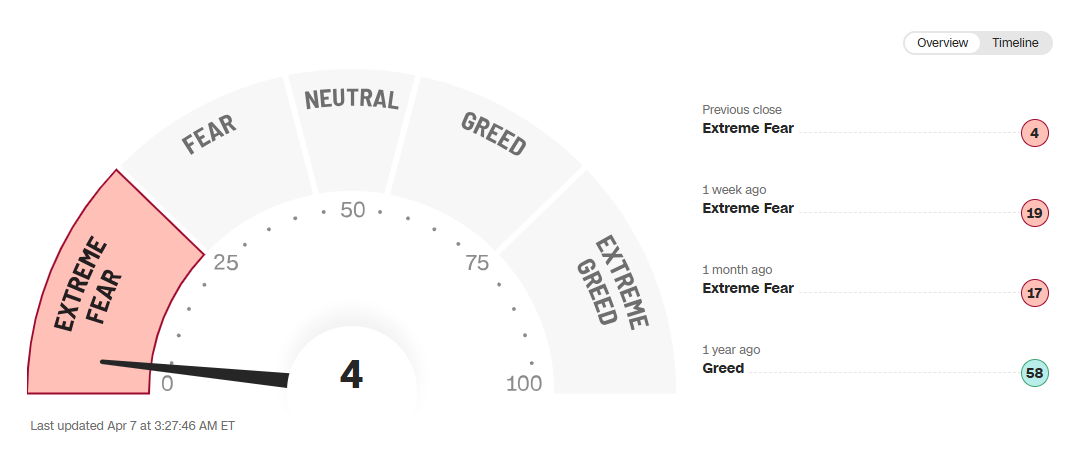
However, equity charts reflect market sentiment described by CNN Business’s Fear & Greed Index as “extreme fear”. This wave of negativity followed President Trump’s announcement on 2 April of harsher-than-expected international trade tariffs. In response, China and other nations announced retaliatory measures.
As a result, the Nasdaq 100 (US Tech 100 mini on FXOpen) now trades roughly 25% below its 2025 peak – officially entering bear market territory.
Technical analysis of the Nasdaq 100 (US Tech 100 mini on FXOpen)
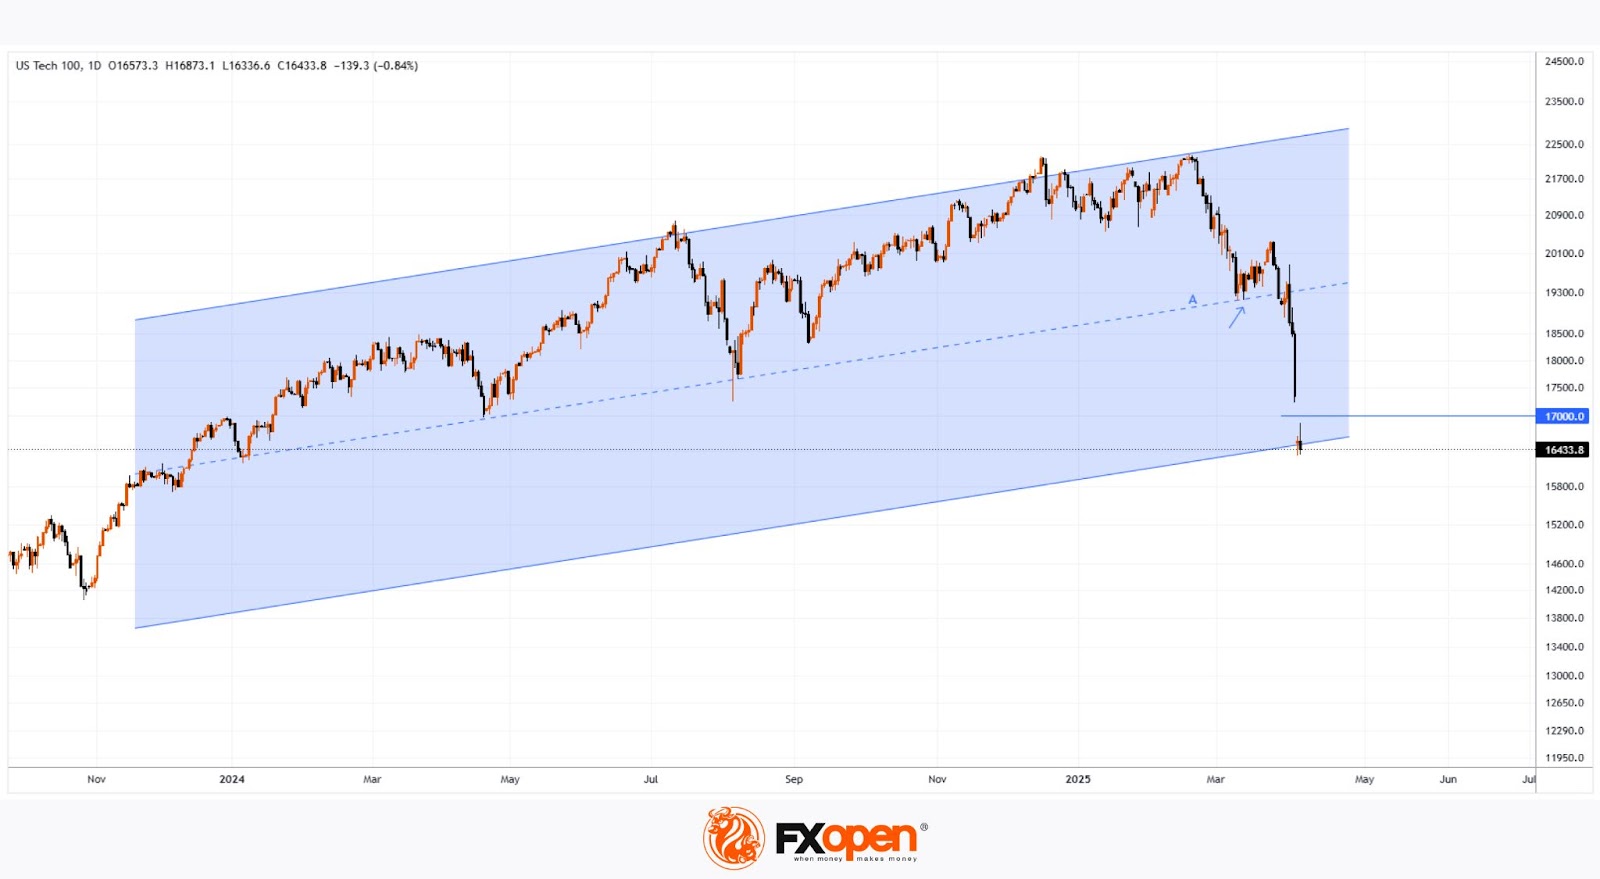
Back on 28 February, we drew an ascending trendline (line A). Bulls attempted a rebound from this support (as shown by the arrow), but their efforts were overwhelmed by the White House’s latest policy decisions.
Given the updated price action, we can now treat line A as the median of an ascending channel. From this perspective, the index is currently near the lower boundary of the channel.
Technically, this could indicate potential support. However, as long as the price remains below the bearish gap – which includes the key psychological level of 17,000 – talk of a meaningful recovery may be premature.
Trade global index CFDs with zero commission and tight spreads. Open your FXOpen account now or learn more about trading index CFDs with FXOpen.
This article represents the opinion of the Companies operating under the FXOpen brand only. It is not to be construed as an offer, solicitation, or recommendation with respect to products and services provided by the Companies operating under the FXOpen brand, nor is it to be considered financial advice.
Eurozone Sentix falls to -19.5, expectations collapse to -15.8 on trade war
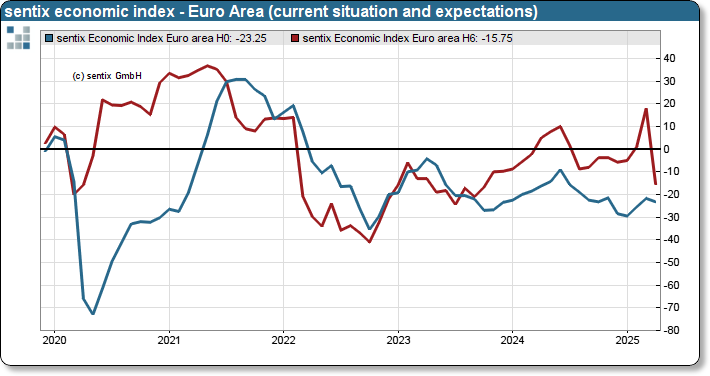
Investor sentiment in the Eurozone suffered a dramatic collapse in April, as the Sentix Investor Confidence Index plunged from -2.9 to -19.5, far below expectations of -8.7 and marking the lowest reading since October 2023. Current Situation Index dipped slightly from -21.7 to -23.3.
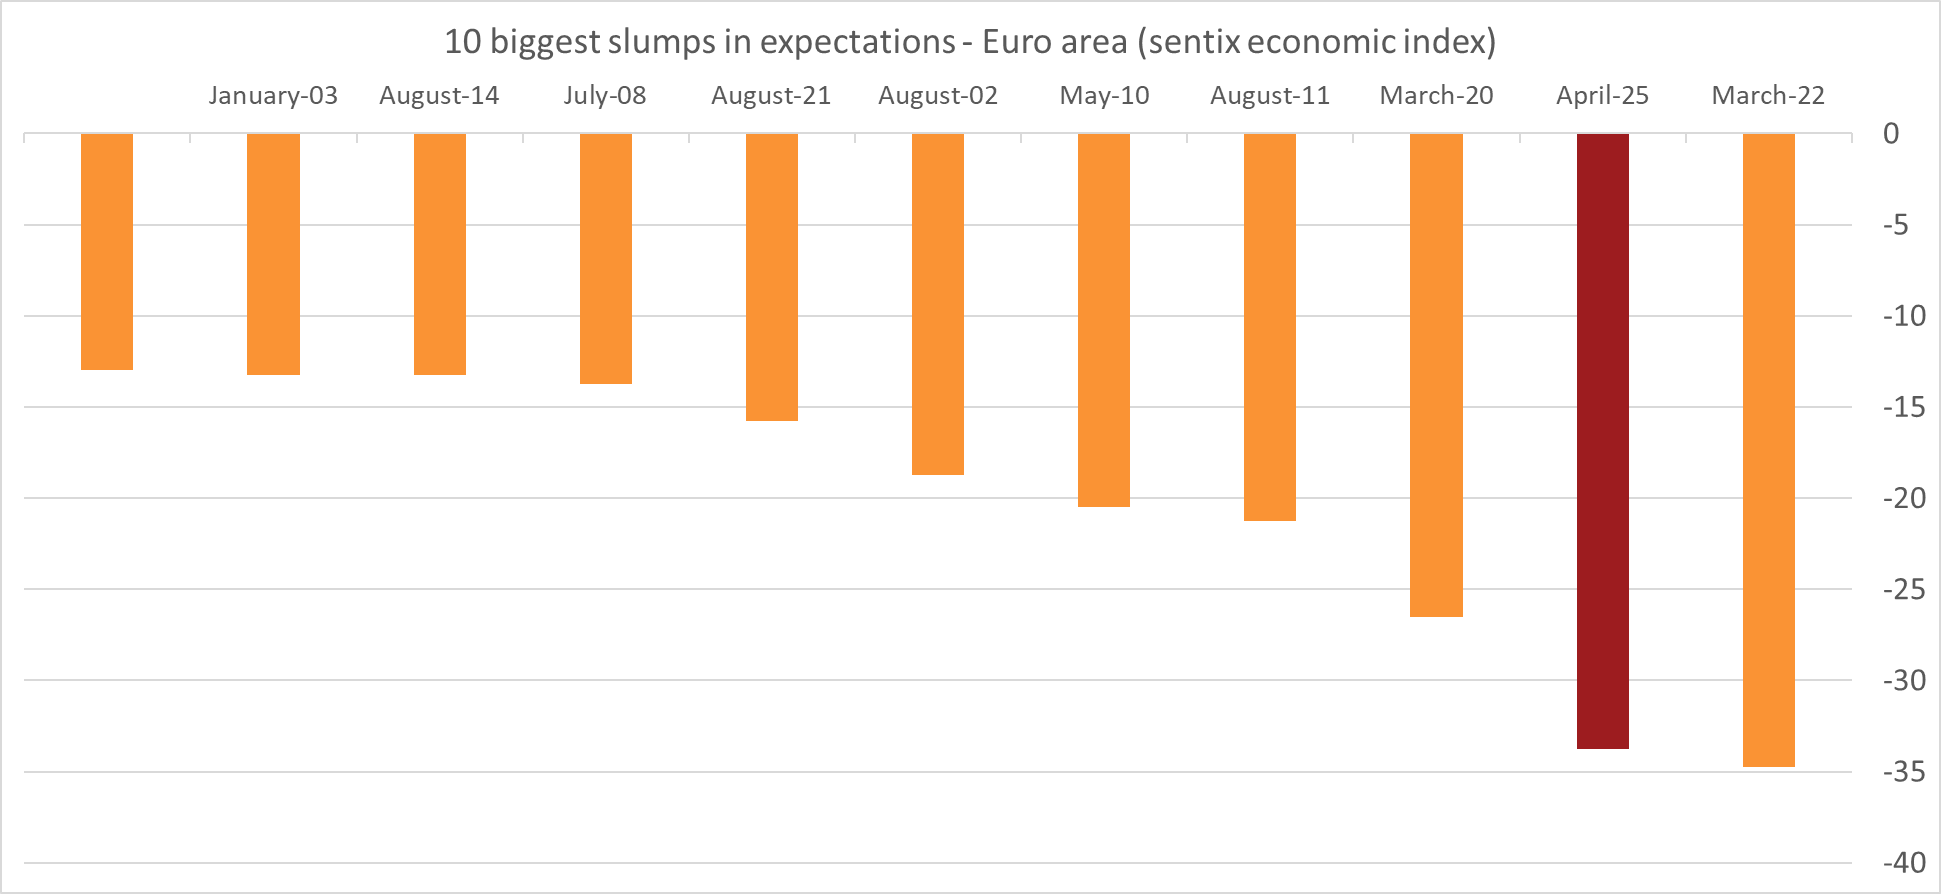
The sharpest shock came from the Expectations Index, which nosedived from 18.0 to -15.8—its lowest level in 18 months and a staggering drop of -33.8 points, the second steepest fall ever recorded in Sentix history.
Sentix directly attributed the deterioration to US President Donald Trump’s sweeping new tariff measures, stating that last month’s optimism across Germany and the broader EU had “evaporated.”
The group warned that the early indicators point to a “massive problem,” with global economic stability seriously threatened. With Trump showing no signs of reversing course, Sentix cautioned that the tariff war is likely to “drag on longer than many assume,” fueling deeper disruptions.
ECB’s Stournaras: US Tariffs definitely deflationary, growth hit could reach 1%
Greek ECB Governing Council member Yannis Stournaras warned that the US reciprocal tariffs were “worse than expected” and a source of “unprecedented” global policy uncertainty.
In an interview with the Financial Times, he characterized the tariffs as “definitely a deflationary measure” for the Eurozone.
"A notable adverse impact on growth could lead to activity being much weaker than expected, dragging inflation below our targets," he added.
While conceding it’s difficult to quantify the exact fallout, Stournaras projected a potential hit of between 0.5 to 1 percentage points to Eurozone growth.
He refrained from speculating on whether the threat justifies a 50bps rate cut but underscored the seriousness of the downside risks.
GBP/JPY Daily Outlook
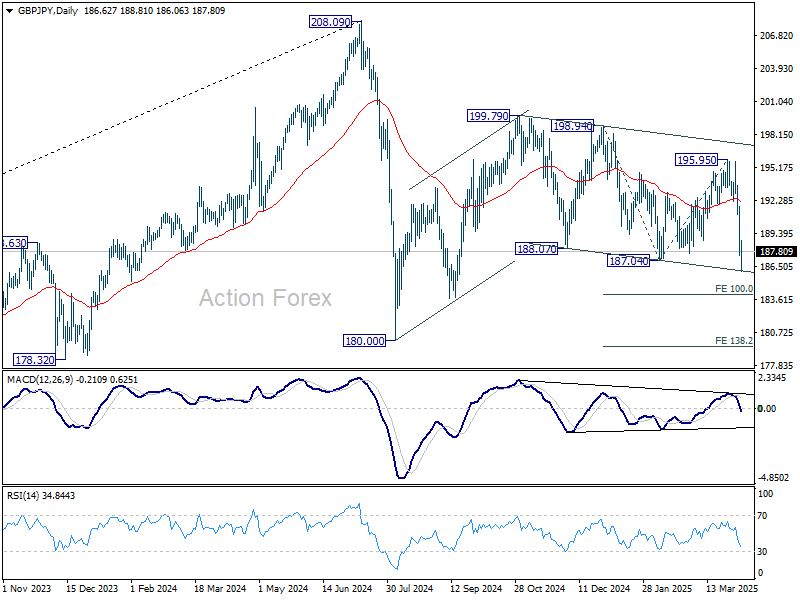
Daily Pivots: (S1) 187.60; (P) 189.68; (R1) 191.82; More...
Intraday bias in GBP/JPY remains on the downside for the moment. Break of 187.04 support indicates decline from 199.79 is resuming. Next target is 100% projection of 198.94 to 187.04 from 195.95 at 184.05. On the upside, above 190.27 minor resistance will turn intraday bias neutral first.
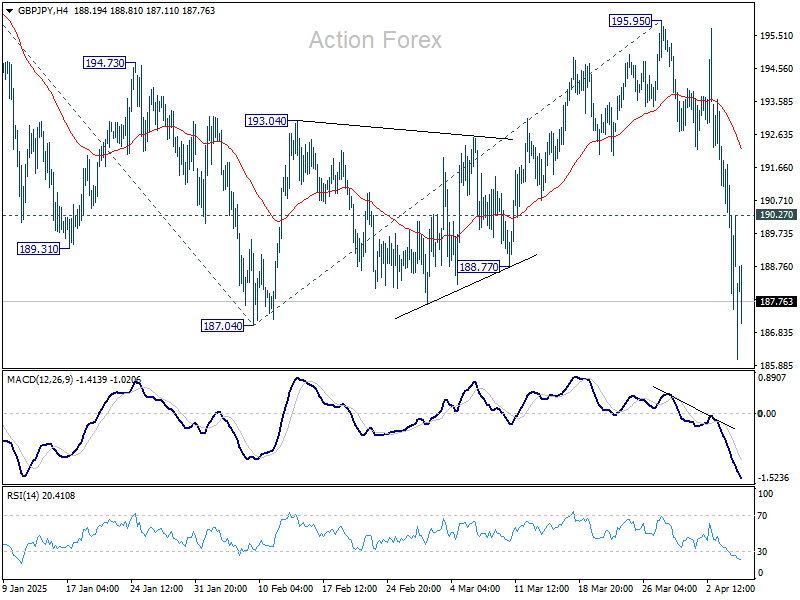
In the bigger picture, price actions from 208.09 are seen as a correction to rally from 123.94 (2020 low). Strong support should be seen from 38.2% retracement of 123.94 to 208.09 at 175.94 to contain downside. However, sustained break of 152.11 will bring deeper fall even still as a correction.
EUR/JPY Daily Outlook
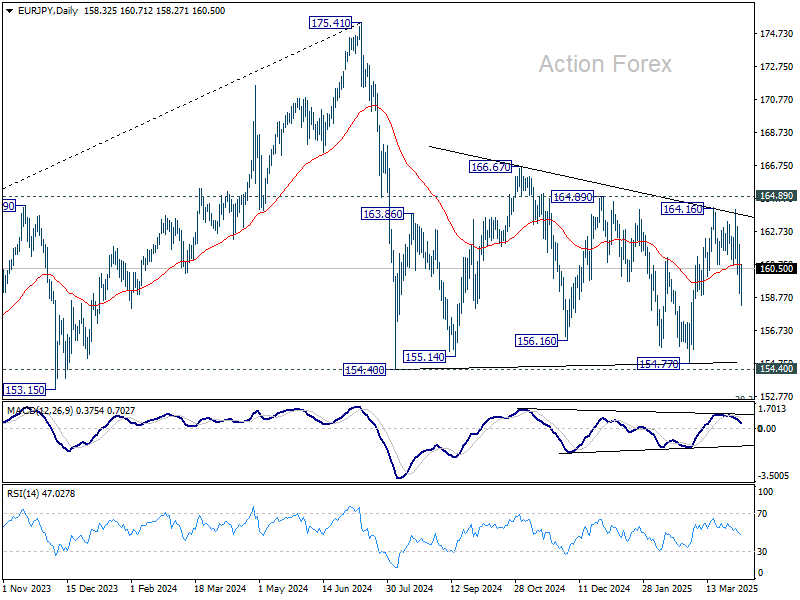
Daily Pivots: (S1) 159.49; (P) 160.75; (R1) 162.47; More...
EUR/JPY dipped below 158.87 support briefly but quickly recovered. Intraday bias stays neutral first. On the upside, above 164.16 will resume the rally from 154.77 to 164.89 resistance, and then 166.67. However, decisive break of 158.87 support will bring deeper decline back to 154.77 support. Overall, sideway consolidation pattern from 154.40 is still extending.
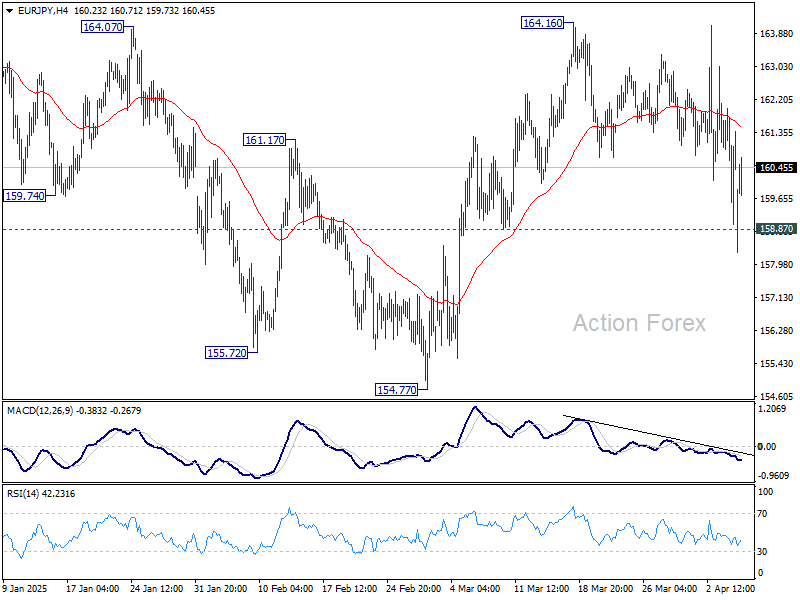
In the bigger picture, price actions from 175.41 are seen as correction to rally from 114.42 (2020 low). Strong support should be seen from 38.2% retracement of 114.42 to 175.41 at 152.11 to contain downside. However, sustained break of 152.11 will bring deeper fall even still as a correction.
EUR/GBP Daily Outlook
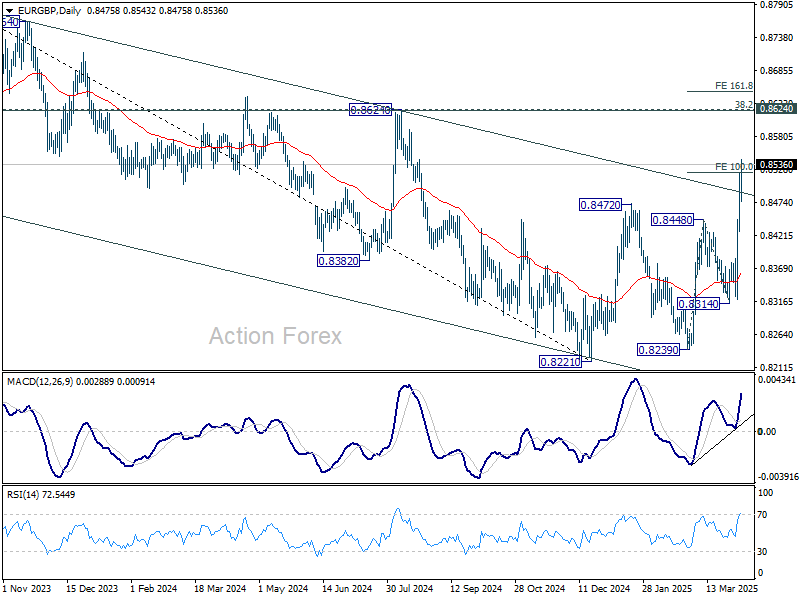
Daily Pivots: (S1) 0.8445; (P) 0.8484; (R1) 0.8539; More...
EUR/GBP's rally continues today and breaks through 100% projection of 0.8239 to 0.8448 from 0.8314 at 0.8523. Intraday bias stays on the upside for 0.8624 key cluster resistance next. On the downside, below 0.8475 minor support will turn intraday bias neutral and bring consolidations first.
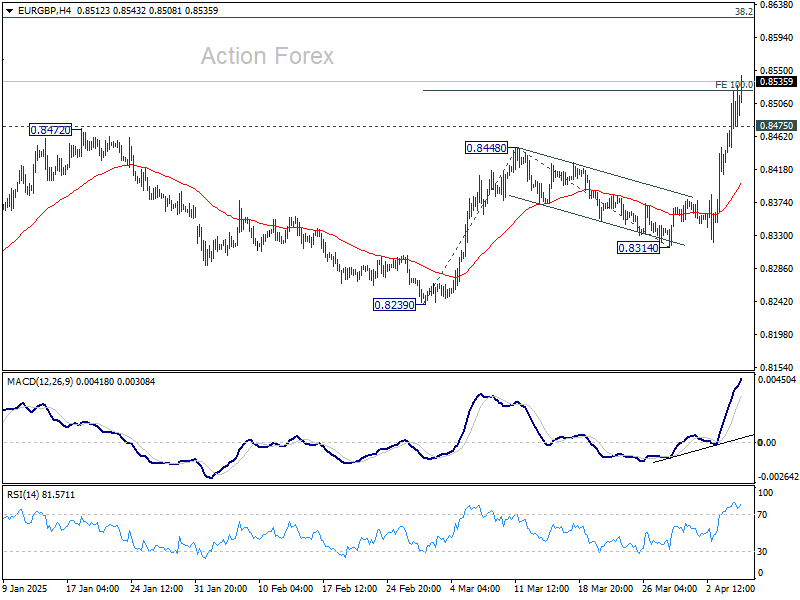
In the bigger picture, the break of medium term channel resistance is a bullish signal. Down trend from 0.9267 (2022 high) could have completed at 0.8221, just ahead of 0.9201 key support (2022 low). Firm break of 0.8624 cluster resistance (38.2% retracement of 0.9267 to 0.8221 at 0.8621) will confirm this bullish case and target 61.8% retracement at 0.8867 next. Nevertheless, rejection by 0.8624 will keep medium term outlook neutral at best.
EUR/AUD Daily Outlook
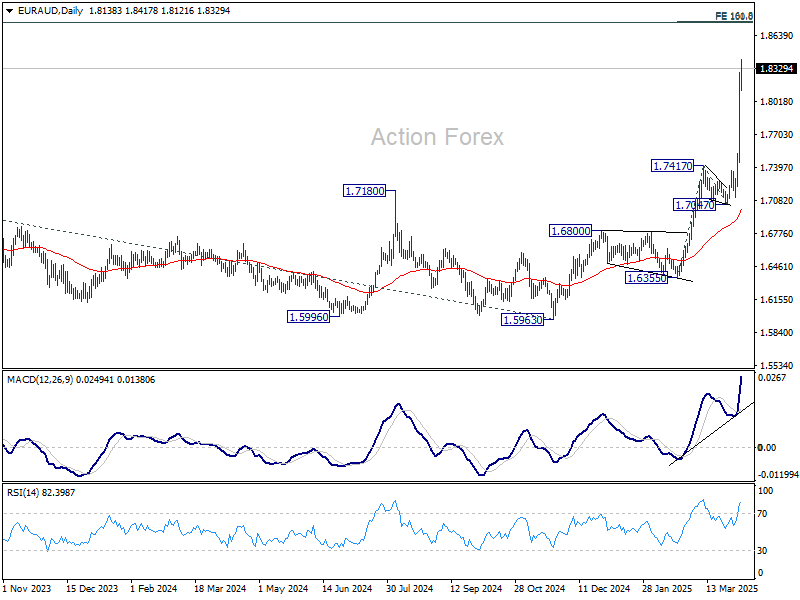
Daily Pivots: (S1) 1.7633; (P) 1.7963; (R1) 1.8482; More...
Intraday bias EUR/AUD stay on the upside for the moment. Current up trend should target 161.8% projection of 1.6355 to 1.7417 from 1.7047 at 1.8765 next. On the downside, below 1.7965 minor support will turn bias neutral and bring consolidations first, before staging another rally.
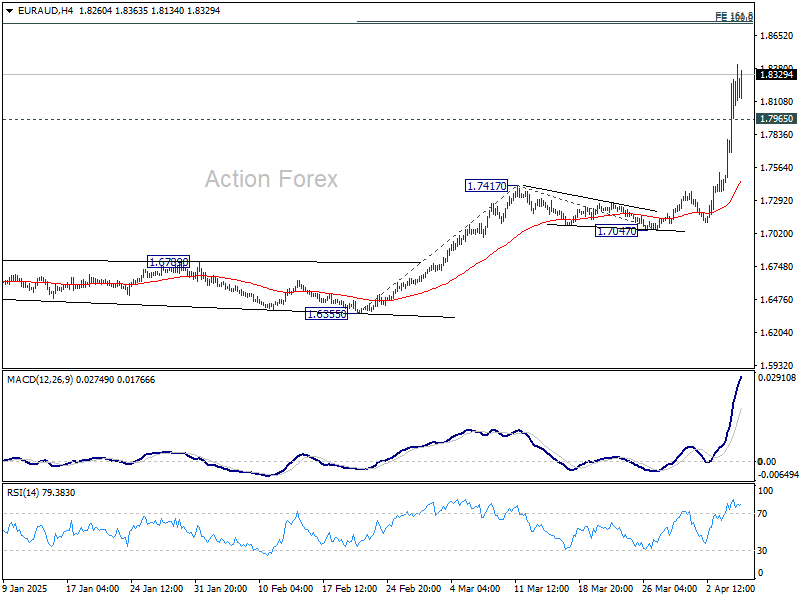
In the bigger picture, up trend from 1.4281 (2022 low) is in progress, and in reacceleration phase as seen in W MACD. Next target is 100% projection of 1.4281 to 1.7062 from 1.5963 at 1.8744. Outlook will remain bullish as long as 1.7062 resistance turned support holds (2023 high) even in case of deep pullback.
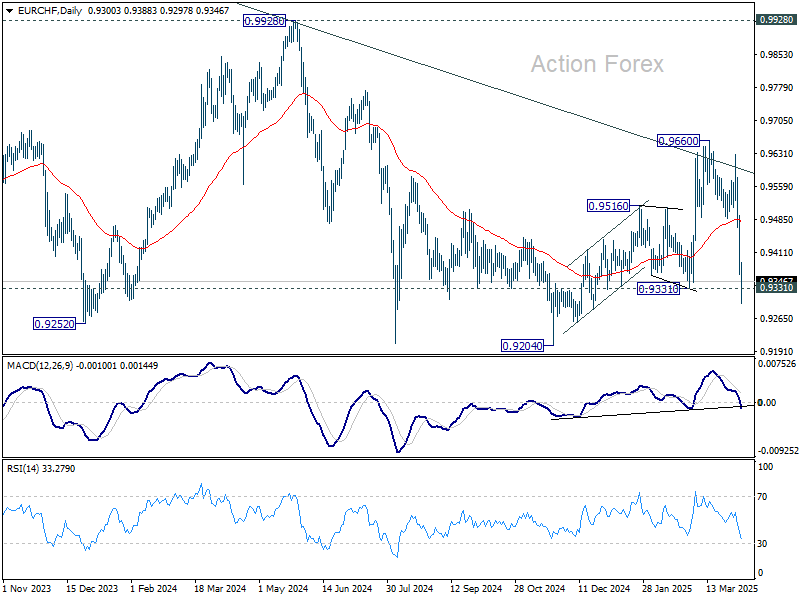
EUR/CHF Daily Outlook
Daily Pivots: (S1) 0.9362; (P) 0.9434; (R1) 0.9505; More....
Intraday bias in EUR/CHF remains on the downside at this point. Decisive break of 0.9331 structural support indicate that whole rally from 0.9204 has completed as a three-wave correction at 0.9660, after rejection by channel resistance. Deeper decline would be seen to retest 0.9204 low next. On the upside, above 0.9443 minor resistance will turn intraday bias neutral first.
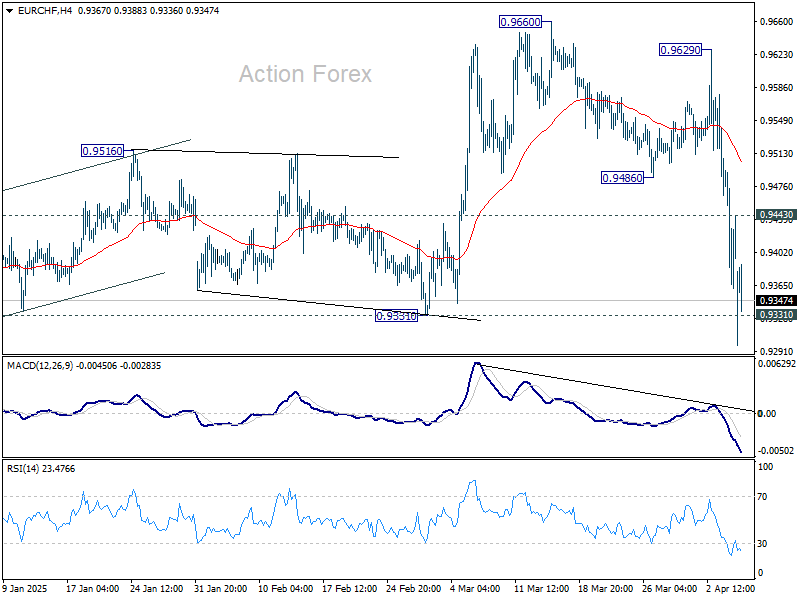
In the bigger picture, rejection by long-term falling channel resistance (now at 0.9600) will retain medium term bearishness. That is, down trend from 1.2004 (2018 high) is still in progress. Downside breakout through 0.9204 low would then be in favor at a later stage.