Sample Category Title
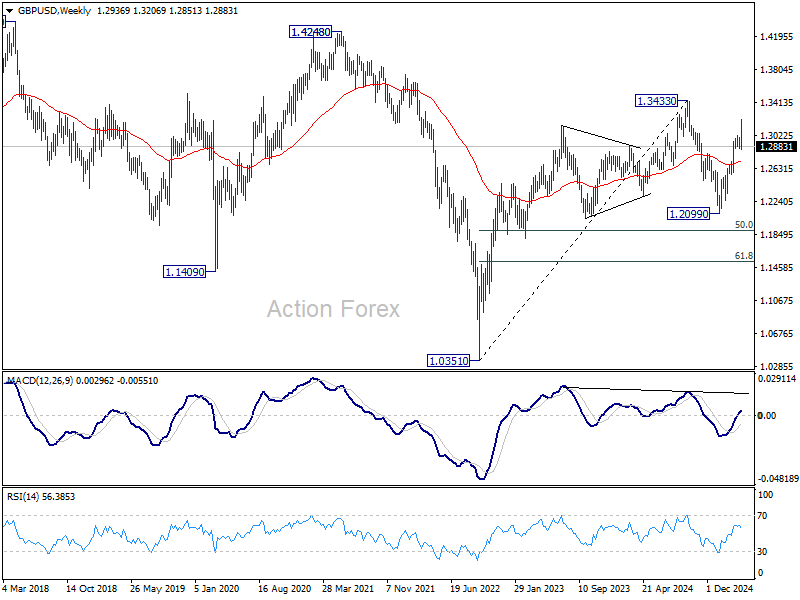
GBP/USD Weekly Outlook
GBP/USD spiked higher to 1.3206 last week but subsequent reversal indicates that a short term top was formed. Initial bias is on the downside this week for 38.2% retracement of 1.2099 to 1.3206 at 1.2783. Decisive break there will target 61.8% retracement at 1.2522. On the upside, above 1.2961 minor resistance will turn intraday bias neutral first.
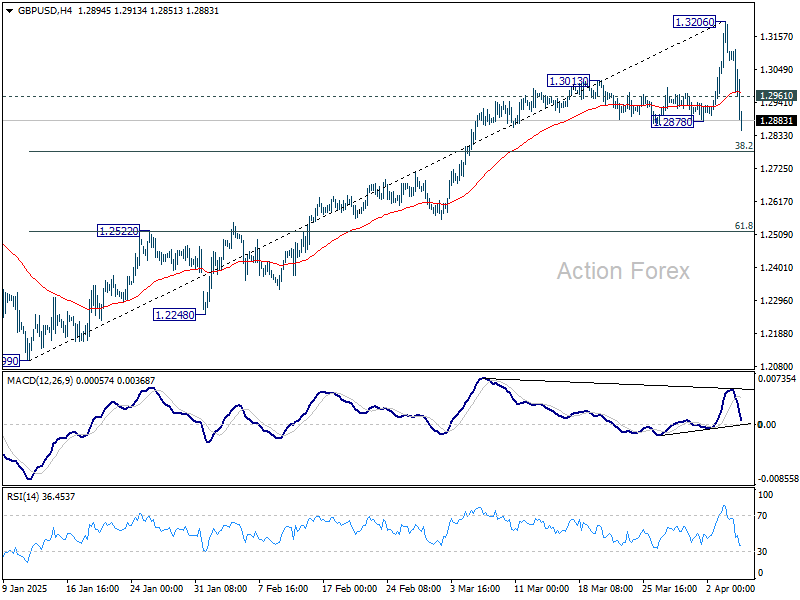
In the bigger picture, price actions from 1.3433 are seen as a corrective pattern to the up trend from 1.3051 (2022 low). Rise from 1.2099 could be the second leg. Overall, GBP/USD should target 1.4248 key resistance (2021 high) on break of 1.3433 at a later stage.
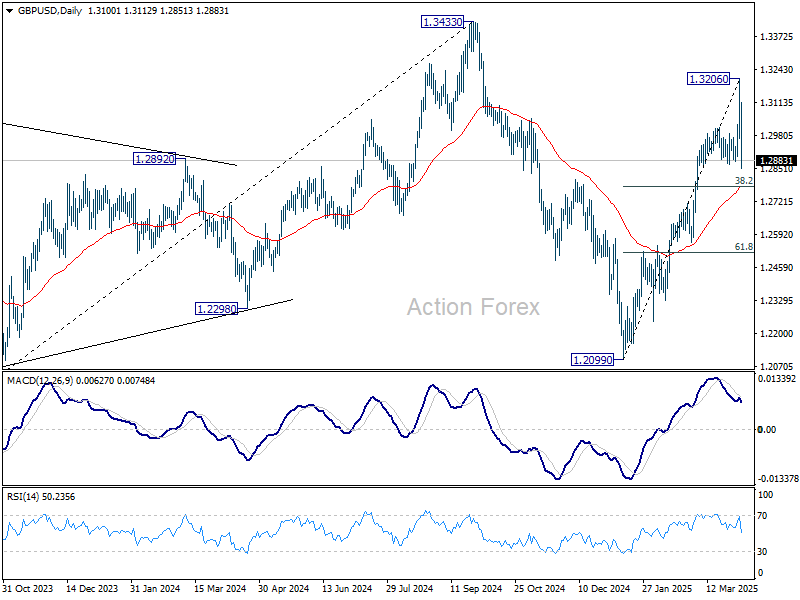
In the long term picture, price actions from 1.0351 (2022 low) are seen as a corrective pattern to the long term down trend from 2.1161 (2007 high) only. Outlook will be neutral at best as long as 1.4248 structural resistance holds, even in case of strong rebound.
USD/CHF Weekly Outlook
USD/CHF's fall from 0.9196 resumed last week and accelerated to as low as 0.8475. But a temporary was formed with subsequent recovery. Initial bias is turned neutral this week for consolidations first. Recovery should be limited by 0.8757 support turned resistance. Below 0.8475 will target 100% projection of 0.9196 to 0.8757 from 0.8854 at 0.8415.
In the bigger picture, rejection by 0.9223 key resistance keep medium term outlook bearish. That is, larger fall from 1.0342 (2017 high) is not completed yet. Firm break of 0.8332 (2023 low) will confirm down trend resumption. Next target is 61.8% projection of 1.0146 (2022 high) to 0.8332 from 0.9196 at 0.8075.
In the long term picture, price action from 0.7065 (2011 low ) are seen as a corrective pattern to the multi-decade down trend from 1.8305 (2000 high). Fall from 1.0342 (2016 high) is seen as the second leg. Firm break of 61.8% retracement of 0.7065 to 1.0342 at 0.8317, will pave the way back to 0.7065.
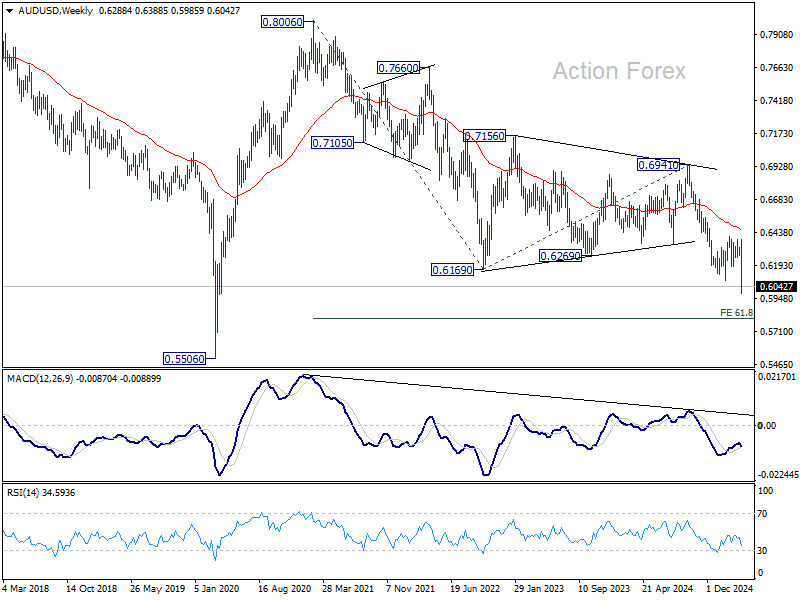
AUD/USD Weekly Report
AUD/USD's steep decline and break of 0.6087 support confirms that whole fall from 0.6941 has resumed. Initial bias stays on the downside this week for 61.8% projection of 0.6941 to 0.6087 from 0.6388 at 0.5860. On the upside, above 0.6138 minor resistance will turn intraday bias neutral and bring consolidations first.
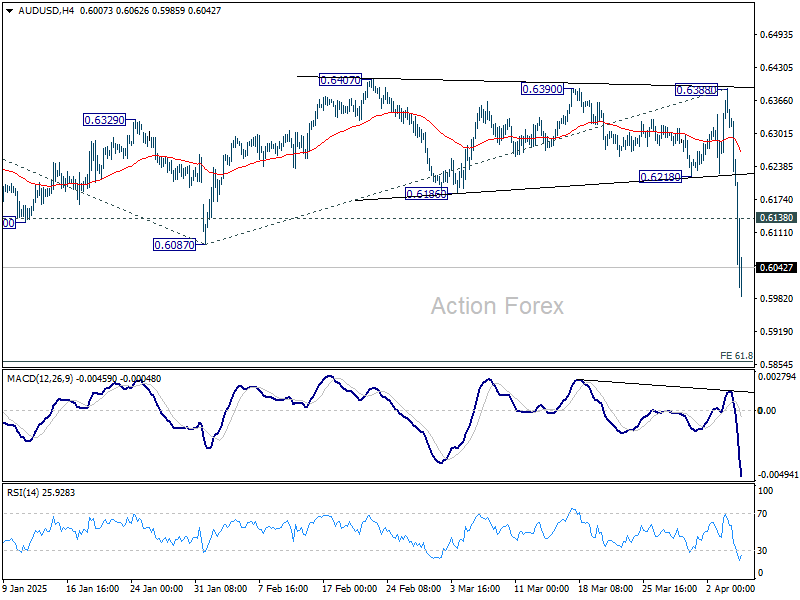
In the bigger picture, fall from 0.6941 (2024 high) is seen as part of the down trend from 0.8006 (2021 high). Next medium term target is 61.8% projection of 0.8006 to 0.6169 from 0.6941 at 0.5806. In any case, outlook will stay bearish as long as 0.6388 resistance holds.
In the long term picture, prior rejection by 55 M EMA (now at 0.6755) is taken as a bearish signal. But for now, fall from 0.8006 is still seen as the second leg of the corrective pattern from 0.5506 long term bottom (2020 low). Hence, in case of deeper decline, strong support should emerge above 0.5506 to contain downside to bring reversal. However, this view is subject to adjustment if current decline accelerates further.
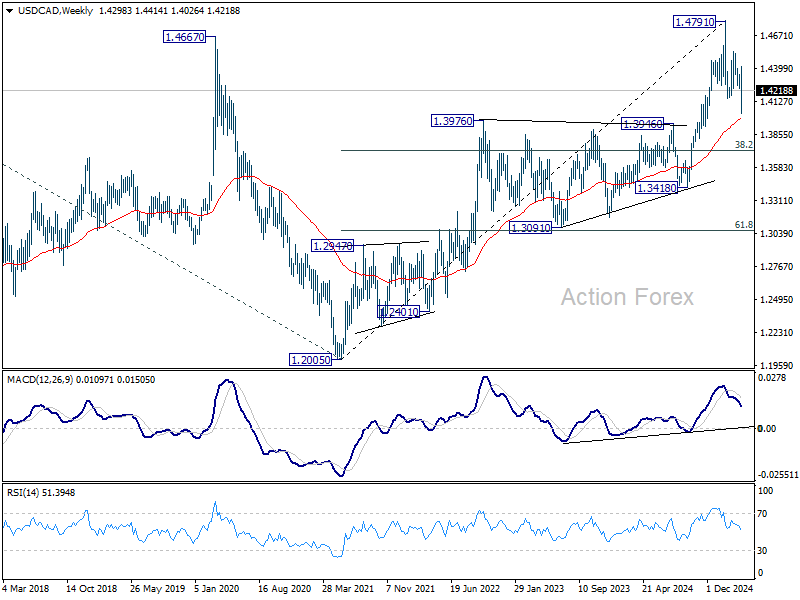
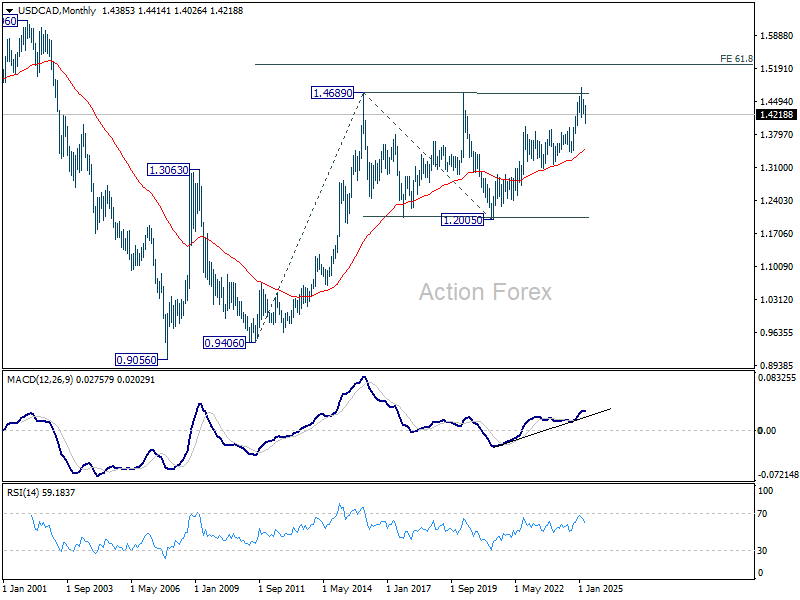
USD/CAD Weekly Outlook
USD/CAD's fall from 1.4791 resumed last week and hit as low as 1.4026. But it then recovered notably, ahead of 1.3946/76 support zone. Initial bias remains neutral this week first. On the upside, break of 1.4414 resistance will suggest that the decline has completed as a three wave correction, and turn bias back to the upside for retesting 1.4791 high. However, firm break of 61.8% projection of 1.4791 to 1.4150 from 1.4414 at 1.4018, could prompt downside acceleration to 100% projection at 1.3773 next.
In the bigger picture, focus is now on 1.3976 resistance turned support (2022 high), which is close to 55 W EMA (now at 1.3992). Strong rebound from there will retain medium term bullishness. That is, up trend from 1.2005 is still in progress for breaking through 1.4791 at a later stage. However, sustained break there should confirm medium term topping at 1.4791. Deeper correction would be seen to 38.2% retracement of 1.2005 (2021 low) to 1.4791 at 1.3727.
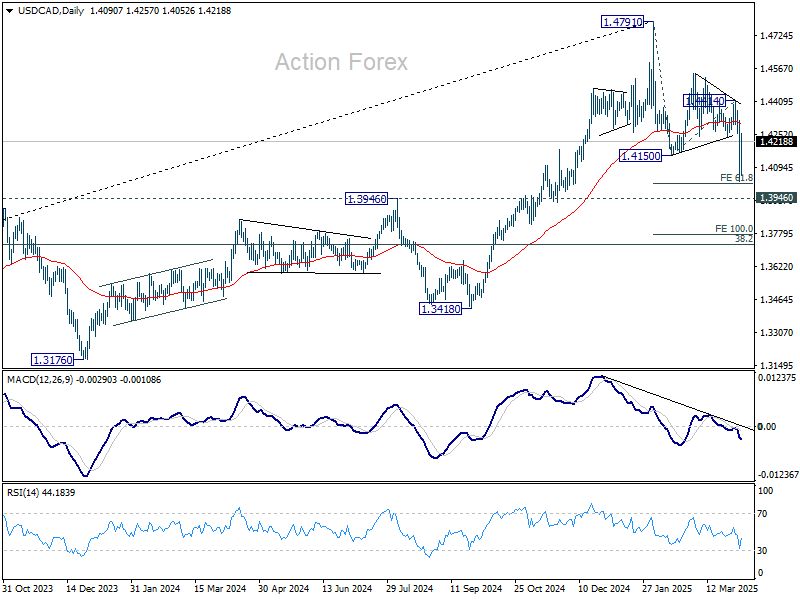
In the longer term picture, up trend from 0.9506 (2007 low) is in progress and possibly resuming. Next target is 61.8% projections of 0.9406 to 1.4689 from 1.2005 at 1.5270. While rejection by 1.4689 will delay the bullish case, further rally will remain in favor as long as 55 M EMA (1.3491) holds.
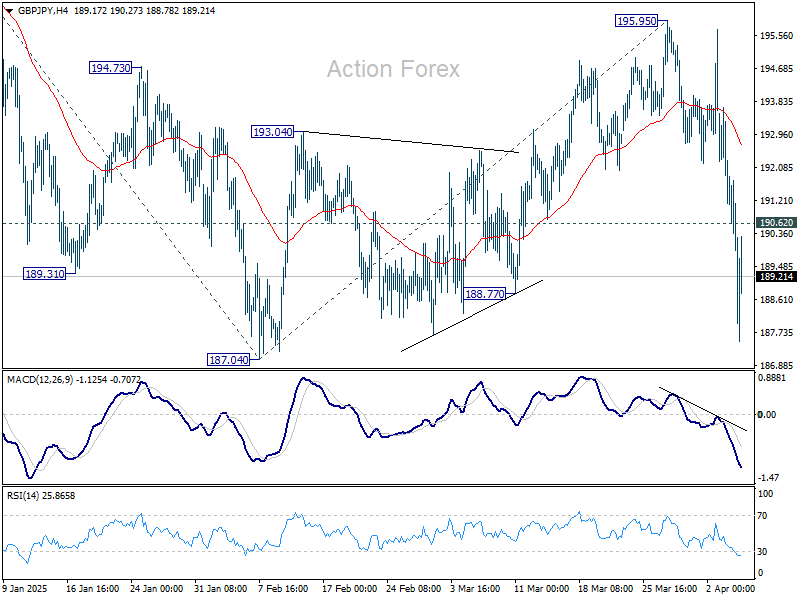
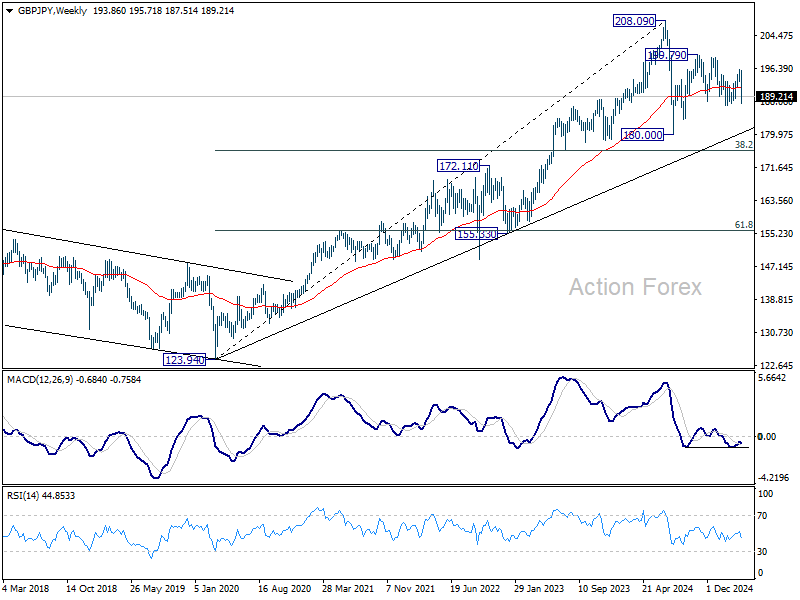
GBP/JPY Weekly Outlook
GBP/JPY's steep decline last week indicates that rebound from 187.04 has completed with three waves up to 195.95. Initial bias stays on the downside this week. Break of 187.04 will resume the whole fall from 199.79. Next target is 100% projection of 198.94 to 187.04 from 195.95 at 184.05. On the upside, above 190.62 minor resistance will turn intraday bias neutral first.
In the bigger picture, price actions from 208.09 are seen as a correction to rally from 123.94 (2020 low). Strong support should be seen from 38.2% retracement of 123.94 to 208.09 at 175.94 to contain downside. However, sustained break of 152.11 will bring deeper fall even still as a correction.
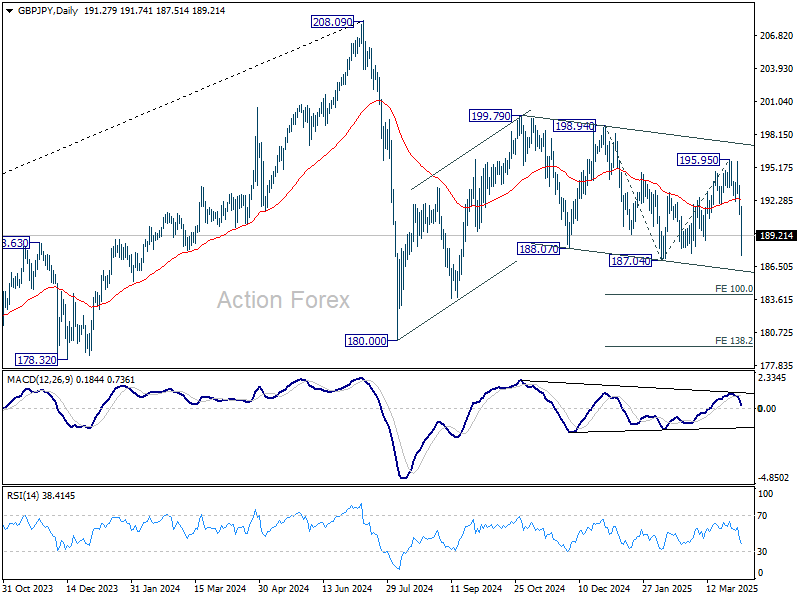
In the longer term picture, while a medium term top was formed at 208.09 (2024 high), it's still early to conclude that the up trend from 122.75 (2016 low) has completed. But GBP/JPY is at least in a medium term corrective phase, with risk of correction to 55 M EMA (now at 174.68).
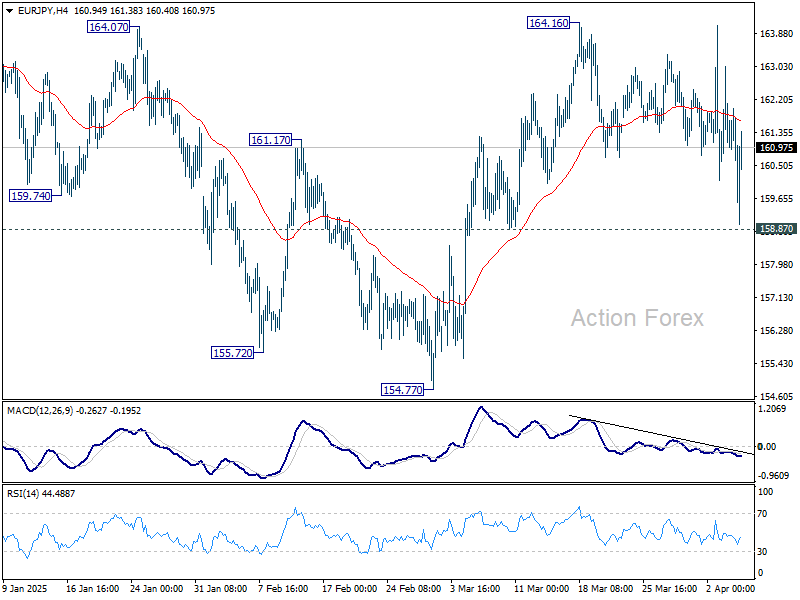
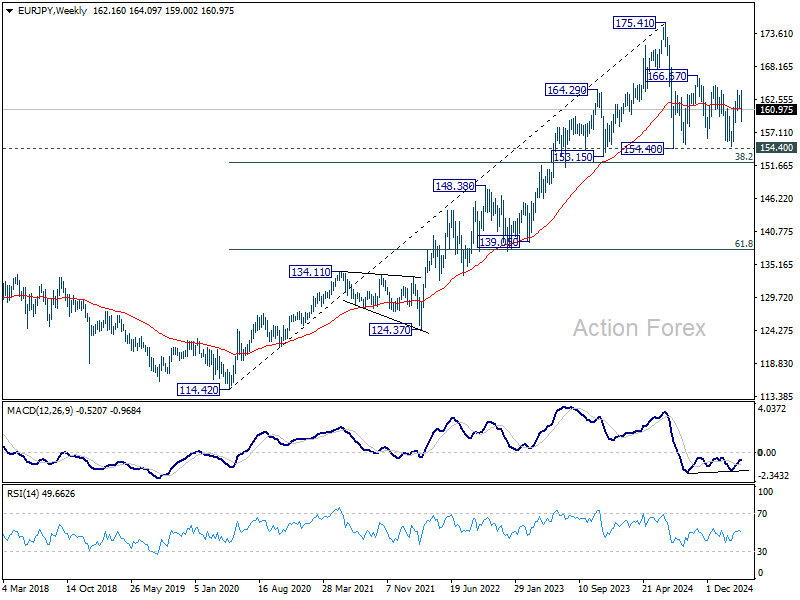
EUR/JPY Weekly Outlook
EUR/JPY dipped notably last week but recovered ahead of 158.87 support. Initial bias remains neutral this week first. On the upside, above 164.16 will resume the rally from 154.77 to 164.89 resistance, and then 166.67. However, break of 158.87 support will bring deeper decline back to 154.77 support. Overall, sideway consolidation pattern from 154.40 is still extending.
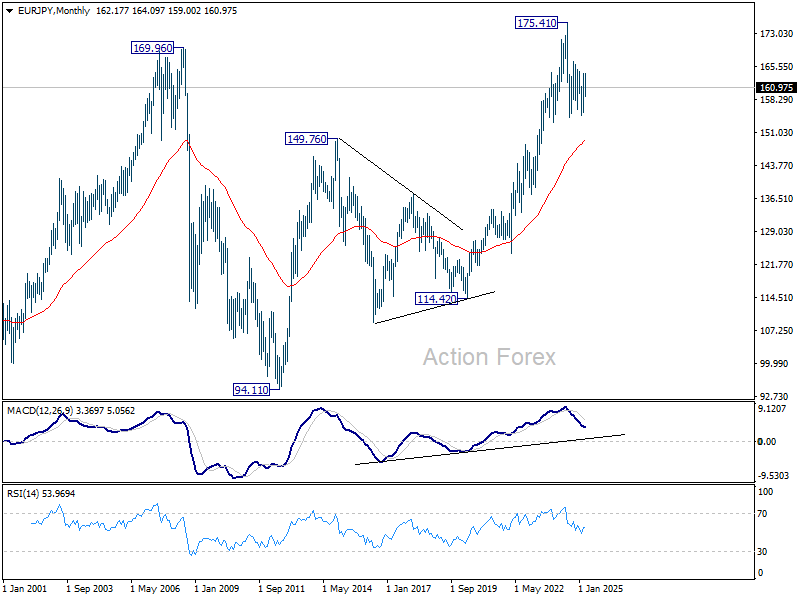
In the bigger picture, price actions from 175.41 are seen as correction to rally from 114.42 (2020 low). Strong support should be seen from 38.2% retracement of 114.42 to 175.41 at 152.11 to contain downside. However, sustained break of 152.11 will bring deeper fall even still as a correction.
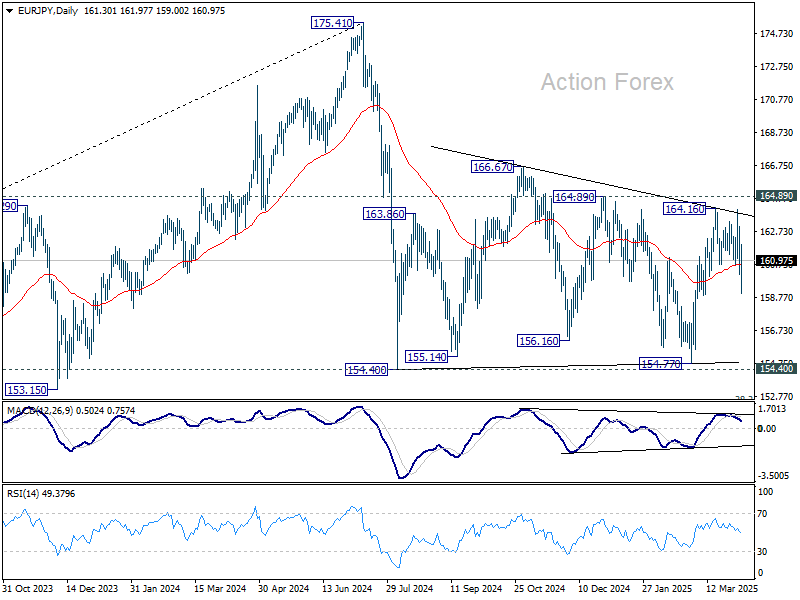
In the long term picture, while 175.41 is at least a medium term top, it's still early to conclude that up trend from 94.11 (2012 low) has completed. A medium term corrective phase is in progress with risk of deeper fall back to 55 M EMA (now at 148.94).
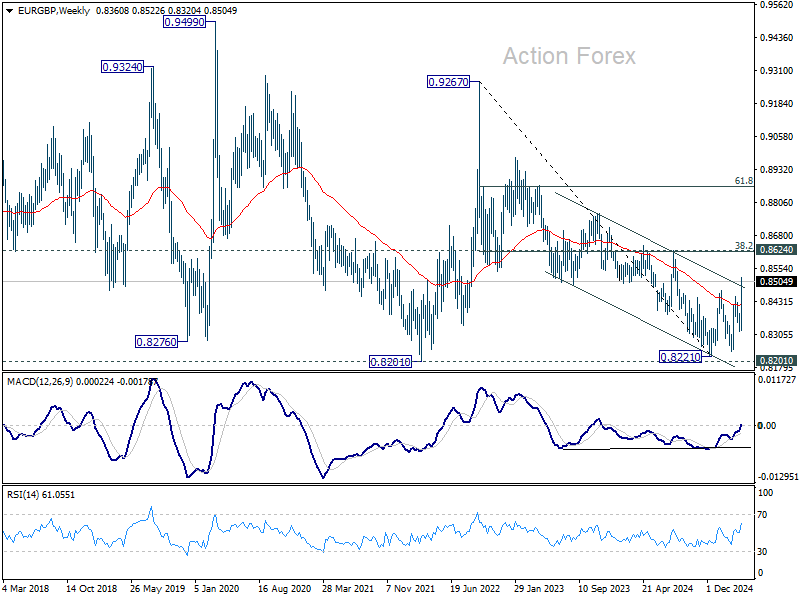
EUR/GBP Weekly Outlook
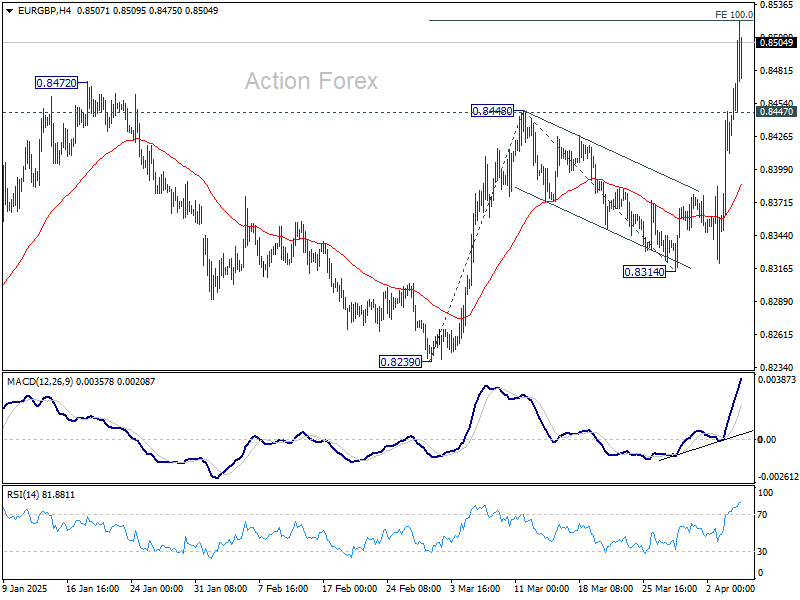
EUR/GBP's rise from 0.8239 resumed by breaking through 0.8448 and 0.8472 resistance. There is no sign of topping yet. Initial bias stays on the upside this week. Firm break of 100% projection of 0.8239 to 0.8448 from 0.8314 at 0.8523 will pave the way to 0.8624 cluster resistance next. On the downside, below 0.8447 minor support will turn intraday bias neutral first.
In the bigger picture, the break of medium term channel resistance is a bullish signal. Down trend from 0.9267 (2022 high) could have completed at 0.8221, just ahead of 0.9201 key support (2022 low). Firm break of 0.8624 cluster resistance (38.2% retracement of 0.9267 to 0.8221 at 0.8621) will confirm this bullish case and target 61.8% retracement at 0.8867 next. Nevertheless, rejection by 0.8624 will keep medium term outlook neutral at best.
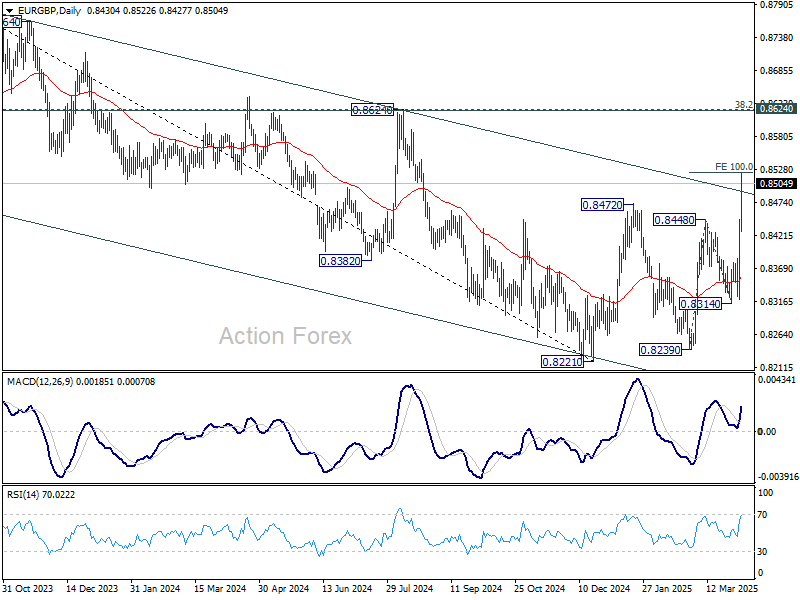
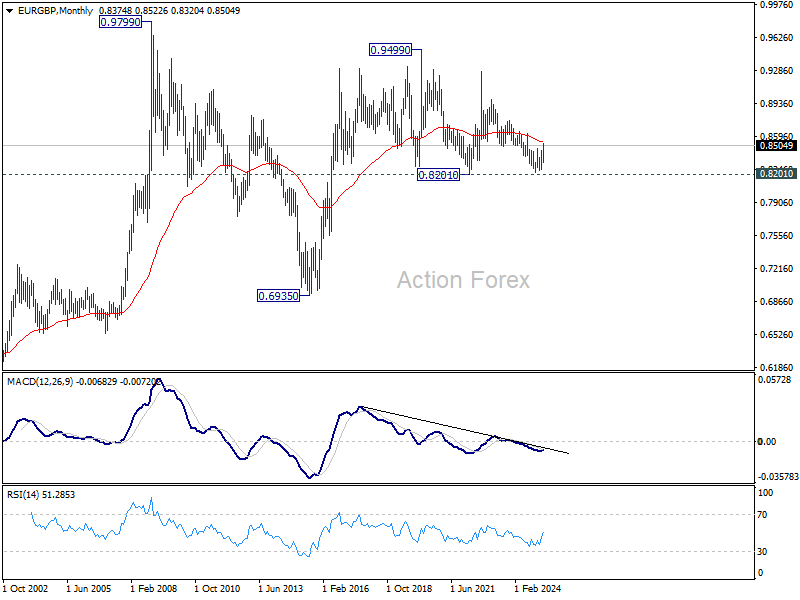
In the long term picture, price action from 0.9499 (2020 high) is seen as part of the long term range pattern from 0.9799 (2008 high). Range trading should continue between 0.8201 and 0.9499, until there is clear signal of imminent breakout.
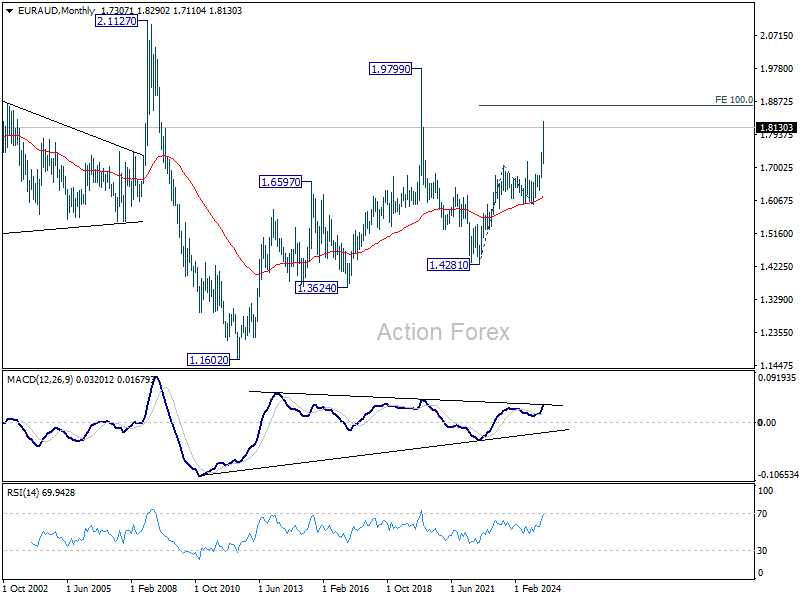
EUR/AUD Weekly Outlook
EUR/AUD's up trend resumed last week and accelerated to as high as 1.8290. There is no sign of topping yet. Initial bias stays on the upside for 161.8% projection of 1.6355 to 1.7417 from 1.7047 at 1.8765 next. On the downside, below 1.7965 minor support will turn bias neutral and bring consolidations first, before staging another rally.

In the bigger picture, up trend from 1.4281 (2022 low) is in progress, and in reacceleration phase as seen in W MACD. Next target is 100% projection of 1.4281 to 1.7062 from 1.5963 at 1.8744. Outlook will remain bullish as long as 1.7062 resistance turned support holds (2023 high) even in case of deep pullback.

In the longer term picture, rise from 1.4281 is seen as the second leg of the pattern from 1.9799 (2020 high), which is part of the pattern from 2.1127 (2008 high). As long as 55 M EMA (now at 1.6213) holds, this second leg could still extend higher. However, firm break of the above mention 1.8744 projection level with strong momentum, will argue that it's indeed resuming the up trend form 1.1602 (2012 low).

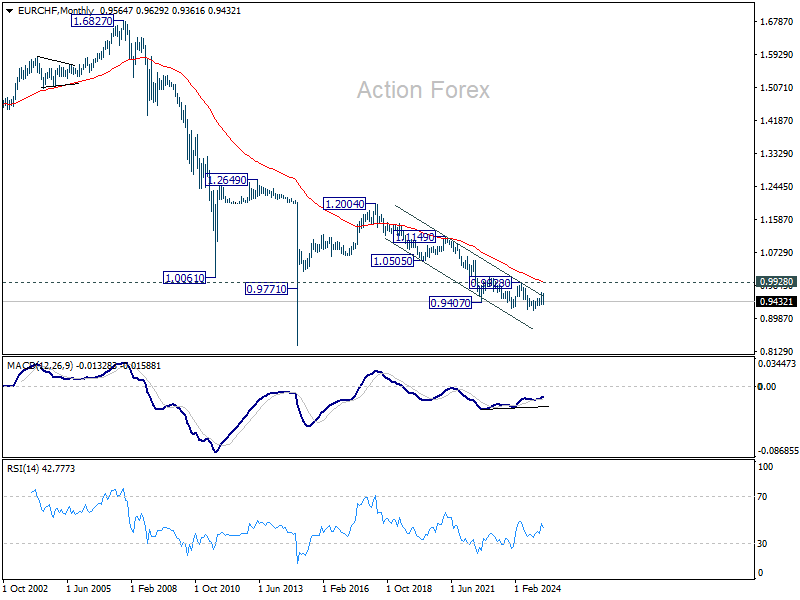
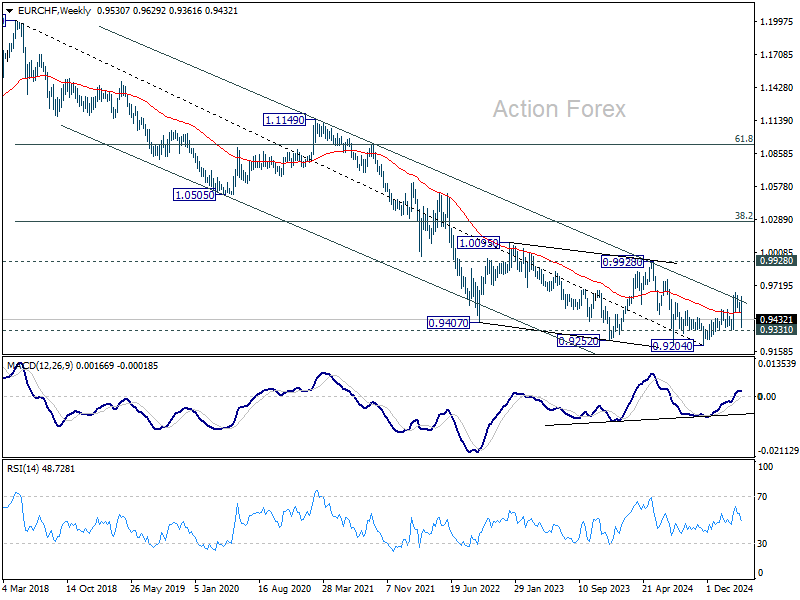
EUR/CHF Weekly Outlook
EUR/CHF's fall from 0.9660 resumed last week and dived to as low as 0.9361. Initial bias stays on the downside this week for 0.9331 structural support. Firm break there will indicate that whole rally from 0.9204 has completed as a three-wave correction, after rejection by channel resistance. Deeper decline would be seen to retest 0.9204 low next. On the upside, above 0.9473 minor resistance will turn intraday bias neutral first.

In the bigger picture, rejection by long-term falling channel resistance (now at 0.9600) will retail medium term bearishness. That is, down trend from 1.2004 (2018 high) is still in progress. Downside breakout through 0.9204 low would then be in favor at a later stage.
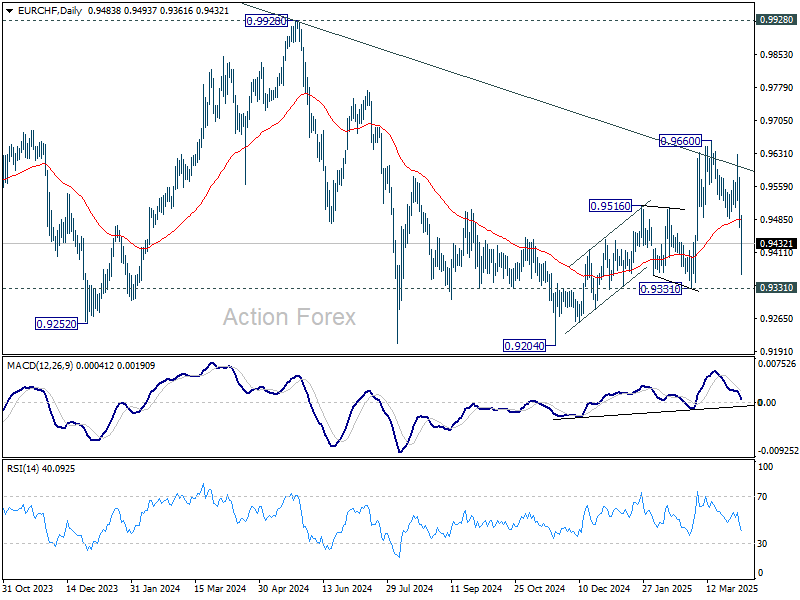
In the long term picture, bullish signs are emerging. However, the important hurdle at 0.9928 resistance, which is close to 55 M EMA (now at 0.9960), is needed to be taken out decisively before considering long term trend reversal. Otherwise, outlook is neutral at best.

Market Turmoil Unleashed as Global Tariff Battlelines Drawn
The global financial markets were shaken last week as US President Donald Trump’s long-anticipated reciprocal tariff plan arrived with a bang. The magnitude of the tariff rates, the number of countries impacted, and the sheer complexity of implementation shocked investors. What could have been a temporary setback quickly spiraled into a broader risk event, fueling sharp selloffs and potentially igniting a full-fledged bear market.
Matters only worsened after China swiftly responded with its own retaliatory measures. The rhetoric on both sides is heating up. Trump, doubling down on his hardline stance, declared on social media that his “policies will never change” and accused China of panicking. Meanwhile, Chinese officials dismissed the US measures, mockingly claiming, “The market has spoken.”
With Washington and Beijing locked in confrontation, global focus now turns to how the rest of the world will react. The first clear sign of diplomacy came from Vietnam, where General Secretary To Lam phoned Trump and offered to negotiate a deal to reduce tariffs on US exports to zero, in exchange for equal treatment. If this sets a precedent, it may provide insight into whether Trump’s long-term vision is truly a bilateral web of lowered trade barriers. Or, he has something else in his mind.
Still, the true litmus test lies ahead with the US-EU trade negotiations. European Commission President Ursula von der Leyen has shown no signs of backing down, warning that the EU “holds a lot of cards” and that “all instruments are on the table.” Europe’s massive market and leadership in tech give it leverage, and should talks break down, the threat of firm and coordinated countermeasures looms large. The shape and tone of the US-EU discussions will be critical in determining whether a full-blown global trade war materializes, or if some de-escalation is still possible.
In the currency markets, Swiss Franc emerged as the ultimate winner last week, solidifying its position as the top safe-haven asset, while Yen followed closely. Euro, notably, seems to be replacing Dollar as a safe-haven choice. The
At the bottom of the currency ladder was the Aussie, which was hammered by China’s retaliation, given its economic dependence on Chinese demand. Kiwi followed while Sterling rounded out the bottom three. Loonie, and Dollar saw mixed results—gaining ground against commodity currencies but faltering against their safe-haven counterparts.
Oversold Bounce Possible, Yet Trade War Escalations Keep Downside Risks Elevated
Following last week's brutal stock market selloff, there’s technical scope for a short-term rebound. Markets are deeply oversold, and some bargain-hunting or short coverers may lift equities from their recent lows in the days ahead. However, any recovery in risk sentiment will likely be capped by the still-heavy cloud of uncertainty surrounding the unfolding global tariff war.
Despite the market's hopes, it’s unrealistic to expect trade negotiations — especially those involving sweeping reciprocal tariffs and multiple major economies — to wrap up quickly. The threat of a prolonged standoff or even a complete breakdown in talks remains high. In such a case, a full-blown global trade war could be on the table, with wide-ranging consequences for investment, consumption, and global growth.
Of particular concern is Europe’s position in this trade crossfire. Both the EU and ECB have previously flagged concerns that China could redirect excess supply to the EU if blocked by US tariffs. Such dumping would put further pressure on already weak growth and inflation in the region. To avoid this, Europe might be forced to erect its own trade barriers against China, risking retaliation and further fragmentation of global trade flows.
In this increasingly fragile environment, the risks for a synchronized global slowdown looms large. However, unlike the Great Recession of 2008-09, unlikely the country could act as a buffer this time. China itself is now a central target in the trade conflict, and its export-driven model could face unprecedented pressure from multiple fronts. That leaves the world vulnerable to a more prolonged and widespread economic downturn if trade tensions escalate further.
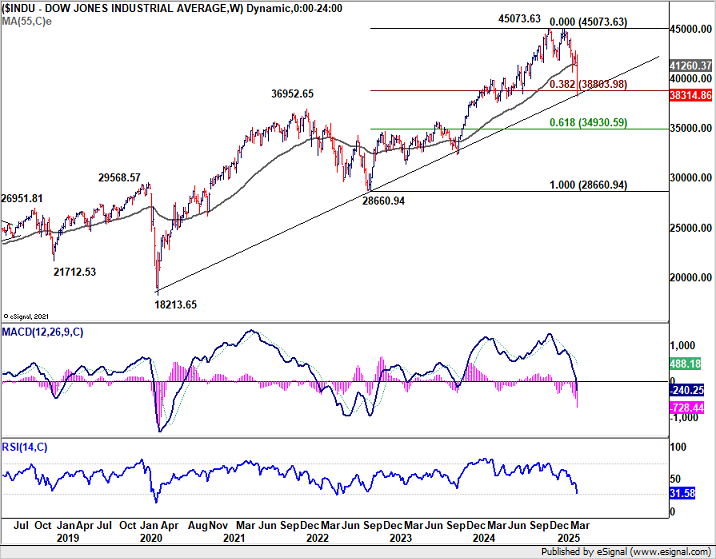
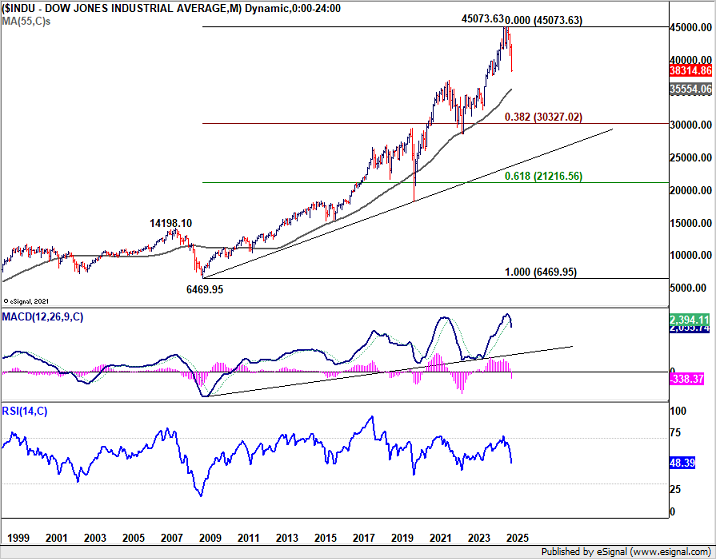
For traders and investors, the message is clear. Any near-term rally should be treated with caution. Rebounds may be sharp, but as long as key technical resistance levels in major indexes like DOW, Nikkei, or DAX remain intact, it's premature to call it a return to normal. Until then, the base case remains a fragile market dominated by geopolitical risk, with any relief rallies vulnerable to sudden reversals.
Technically, for DOW, it's now at an important support zone of the long term rising trend line and 38.2% retracement of 28660.94 to 45071.29 at 38802.54. A rebound from current level would be reasonable, but risk will stay heavily on the downside as long as 55 W EMA (now at 41260.37) holds. However, sustained break of 38802.54 will raise the change of even deeper correction to next key support at 55 M EMA (now at 35554.06).
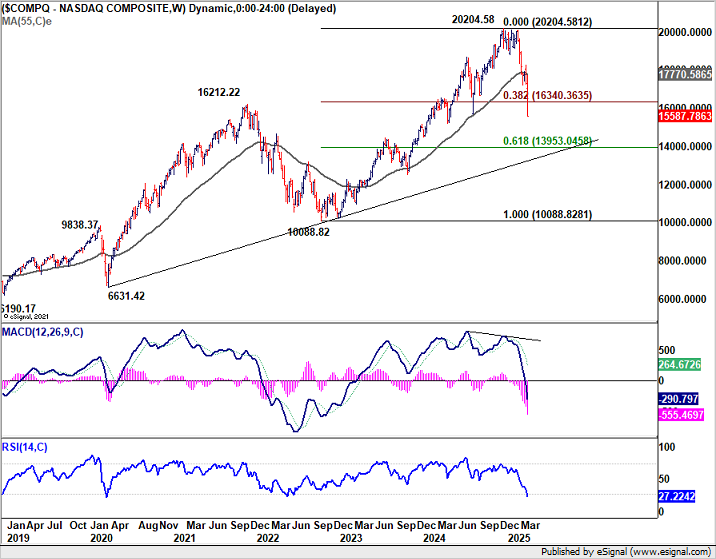
NASDAQ's outlook was worse with the break of 38.2% retracement of 10088.82 to 20204.68 at 16340.36. Risk will stay on the downside as long as 55 W EMA (now at 17770.58) holds. Fall from 20204.58 should be on track to 55 M EMA (now at 14387.21) on next fall.
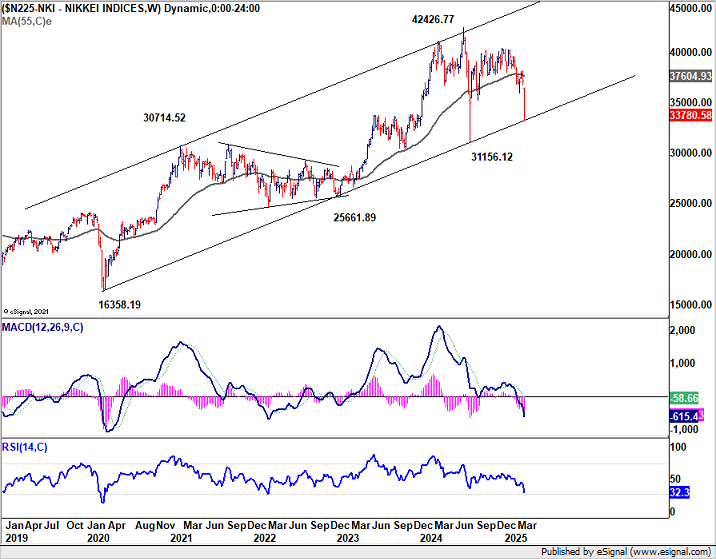
Nikkei's steep fall confirmed that corrective pattern from 42426.77 (2024 high) has already started the third leg. Strong bounce from current level will keep Nikkei inside the long term rising channel. But risk will stay on the downside as long as 55 W EMA (now at 37604.93) holds. Sustained trading below the channel support will bring even deeper fall to 55 M EMA (now at 31405.39) or even further to 38.2% retracement of 6994.89 (2009 low) to 42426.77 at 28891.80.
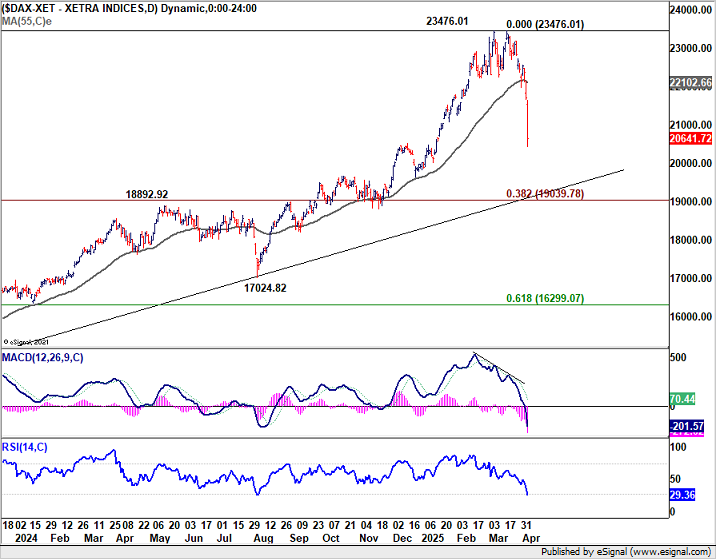
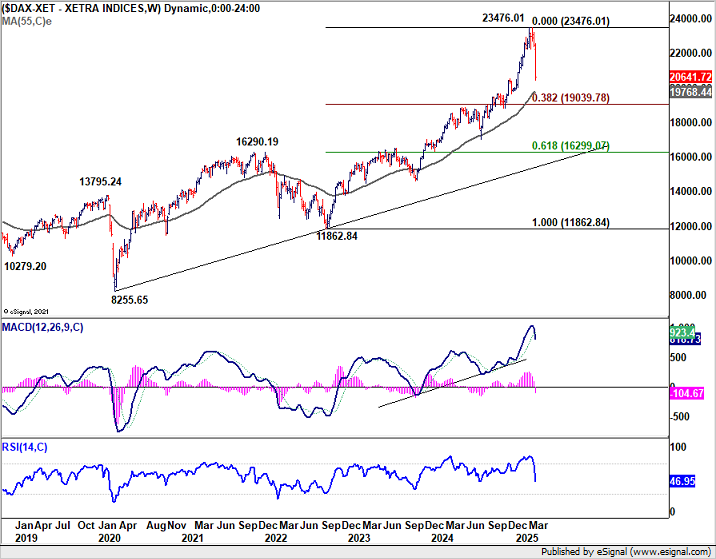
Outlook in DAX is slightly better thanks to the strong rally in March. But still, near term risk will be on the downside as long as 55 D EMA (now at 22102.60) holds. Fall from 23476.01 is seen as corrective the up trend from 11862.84 (2022 low only). There are a few levels ahead that could help floor the correction, including 55 W EMA (now at 19768.44), trend line support at around 19200, and 38.2% retracement of 11862.84 to 23476.01 at 19039.78.
Will 100 Be the Savior for Sliding Dollar Index?
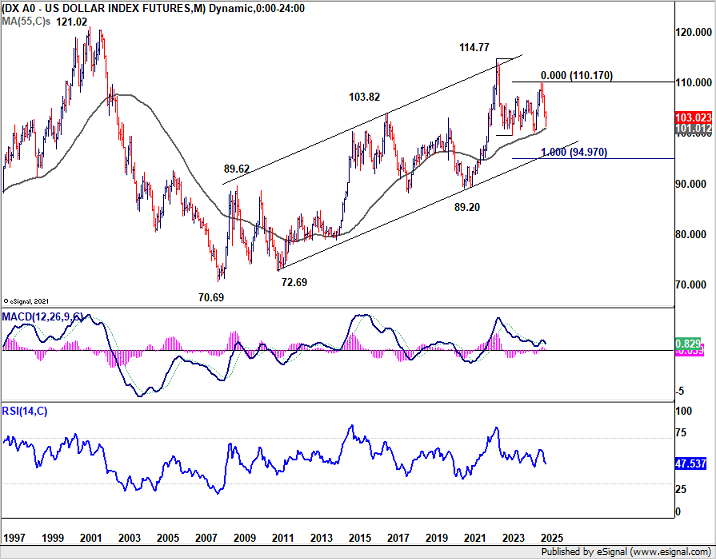
Dollar Index staged a notable late-week rebound, closing at 103.02 on Friday, well off the week's low of 101.26. The move helped ease immediate downside pressure. The 100 psychological level, along with the 55 M EMA (now at 101.01) could provide a floor in the near term and turn the index into consolidations. Still, firm break of 104.68 resistance is needed to confirm short term bottoming first. Or risk will remain on the downside.
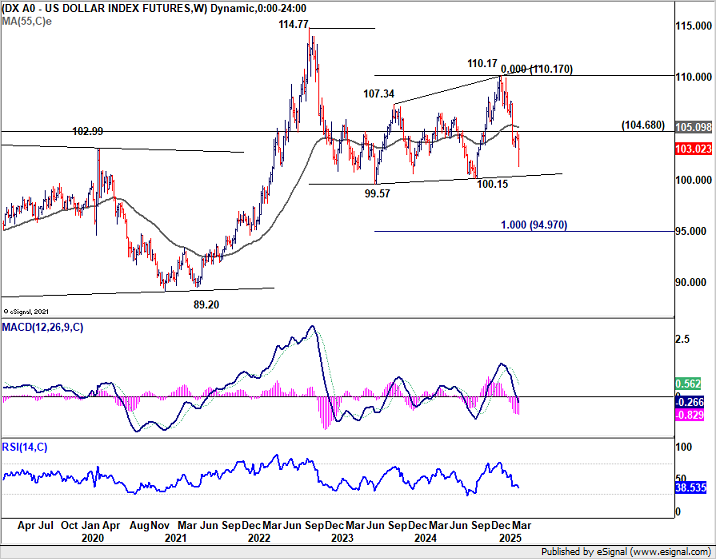
From a broader perspective, the fall from 110.17 is seen as the third leg of a larger correction originating from 114.77 (2022 high). Decisive break below key 99.57/100.15 support zone would open the door for deeper medium term fall to decade-long rising channel support (now at 95.80), or even further to 100% projection of 114.77 to 99.57 from 110.17 at 94.97.
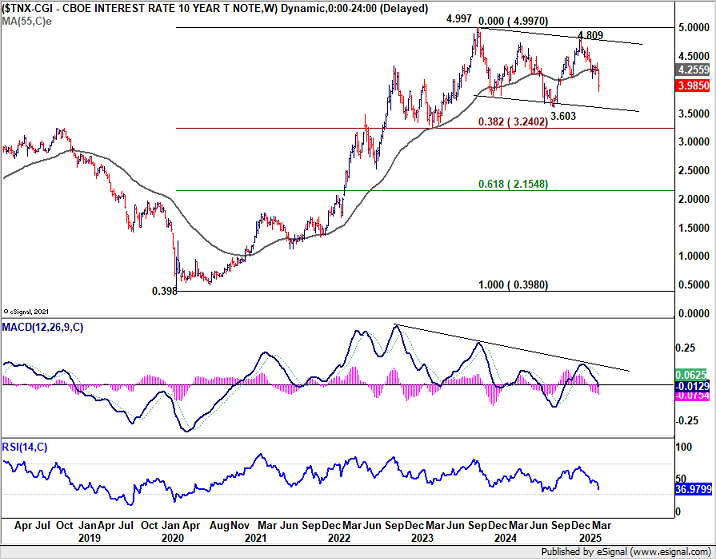
A critical variable in Dollar’s path is the development of US Treasury yields. The sharp drop in the 10-year yield last week reinforces the view that the broader corrective pattern from 4.997 (2023 high) is in another downleg.
Risk will stay on the downside as long as 55 W EMA (now at 4.255) holds. Further decline is likely to 3.603 support.
Even so, solid technical support should emerge from the 38.2% retracement of 0.398 to 4.997 at 3.240 to contain downside. That should provide some support to floor Dollar's decline in the medium term.
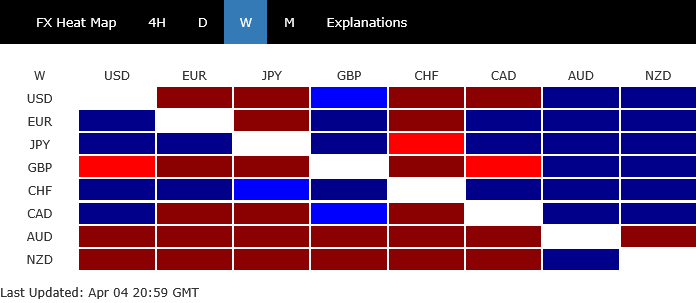
Swiss Franc Dominates in Europe, Would It Cap EUR/GBP Advance?
Swiss Franc ended last week as the strongest European currency, outperforming both Euro and the risk-sensitive Sterling by a mile.
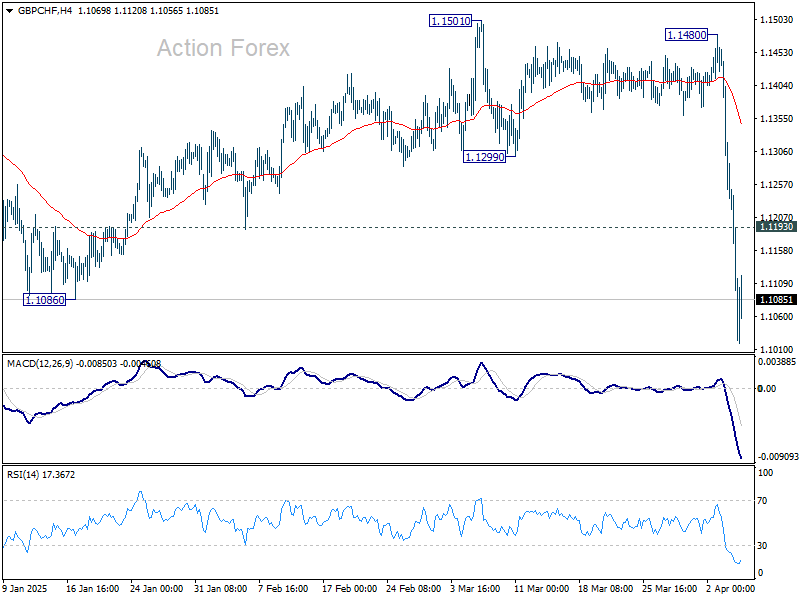
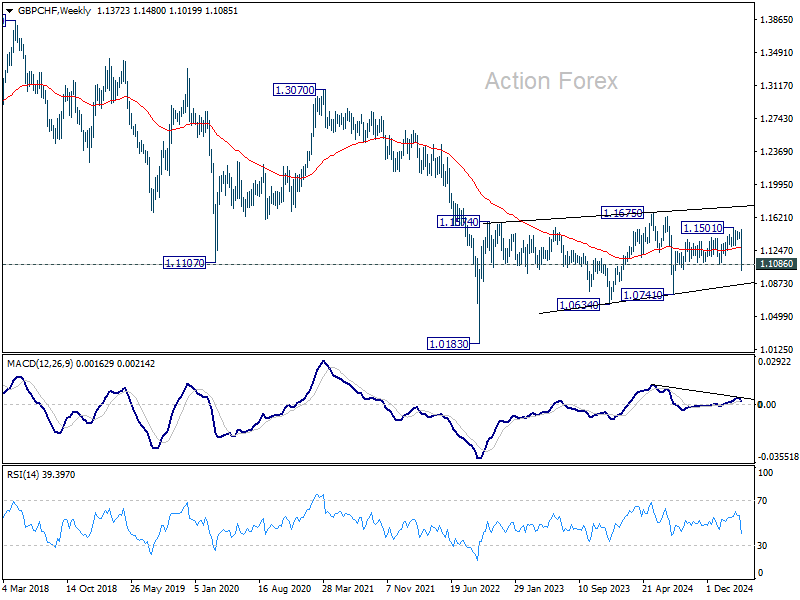
GBP/CHF's break of 1.1086 support suggests that whole rally from 1.0741 has completed at 1.1501. Deeper fall should be seen back to 1.0741 support first. Firm break there will argue that long term down trend is ready to resume through 1.0183 (2022 low). Meanwhile, above 1.1193 minor resistance will turn bias neutral and bring consolidations first, before staging another fall.
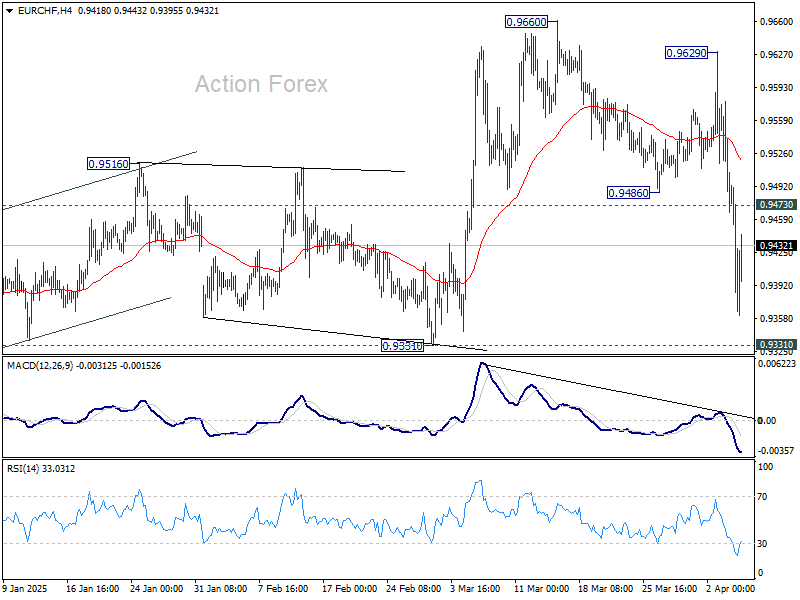
As for EUR/CHF, focus is back on 0.9331 support after the sharp fall. Firm break there should confirm that rebound form 0.9204 has completed at 0.9660. More importantly, that would also confirm rejection by the long term channel resistance. Larger down trend might then be ready to resume through 0.9204.
EUR/GBP resumed the rise from 0.8239 and hit as high as 0.8522, just shy of 100% projection of 0.8239 to 0.8448 from 0.8314 at 0.8523. The break of medium term falling channel resistance is a bullish sign. It's also plausible that down trend from 0.9267 (2022 high) has completed at 0.8221, just ahead of 0.8201 key support (2022 low). Firm break of 0.8523 will affirm this case, and target 0.8624 cluster resistance (38.2% retracement of 0.9267 to 0.8221 at 0.8621) for confirmation of bullish reversal.
However, for EUR/GBP to extend its bull run decisively, support is needed from a rebound in EUR/CHF. If EUR/CHF breaks down further below 0.9331 and drags on Euro more broadly, EUR/GBP would struggle to gain traction or even come under pressure itself.


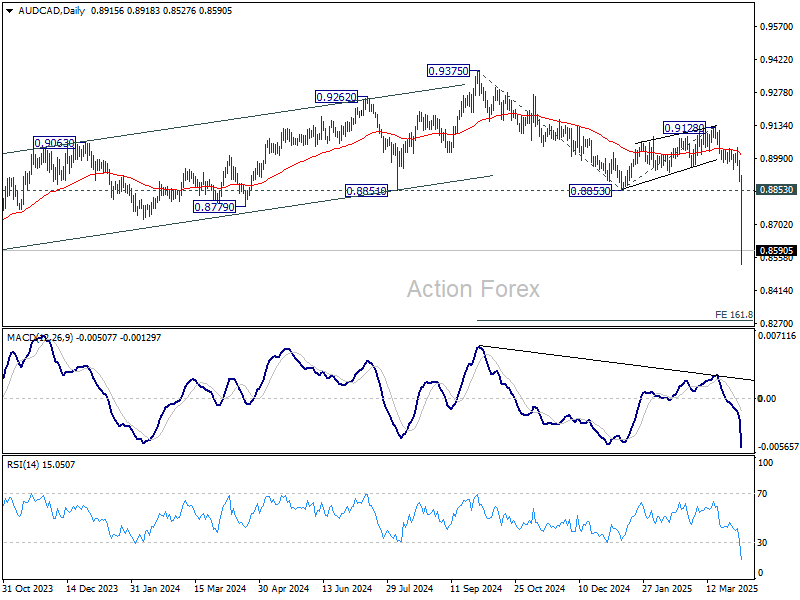
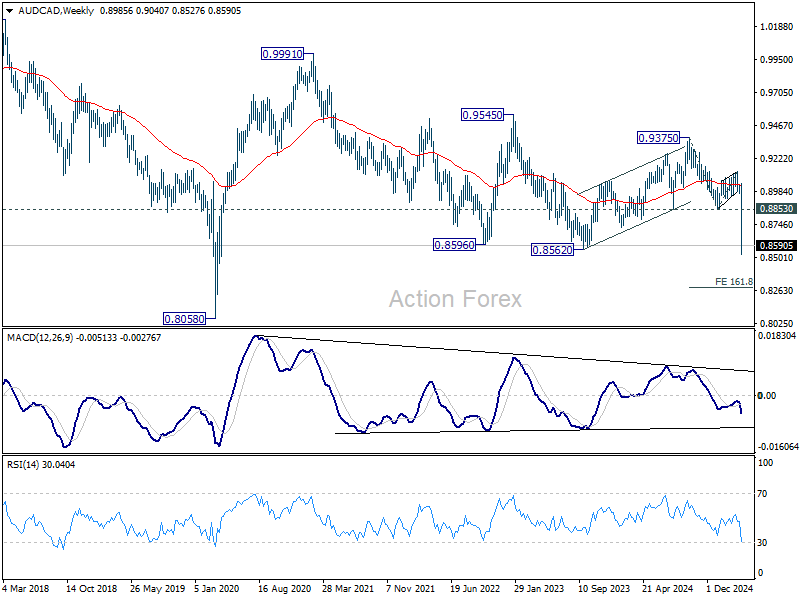
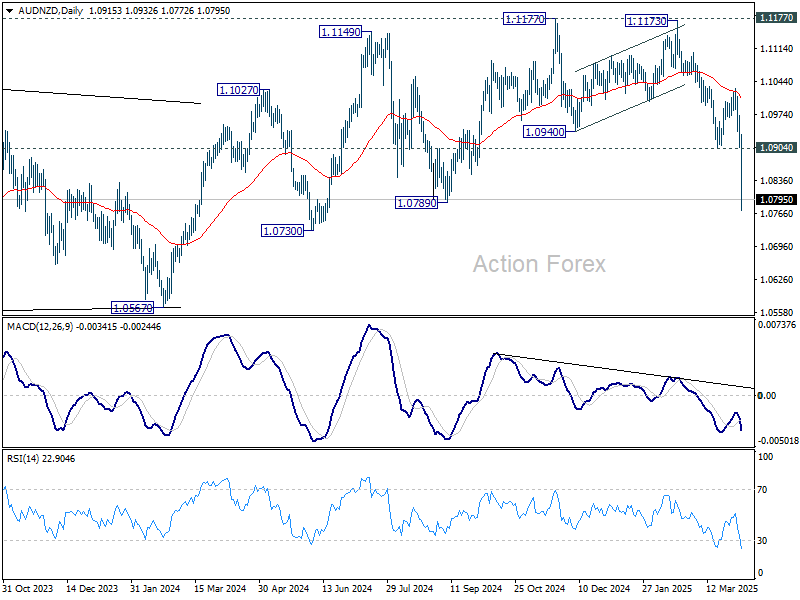
AUD/CAD and AUD/NZD in free fall
Commodity currencies all declined broadly on risk aversion. But Aussie was the worst by far, particularly hard-hit following China’s announcement of retaliatory tariffs against the US.
AUD/CAD's break of 0.8562 (2023 low) suggests that whole down trend from 0.9991 (2021 high) is resuming. Outlook will stay bearish as long as 0.8853 support turned resistance holds, even in case of recovery. Next target is 161.8% projection of 0.9375 to 0.9128 from 0.8853 at 0.8283.
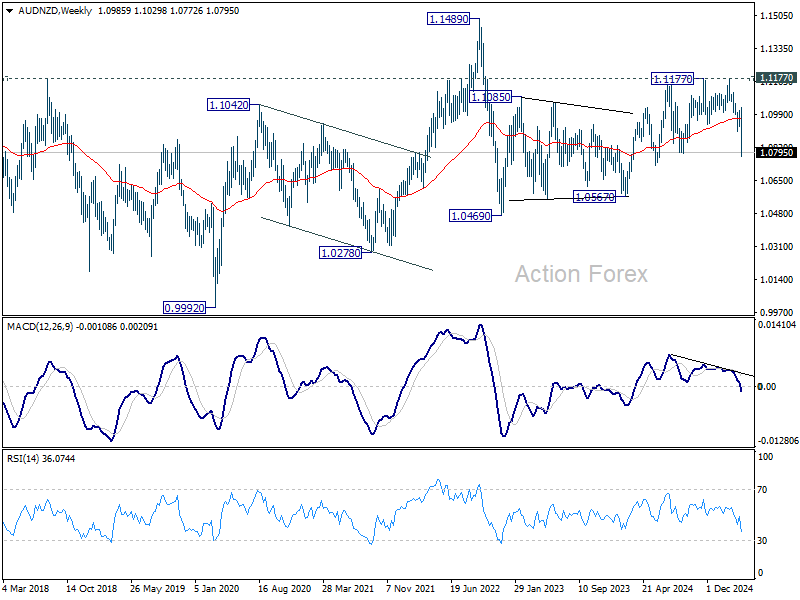
AUD/NZD's break of 1.0789 support suggests that rise from 1.0567 has already completed at 1.1177 already. More importantly, whole rebound from 1.0469 (2022 low) could have finished as a three-wave corrective rise too. Near term outlook will now remain bearish as long as 1.0904 support turned resistance holds. Deeper fall would be see back to 1.0567 support next. Firm break there will raise the chance that whole down trend from 1.1489 (2022 high) is ready to resume through 1.0469.
USD/JPY Weekly Outlook
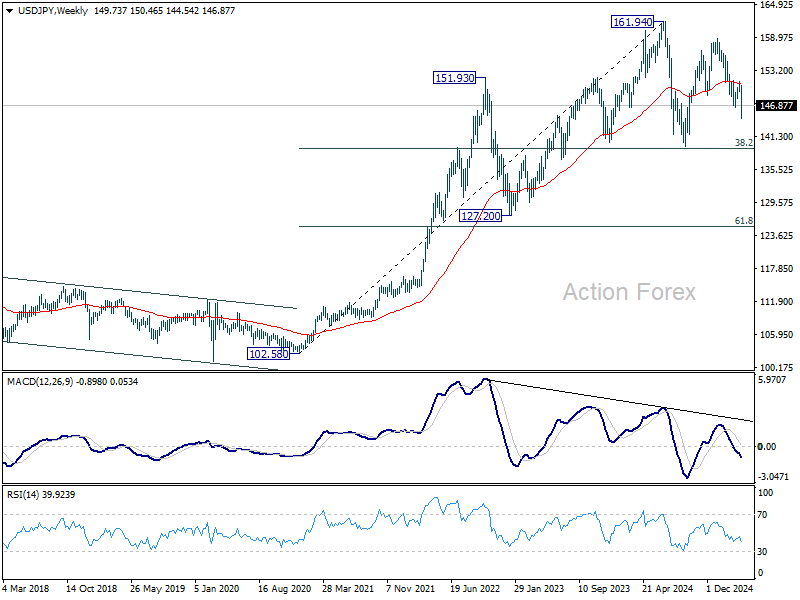
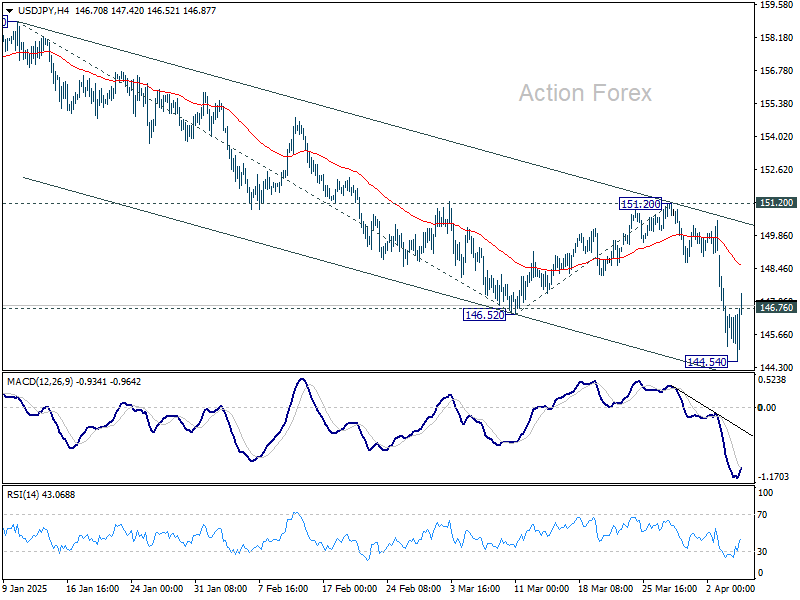
USD/JPY's fall from 158.86 resumed last week and hits as low as 144.54. But a temporary low should be formed with subsequent recovery. Initial bias is turned neutral this week for consolidations first. Outlook will remain bearish as long as 151.20 resistance holds. Below 144.54 will target 61.8% projection of 158.86 to 146.52 from 151.20 at 143.57. Break there will target 139.57 low.
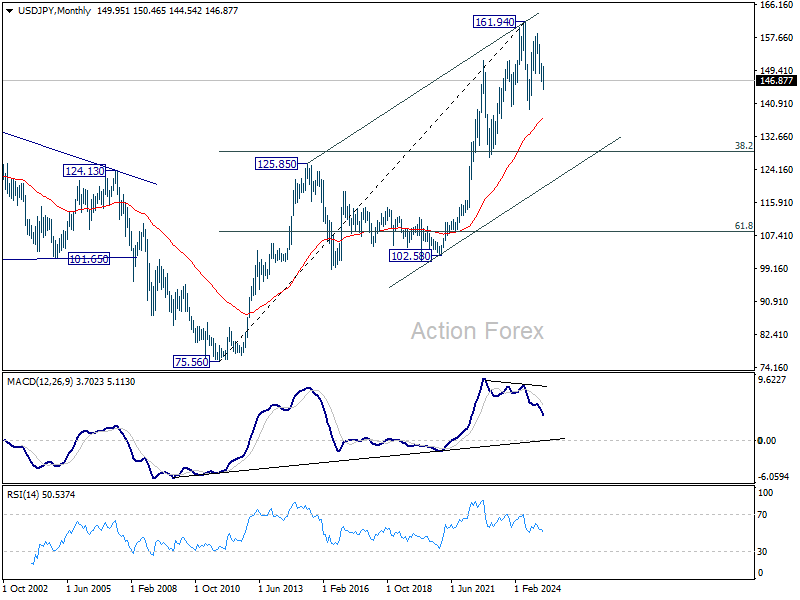
In the bigger picture, price actions from 161.94 are seen as a corrective pattern to rise from 102.58 (2021 low), with fall from 158.86 as the third leg. Strong support should be seen from 38.2% retracement of 102.58 to 161.94 at 139.26 to bring rebound. However, sustained break of 139.26 would open up deeper medium term decline to 61.8% retracement at 125.25.
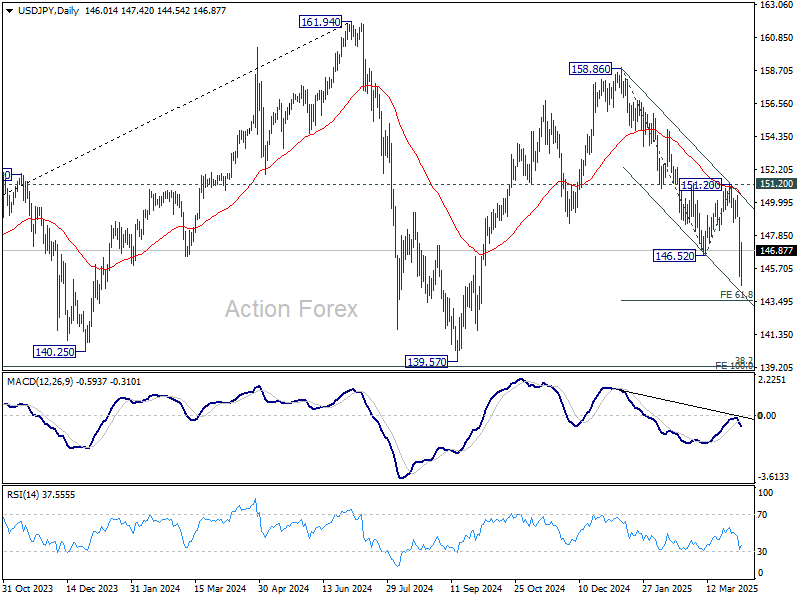
In the long term picture, it's still early to conclude that up trend from 75.56 (2011 low) has completed. A medium term corrective phase should have commenced, with risk of deep correction towards 55 M EMA (now at 137.30) and even below.