Sample Category Title
Gold and WTI Crude Oil Crash As Trade War Escalates
Gold price started a fresh decline below $3,050. WTI Crude oil is down over 10% and remains at risk of more losses.
Important Takeaways for Gold and WTI Crude Oil Prices Analysis Today
- Gold price climbed higher toward the $3,150 zone before there was a sharp decline against the US Dollar.
- A key bearish trend line is forming with resistance near $3,068 on the hourly chart of gold at FXOpen.
- WTI Crude oil prices extended downsides below the $65.00 support zone.
- A major bearish trend line is forming with resistance near $60.70 on the hourly chart of XTI/USD at FXOpen.
Gold Price Technical Analysis
On the hourly chart of Gold at FXOpen, the price climbed above the $3,050 resistance. The price even spiked above $3,150 before the bears appeared.
A high was formed near $3,167 before there was a fresh decline. There was a move below the $3,100 support level. The bears even pushed the price below the $3,000 support and the 50-hour simple moving average.
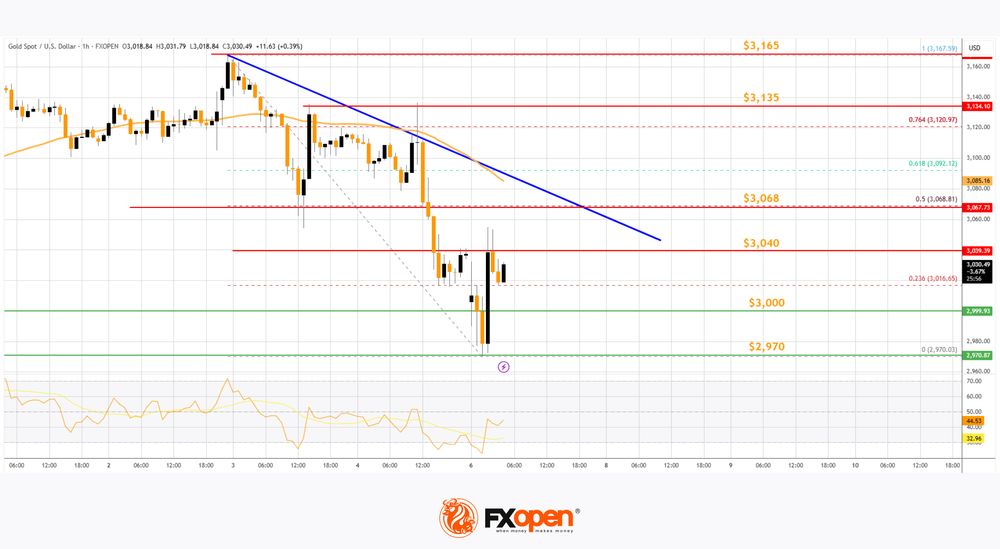
It tested the $2,970 zone. A low is formed near $2,970 and the price is now showing bearish signs. There was a minor recovery wave above the 23.6% Fib retracement level of the downward move from the $3,167 swing high to the $2,970 low.
However, the bears are active below $3,050. Immediate resistance is near $3,040. The next major resistance is near the $3,068 zone and a key bearish trend line. It is close to the 50% Fib retracement level of the downward move from the $3,167 swing high to the $2,970 low.
The main resistance could be $3,135, above which the price could test the $3,165 resistance. The next major resistance is $3,200.
An upside break above the $3,200 resistance could send Gold price toward $3,250. Any more gains may perhaps set the pace for an increase toward the $3,320 level. Initial support on the downside is near the $3,000 level.
The first major support is near the $2,970 level. If there is a downside break below the $2,970 support, the price might decline further. In the stated case, the price might drop toward the $2,950 support.
WTI Crude Oil Price Technical Analysis
On the hourly chart of WTI Crude Oil at FXOpen, the price struggled to continue higher above $72.00 against the US Dollar. The price formed a short-term top and started a fresh decline below $70.00.
There was a steady decline below the $65.60 pivot level. The bears even pushed the price below $62.20 and the 50-hour simple moving average. Finally, the price tested the $59.20 zone. The recent swing low was formed near $59.21, and the price is now consolidating losses.
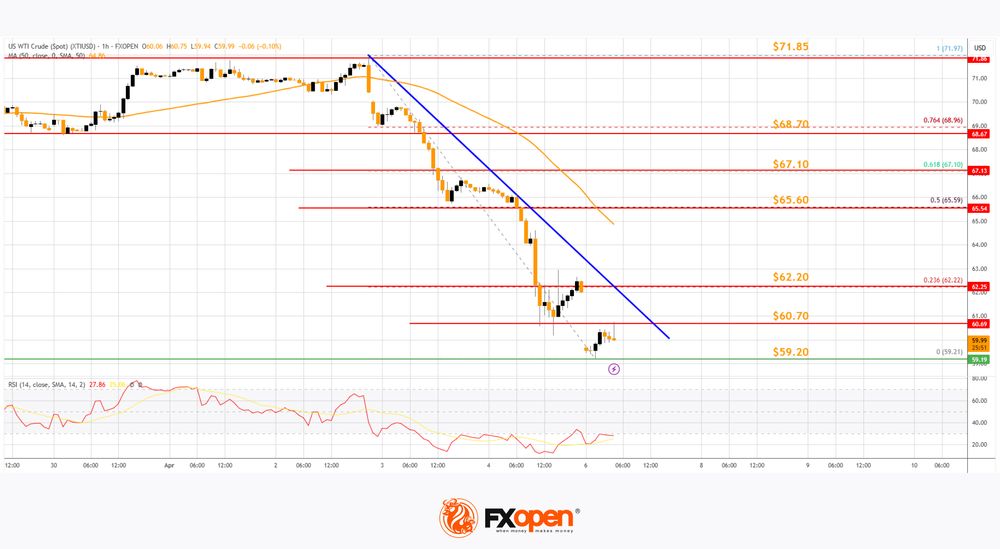
There was a minor move above the $60.00 level. On the upside, immediate resistance is near the $60.70 level. There is also a major bearish trend line forming with resistance near $60.70.
The next resistance is near the $62.20 level and the 23.6% Fib retracement level of the downward move from the $71.97 swing high to the $59.21 low. The main resistance is near a trend line at $65.60.
The 50% Fib retracement level of the downward move from the $71.97 swing high to the $59.21 low is also near $65.60. A clear move above the $65.60 zone could send the price toward $68.70. The next key resistance is near $71.85. If the price climbs further higher, it could face resistance near $72.20. Any more gains might send the price toward the $75.00 level.
Immediate support is near the $59.20 level. The next major support on the WTI crude oil chart is near $58.00. If there is a downside break, the price might decline toward $55.00. Any more losses may perhaps open the doors for a move toward the $52.00 support zone.
Start trading commodity CFDs with tight spreads. Open your trading account now or learn more about trading commodity CFDs with FXOpen.
This article represents the opinion of the Companies operating under the FXOpen brand only. It is not to be construed as an offer, solicitation, or recommendation with respect to products and services provided by the Companies operating under the FXOpen brand, nor is it to be considered financial advice.
Risk for a Further Loss of Confidence in US Dollar
Markets
On Friday, the post-Liberation Day risk-off move evolved to outright market panic. European equity markets from the open drifted further south. Around noon, China announced retaliation to the US tariffs, matching the baseline US 34% tariff with a similar levy, adding a series of additional ‘technical’ measures. The China action only reinforced investor fears for a spiraling tit-for-tat escalation. Risk-off selling accelerated. US March payrolls were ok, with a 228k net job creation (48k negative revision from the previous month), a modest rise in the unemployment rate (due to higher participation rate) and close to expectations wage growth (0.3% M/M and 3.9% Y/Y). Even as the Trump administration sees this as supporting its approach, markets understandably only saw it as news from an old era. US yields at some point at the start of US dealings declined near 15-20 bps, but in nervous trading gradually tried to look for a bottom. This process was supported later in the session as Fed chair Powell at least tempered market hopes that the Fed might stand ready to reactivate the hoped for a Fed put. The Fed Chair basically reiterated its standing assessment that there is still a lot of uncertainty on the effects of the tariffs. It’s not clear what appropriate policy will be. Given that inflation is still elevated, the Fed should avoid that tariffs turn out to be something more persistent. US yields further reversed a big part of the earlier decline closing “only” 1.8 bps (5-y) to 6.2 bps (30-y) lower. It didn’t help to contain the damage on the equity markets. Major US indices closed between 5.5% and 6% lower. German Bunds also captured a strong safe have bid with yields declining between 12.1 bps (2-y) and 6.3 bps (30-y). This time, the bund also substantially outperformed swaps, illustrating the safe haven run. Intra-EMU spreads widened modestly (10-y Italy +7 bps). On FX markets, the USD rout took a breather. DXY rebounded from 101.98 to 103.02. EUR/USD declined from the 1.105 area to 1.0956. USD/JPY closed just below 147. The likes of the Aussie dollar were hit hard after the China retaliation. AUD/USD tumbled from the 0.63 area to close at 0.602!
This morning, the risk sell-off/panic in Asia only accelerates. The Nikkei and the CSI 300 are ceding about 7%. The Hang Seng prints 12% lower. Despite Powell’s ‘guidance’ that the Fed for now will hold a wait-and-see modus, US Treasury yields in very volatile trading again decline up to 15 bps at the short end of the curve as markets ponder whether the Fed can stay on the sidelines if current market and economic uncertainty unravels further. European and US equity futures also again suggest losses of about 4%. Eco data today are very few, and in any case won’t be of any relevance for markets. On interest rate markets, we look out how they continue to assess the central bank’s reaction function when balancing the risk of higher inflation and at the same time rising recessionary and financial stability risks. Several governments outside the US (including EMU) are considering additional fiscal measures to mitigate the fall-out from the tariffs. Additional fiscal spending on top of what is being put in place for defense in theory at some point should put a floor for long-term yields. Question is whether/when markets will pick up this factor. On FX, despite Friday’s pause, we still see risk for a further loss of confidence in the US dollar.
News & Views
The Brent crude oil price fell below $64/b for the first time since early 2021 this morning, extending the slide started after Trump’s tariff policy announcement ($75/b). Global demand/recession worries combine with supply factors. OPEC+ last week announced a surprisingly large output hike by eight members (+411k b/d in May, triple the expected amount) and news agency Reuters yesterday reported that Saudi Arabia slashed official selling prices for its flagship Arab light crude for Asian buyers by $2.3/b to $1.2/b above the average of Oman and Dubai prices. That’s the biggest decline in more than two years and the second consecutive month that state oil company Aramco lowers prices (to the lowest level in four months).
Chinese policymakers discussed measures to stabilize the economy over the weekend. Amongst others, they want to frontload stimulus plans to boost consumption according to people familiar with the matter. Subsidizing some exports and setting up a stabilization fund to shore up the stock market are also under consideration. China also indicated room to ease borrowing rates and reserve rates for lenders if needed while a weaker currency is also thrown into the mix. USD/CNY (7.31) approaches the multi-year highs around 7.33.
EUR/USD Daily Outlook
Daily Pivots: (S1) 1.0889; (P) 1.0999; (R1) 1.1072; More...
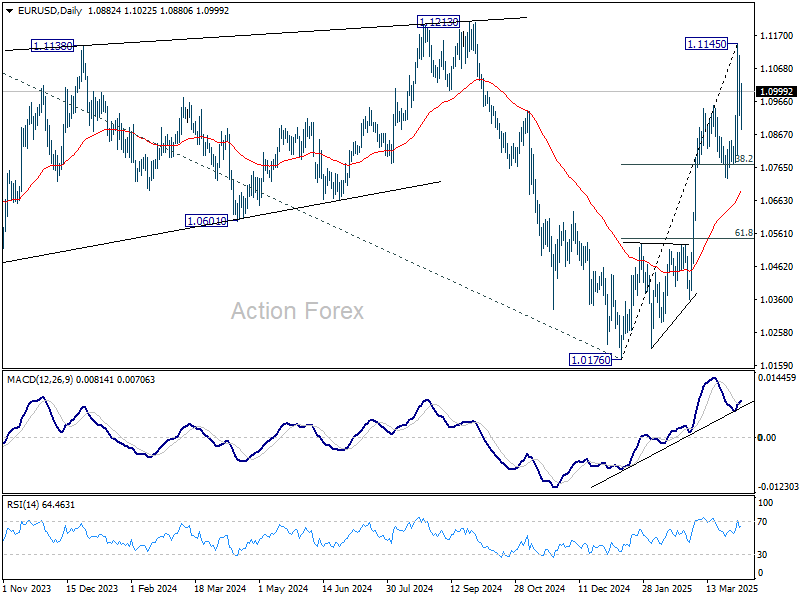
Intraday bias in EUR/USD remains neutral for consolidations below 1.1145. Downside of retreat should be contained by 38.2% retracement of 1.0176 to 1.1145 at 1.0775 to bring rebound. On the upside, above 1.1145 will resume the rally from 1.0176 to 1.1213/74 key resistance zone next.
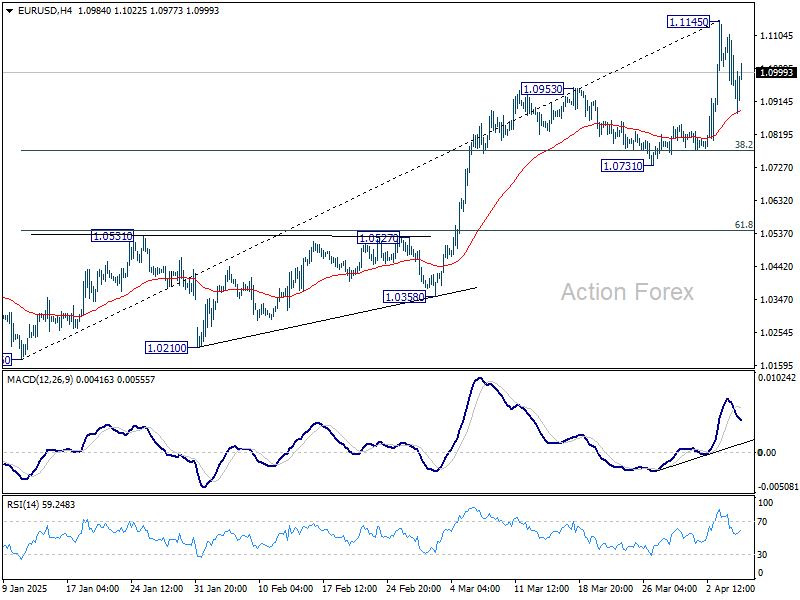
In the bigger picture, fall from 1.1274 (2024 high) has completed as a three wave correction to 1.0176. Rise from 0.9534 ready to resume. Decisive break of 1.1274 will target 100% projection of 0.9534 to 1.1274 from 1.0176 at 1.1916. Also, that will send EUR/USD through the multi-decade channel resistance will carries larger bullish implication. This will now be the favored case as long as 1.0731 support holds.
USD/JPY Daily Outlook
Daily Pivots: (S1) 145.24; (P) 146.34; (R1) 148.12; More...
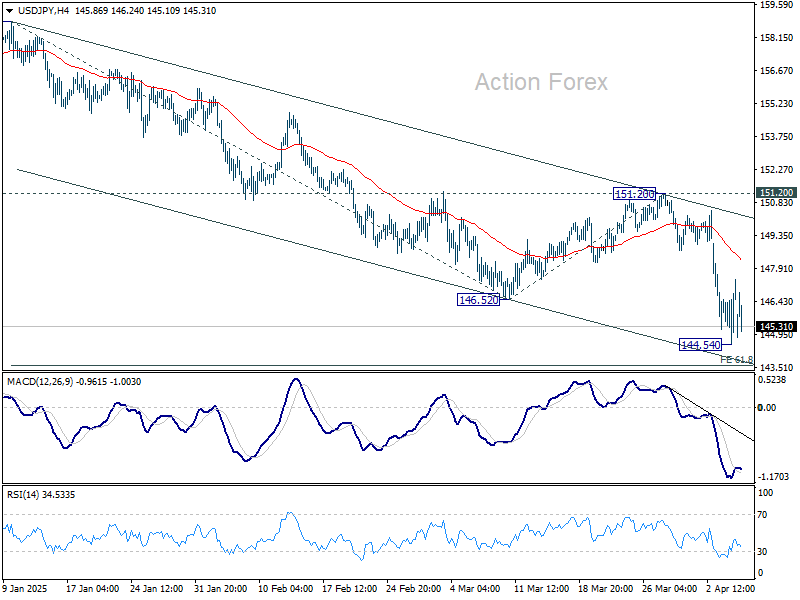
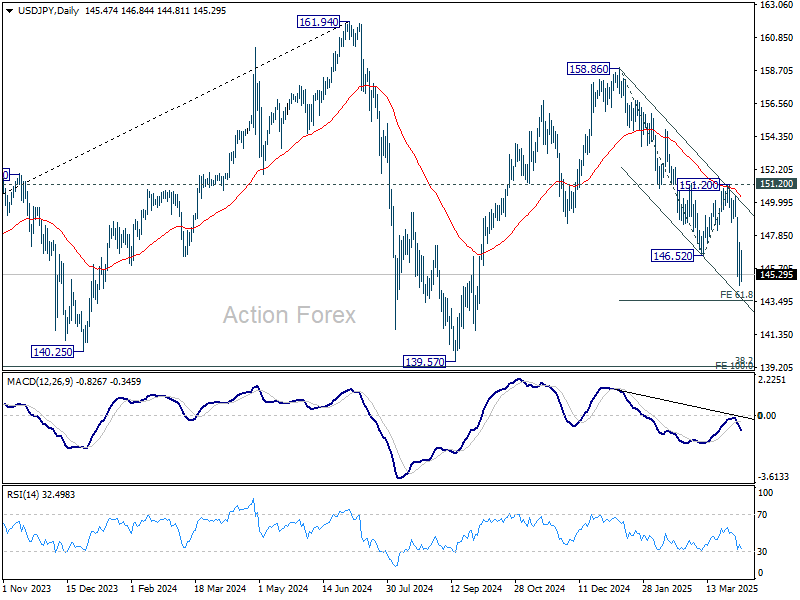
Intraday bias in USD/JPY remains neutral for consolidations above 144.54 temporary low. Upside of recovery should be limited below 151.28 resistance. On the downside, below 144.54 will resume the fall from 158.86 and target 61.8% projection of 158.86 to 146.52 from 151.20 at 143.57. Break there will target 139.57 low.
In the bigger picture, price actions from 161.94 are seen as a corrective pattern to rise from 102.58 (2021 low), with fall from 158.86 as the third leg. Strong support should be seen from 38.2% retracement of 102.58 to 161.94 at 139.26 to bring rebound. However, sustained break of 139.26 would open up deeper medium term decline to 61.8% retracement at 125.25.
GBP/USD Daily Outlook
Daily Pivots: (S1) 1.2789; (P) 1.2959; (R1) 1.3066; More...
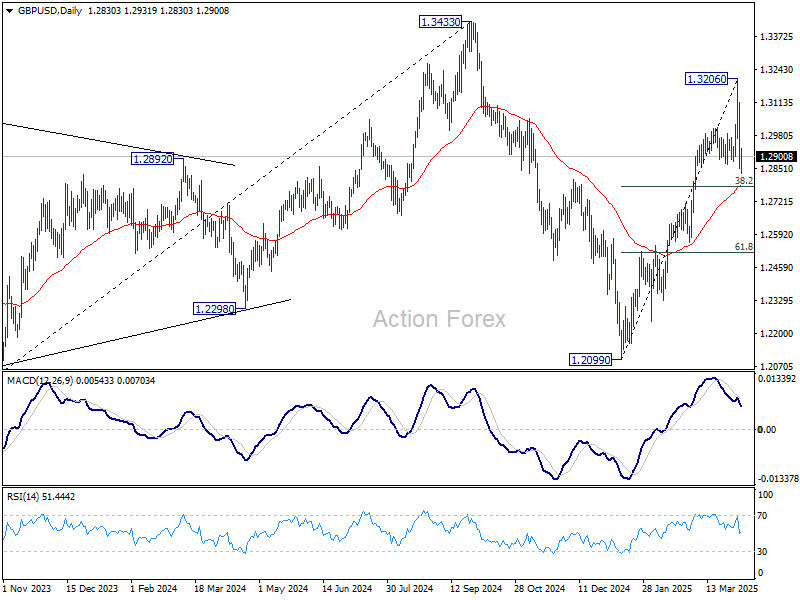
Intraday bias in GBP/USD remains on the downside for the moment. Fall from 1.3206 short term top should extend to 38.2% retracement of 1.2099 to 1.3206 at 1.2783. Decisive break there will target 61.8% retracement at 1.2522. On the upside, above 1.2961 minor resistance will turn intraday bias neutral first.
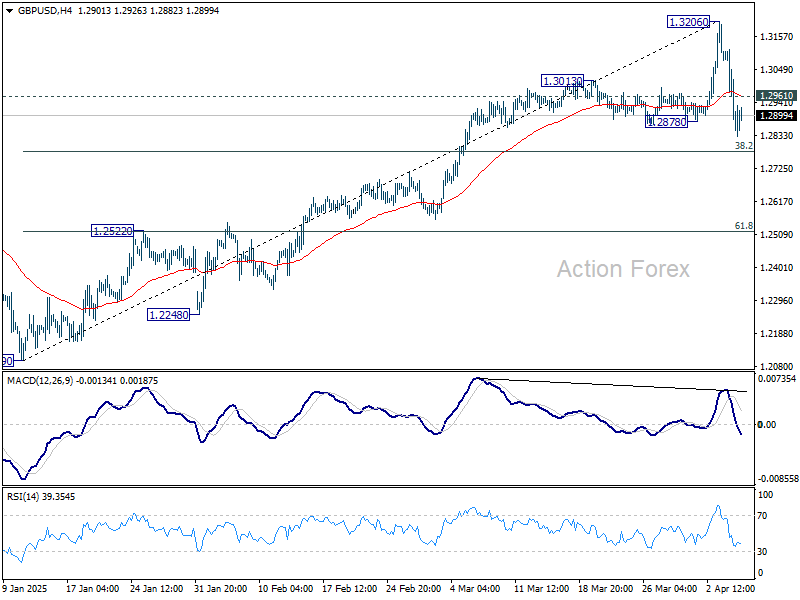
In the bigger picture, price actions from 1.3433 are seen as a corrective pattern to the up trend from 1.3051 (2022 low). Rise from 1.2099 could be the second leg. Overall, GBP/USD should target 1.4248 key resistance (2021 high) on break of 1.3433 at a later stage.
USD/CHF Daily Outlook
Daily Pivots: (S1) 0.8515; (P) 0.8570; (R1) 0.8663; More…
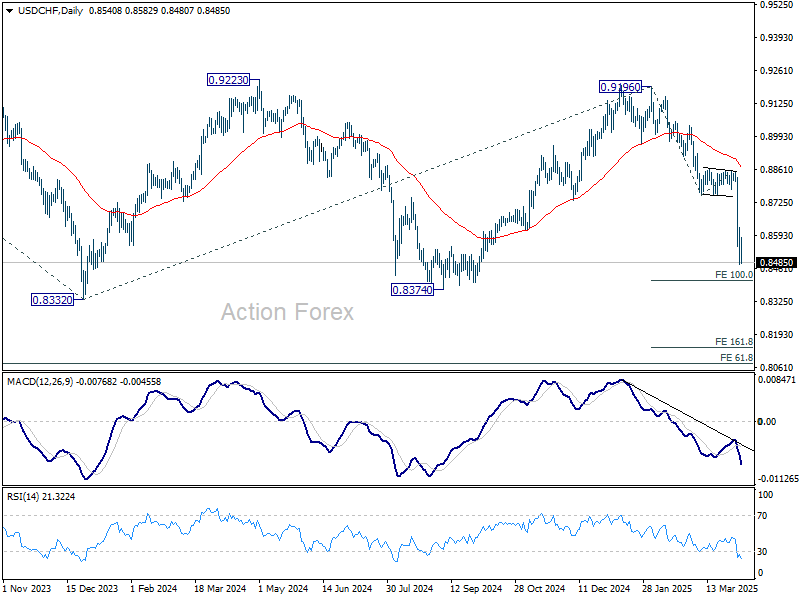
Intraday bias in USD/CHF remains neutral for consolidation above 0.8475 temporary low. Upside of recovery should be limited below 0.8757 support turned resistance. On the downside, below 0.8475 will resume the fall from 0.9196 and target 100% projection of 0.9196 to 0.8757 from 0.8854 at 0.8415.
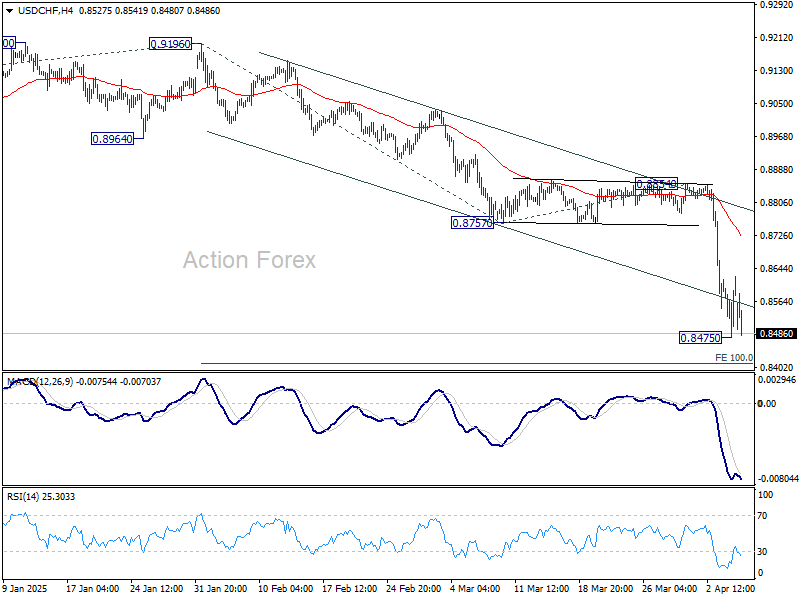
In the bigger picture, rejection by 0.9223 key resistance keep medium term outlook bearish. That is, larger fall from 1.0342 (2017 high) is not completed yet. Firm break of 0.8332 (2023 low) will confirm down trend resumption. Next target is 61.8% projection of 1.0146 (2022 high) to 0.8332 from 0.9196 at 0.8075.
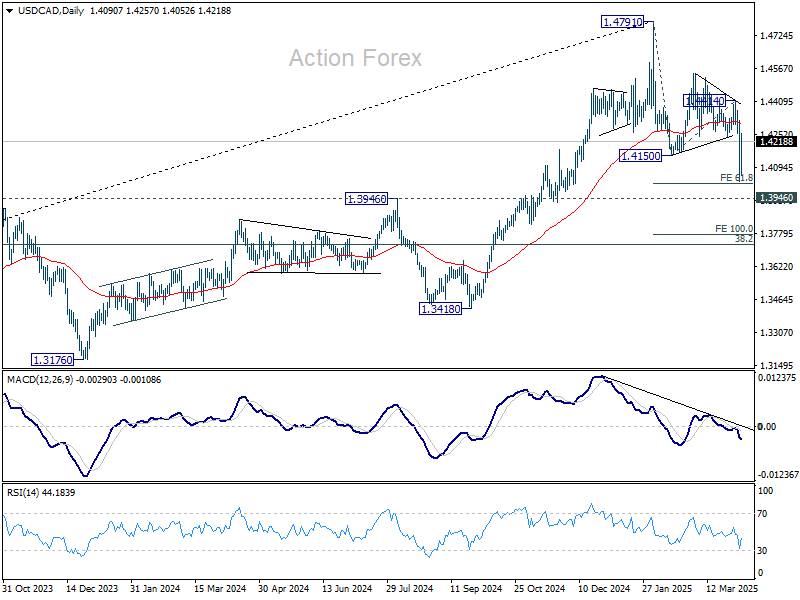
USD/CAD Daily Outlook
Daily Pivots: (S1) 1.4104; (P) 1.4181; (R1) 1.4309; More...
Intraday bias in USD/CAD remains neutral for the moment. On the upside, firm break of 1.4414 resistance will suggest that the decline from 1.4791 has completed as a three wave correction, and turn bias back to the upside for retesting 1.4791 high. However, firm break of 61.8% projection of 1.4791 to 1.4150 from 1.4414 at 1.4018, could prompt downside acceleration to 100% projection at 1.3773 next.
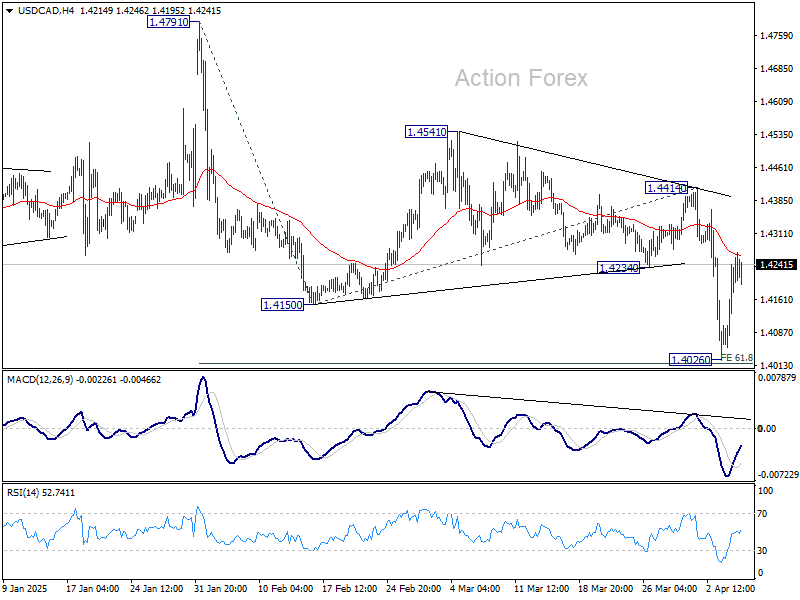
In the bigger picture, focus is now on 1.3976 resistance turned support (2022 high), which is close to 55 W EMA (now at 1.4001). Strong rebound from there will retain medium term bullishness. That is, up trend from 1.2005 is still in progress for breaking through 1.4791 at a later stage. However, sustained break there should confirm medium term topping at 1.4791. Deeper correction would be seen to 38.2% retracement of 1.2005 (2021 low) to 1.4791 at 1.3727.
Keep Calm and Buy Bonds (Not Financial Advice)
Last week marked the beginning of a historical market selloff. The selloff on Friday accelerated after China said that they would respond to the US tariffs with 34% tariff on American imports on their own. Europeans warned that ‘when elephants fight, grass trembles…’ to say that retaliation smells stronger than negotiation, right now. The European leaders meet today. Meanwhile, we saw a much better than expected NFP report on Friday – the nonfarm payrolls jumped nearly 230K last month, even government jobs increased by 19K, wages growth came in lower than expected but unemployment rose slightly. In all cases, the latter saw little reaction as Federal Reserve (Fed) President Jerome Powell said that the impact of tariffs on the US economy could be higher than expected, adding that there is no rush to cut rates. That was the last nail in the coffin.
The S&P500 lost 6%, bringing two-day losses to about 10%. The index is down by more than 17% since the February peak and has slipped below the major 38.2% Fibonacci retracement on the AI rally. Nasdaq 100 lost another 6% on Friday, as well. Accumulated losses since the February peak are already above 20% for the tech-heavy index. The Dow Jones is also in the bearish consolidation zone while the small and mid-caps that were supposed to be the best Trump trades are the most hit. They lost between 60 and 80% of the post-election gains already. Elsewhere, the CSI 300 is down by more than 6% despite the Chinese pledge to step in and ease the financial conditions significantly to support the economy, the Hang Seng is down more than 10%. Wherever we look this morning, it’s a bloodbath. The S&P500 is down by almost 4% at the time of writing, Nasdaq futures are down by more than 4%, same for the European futures and the week hasn’t even started yet. Even gold is no longer willing to play. The price of an ounce tanked around 2.50% on Friday and was lower this morning – though the ugly market selloff should keep gold appetite quite strong.
So, if you’re wondering where does the capital flow? It flows to into the government bonds – the US, the German, the Japanese, the Australian yields are all down on the growing expectation that the financial turmoil will soon bring the central banks back to cutting rates and to purchasing bonds to ensure stability... The US 2-year yield is down to 3.50% despite Powell’s message that there is no rush to cut rates. Investors know: if the selloff continues, the central banks will have no choice.
In the FX, the US dollar was better bid in the last hours of trading of last week, but the greenback is plunging again this morning against major peers. The Japanese yen and the Swiss franc are amassing the safe haven flows.
In energy, the barrel of US crude lost more than 6% last Friday and tipped a toe below the $60pb level this morning as Saudi cut its oil price to Asia to a four-month low on rising recession odds. The outlook remains comfortably negative with the possibility of a further fall toward the $50pb level. Price recoveries could be interesting top selling opportunities.
This week
The US will release its latest CPI update, and it’s expected to have eased on y early basis - except for monthly core inflation. But that doesn’t matter, really. The Fed’s gotta do what it’s gotta do to fix the situation before it can fix inflation — probably. So this week’s inflation report will likely go unheard.
More interestingly, the US earnings season kicks off this week with the big banks due announce Q1 earnings. TSMC will also report its March sales on Thursday. Attention will be on companies’ forecasts regarding the tariff chaos, and how bad they see the future with heavily disrupted global supply chains. 64% of the S&P500 companies have already downgraded their earnings projections – that’s a good thing as it means that a part of the damage is already priced. But with nearly 70% of the US GDP coming from spending, it will be hard for companies to do fine with massive tariffs.
All this being said, I believe we will be seeing incredible buying opportunities in a few weeks. Keep calm and don’t forget that markets always bounce back.
Week Enters With Increasing Fears of Recession
In focus today
In the euro area, focus turns to the Sentix investor confidence indicator for April and retail sales for February. Investor confidence rose sharply in March on the back of the German spending package. Following Trump's "Liberation Day" sentiment is expected to take a hit, although it might not be fully reflected in this month's data. Retail sales have been declining over the past couple of months, aligning with falling consumer confidence after a strong rebound in the second half of last year. Despite favourable conditions for increased consumption, such as a robust labour market, rising real wages, and lower interest rates, geopolitical uncertainty is likely dampening current consumer sentiment.
In Sweden, the Debt Office publishes the outcome for central government debt in March. This year the deviation stands at SEK 4.7bn, indicating a higher net loan requirement than planned. At the same time, deviations are minor compared to potential future changes - such as defence investments. For further insights.
Throughout the week, the spotlight remains on the trade war, with potential deals or retaliation plans under scrutiny. The EU is expected to unveil a retaliation proposal on Monday, with a vote scheduled for Wednesday. Moreover, a series of CPI data will be released, culminating in the US CPI on Thursday, following February's reassuring figures. The week concludes with Friday's Michigan consumer sentiment report, where inflation expectations will be pivotal.
Economic and market news
What happened overnight
In the equity and commodities space, White House officials showed no sign of retreating from their tariff plans, leading to a S&P 500 futures drop of over 3%, as recession fears intensified. Fed Funds futures now discount a 50% probability of a 25bp rate cut in May. The dovish turn saw US Treasury yields continue to rally and oil prices slid around 3% to its weakest since 2021, with Brent spot trading in the USD 63-64/barrel range this morning.
What happened Friday and over the weekend
In the US, the Friday's Jobs Report for March revealed a much higher-than expected rise in NFP of 228k. However, revisions shaved off 48k from the previous months, the participation rate rose from 62.4% to 62.5% and the unemployment rate edged slightly up from 4.1% to 4.2%. These elements added some dovish flavours to the hawkish jobs figures. Markets will look for signs of the trade war escalation feeding through to the most exposed sectors (manufacturing, retail, transportation) in the coming months. Recession fears continue to support expectations of a more dovish Fed, with a May cut of 25bp now discounted by a 50% probability in markets. Near-term uncertainty remains high, but the case for a sustainably stronger USD has weakened, potentially shifting long-term EUR/USD driving forces. We now adjust our EUR/USD forecasts, targeting 1.14 in 6M and 12M.
Following the jobs report, Fed Chair Powell on Friday stressed the Fed's commitment to maintaining anchored inflation expectations amidst ongoing market volatility, while cautioning that it was still too soon to determine the appropriate response from the central bank and that the Fed is not in a hurry yet.
In Sweden, the flash inflation data for March surprised to the downside. The CPIF and CPIF excl. Energy came in at 2.3% y/y (cons: 2.8%) and 3.0% y/y (cons: 3.2%), respectively. CPI came in at 0.5% y/y (cons: 0.7%). On Friday, we will receive further inflation details, which will be important for understanding future price developments. We expect the y/y figures to be above target throughout 2025 due to basket effects observed in January, complicating policy decisions for the Riksbank amidst a weak recovery - further challenged by tariffs - potentially justifying further rate cuts.
In China, 34% retaliatory tariffs were announced on Friday, effective 10 April, in response to Trump's 'Liberation Day' tariffs. This move, coupled with restrictions on rare earth mineral exports and an antimonopoly probe into Dupont, marks China's toughest response yet in the ongoing trade wars. China's actions signal its readiness to confront U.S. pressures, while risks of further escalation loom. For more insights, see Research China: Trump's tariff hammer to hit Chinese growth, stocks and CNY lower, 3 April.
Equities: Equities were in free fall for a second day. Losses worsened in the US session, bringing S&P 500 -6% lower in one single day. That is -17% off its February high. If you get flashbacks from March 2020 that is warranted, as it is the worst two-day-period since then. What is striking is that the selloff is still so broad-based: European, US and Nordic equity indices were all down 8-9% for the week. Investors find themselves in the hands of Trump and as no one knows how far he will go investors are running better safe than sorry and selling risk in general. Hence, this is not a selective rotation story yet, but outright derisking. On Friday, it was value cyclicals' turn to take the hit. Banks sold off massively on lower yields, while energy was hit from a double whammy of lower growth expectations and OPEC raising production. Lower rates did not bail the "Mag" 7 names from the selloff this time, but homebuilders and real estate were relative outperformers. One could also note returning risk appetite in bitcoin, up 3%.
Risk-off taken to new extremes this morning with a circuit breaker briefly suspending Japanese trading this morning due to too large sell orders. Asian markets are selling off massively with Hang Seng and Taiwan down 10-12% in a rude awakening after holidays on Friday. Derisking continuing in Western markets are well with US and European futures plunging 3-4% this morning.
FI&FX: The broad dollar index DXY regained some terrain following Friday's stronger-than-expected March jobs report and Powell's comment that the Fed not being in a hurry to cut rates. Risk sentiment continued deteriorating with S&P 500 dropping 6% throughout the session, adding to the now cumulative 17.5% drawdown in the index since mid-February. UST yields moved some 3-4bp lower across the curve, but markets continue to price just 13bp of rate cuts for the May FOMC meeting. Friday featured yet another big drop in Schatz yields (-13bp), while the Bund yield dropped 7bp. ECB is now priced to deliver an additional 75bp of cuts this year. EUR/USD fell 0.8% to 1.096, back below the 1.10 mark, while EUR/NOK and EUR/SEK rose 2.5-3.0%. The oil price (Brent) declined 6% and has lost another 3% this morning to a new 4-year low of USD 63.75/bbl. Overnight, Chinese equities have reacted to the retaliation measures announced on Friday, dropping between 6-10% across indices, US equity futures are down 2-3% and haven currencies (JPY, CHF) are bid.
AUD/USD Daily Report
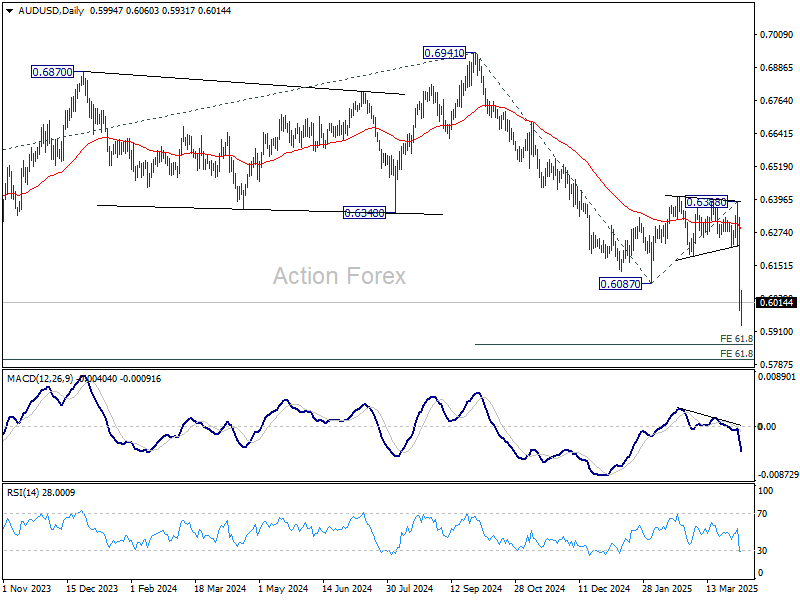
Daily Pivots: (S1) 0.5907; (P) 0.6120; (R1) 0.6252; More...
Intraday bias in AUD/USD stays on the downside for the moment. Current fall from 0.6941 should target 61.8% projection of 0.6941 to 0.6087 from 0.6388 at 0.5860. On the upside, above 0.6062 minor resistance will turn intraday bias neutral and bring consolidations first.
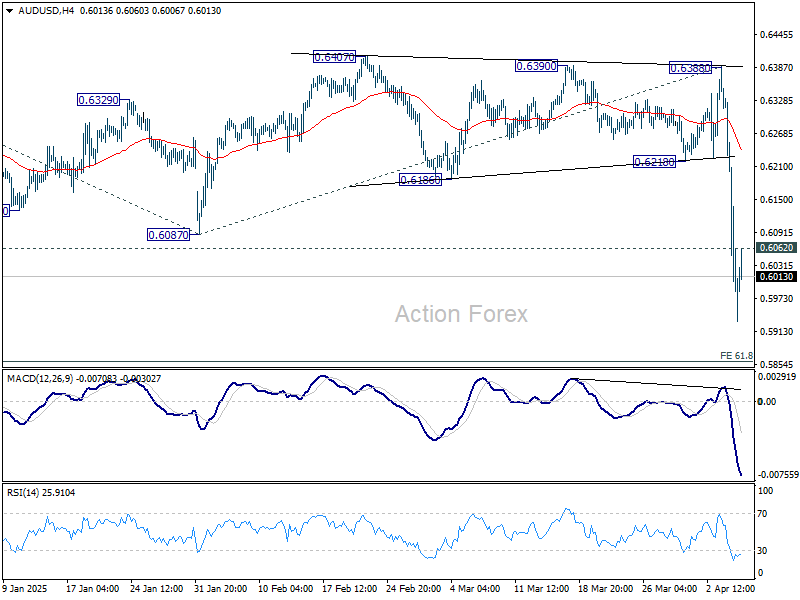
In the bigger picture, fall from 0.6941 (2024 high) is seen as part of the down trend from 0.8006 (2021 high). Next medium term target is 61.8% projection of 0.8006 to 0.6169 from 0.6941 at 0.5806. In any case, outlook will stay bearish as long as 0.6388 resistance holds.