
Sample Category Title
USD/JPY Daily Outlook
Daily Pivots: (S1) 144.41; (P) 146.86; (R1) 148.53; More...
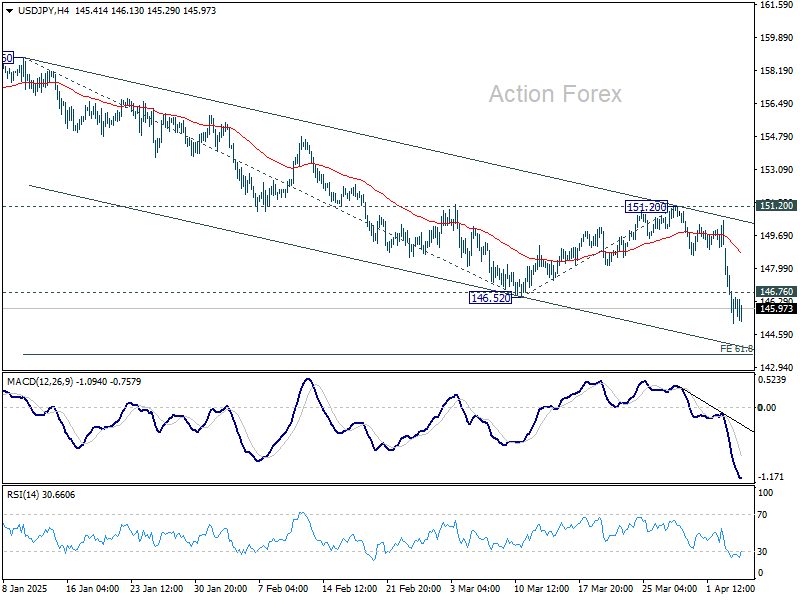
Intraday bias in USD/JPY remains on the downside for the moment. Current fall from 158.86 is in progress for 61.8% projection of 158.86 to 146.52 from 151.20 at 143.57. On the upside, above 146.76 minor resistance will turn intraday bias neutral and bring consolidations first. But recovery should be limited below 151.20 resistance to bring another fall.
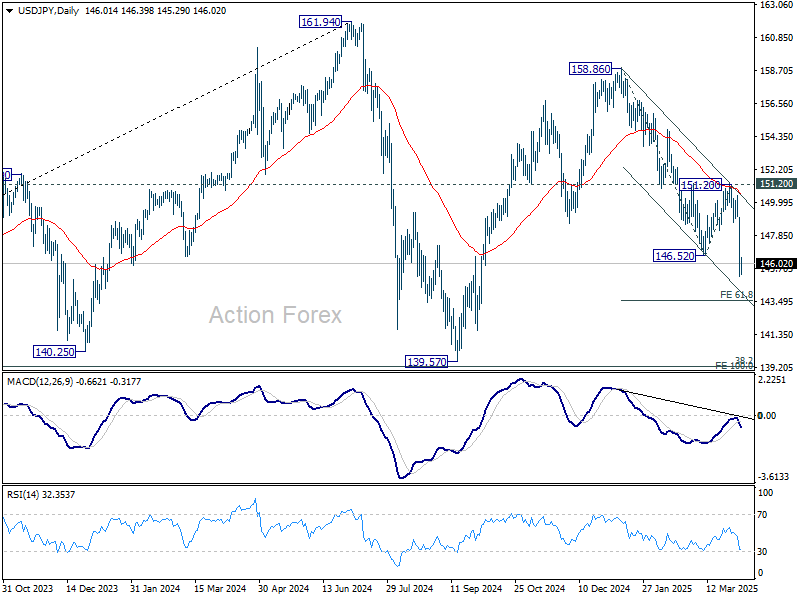
In the bigger picture, price actions from 161.94 are seen as a corrective pattern to rise from 102.58 (2021 low), with fall from 158.86 as the third leg. Strong support should be seen from 38.2% retracement of 102.58 to 161.94 at 139.26 to bring rebound. However, sustained break of 139.26 would open up deeper medium term decline to 61.8% retracement at 125.25.
US Dollar Fell Off a Cliff
Markets
Financial markets came crashing down yesterday in the aftermath of the Trump administration’s new trade policy. A shocking range of tariffs risks retaliatory measures and could plunge the world into an outright trade war. Recession fears spiked. Stock markets stood at the center of attention with losses in Europe mounting to >3.5%. Wall Street shed some 4% (Dow) to 6% (Nasdaq) in value. The technical picture deteriorated significantly in the likes of the S&P500 (-4.8%, losing the 5500 support area). The US yield curve bull steepened impressively. Front end yields tumbled around 17 bps while longer maturities, also supported by haven flows, dropped 3 bps (30-yr) to 10 bps (10-yr). German Bunds rallied in lockstep with yields easing between 3 (30-yr) to 9.5 bps (5-yr) on a net daily basis. Such front end outperformance stems from markets assuming central banks will come to the rescue with aggressive rate cuts but ignores the fact that the inflation context is completely different than what we’ve been used to prior to the pandemic. Such an initial kneejerk reaction is not abnormal though and could continue in the short run. US rates this morning drop another 4 bps across the curve. Money markets are currently pricing in more than four 25 bps rate cuts this year with a first one fully discounted for June. It’s against this backdrop that Fed chair Powell is to discuss the economic outlook later today. While the central bank has a dual mandate, their primary focus today is still inflation. We think it is way too early for Powell and the Fed to already shift to growth and as such validate current market pricing. It’s a matter of short-term inflation risks vs medium-term growth risks. The Fed still has some credibility to regain after grossly misjudging the post-pandemic CPI surge. It is also against this recessionary backdrop that the US payrolls report will be read. Any downside miss would fuel the fire and add volatility. We think a topside surprise is unlikely given, for example, the weak (employment) details from yesterday’s services ISM. Markets would dismiss it instantly anyway. The US dollar fell off a cliff. A growing recessionary risk premium is the go-to explanation but we suspect more fundamental de-dollarization dynamics are at play too. EUR/USD surged to an intraday high of 1.1144 before closing at 1.105. Ongoing dollar weakness this morning pushes the pair back towards the 1.11 lever though and remains on its way to 1.1214 (2024 high). DXY slid from 103.8 at Tuesday’s close to 101.7 currently. The Japanese yen is the one true safe haven that takes USD/JPY towards a six month low of 145.9. China was among the hardest hit by the US (up to 54%). Its currency dropped to USD/CNY 7.3 at the open before paring losses to 7.28.
News & Views
National Bank of Poland governor Glapinski made a surprise dovish U-turn in the presser one day after Wednesday’s rates status quo (5.75%). Until recently he advocated that no rate cuts should be expected anytime soon. However, yesterday he assessed that softer than expected Q1 inflation figures caused a radical shift the MPC’s outlook. Even as he still wants confirmation on recent softer inflation data, the NBP governor indicated that a first rate cut in May or in the following months is possible. Glapinski also said that that easing may exceed 100 bps this year if the government prevents energy prices from rising. The policy rate might be reduced further to 3.5% next year, in case inflation stays benign. He also indicated to favor one-off rate cuts rater than a series of steps. After even rising marginally on Wednesday, the Polish 2-y swap yield yesterday tumbled from 4.84% to 4.52%. The zloty fell off a cliff with EUR/PLN jumping from the 4.18 area before the press conference to close near 4.225.
Rating agency Fitch downgraded China by one notch to A from A+. The move came after the agency in April last year put the outlook off the country on negative. “The downgrade reflects our expectations of a continued weakening of China's public finances and a rapidly rising public debt trajectory during the country's economic transition.” The outlook is now again set at stable. Fitch expects that sustained fiscal stimulus will be deployed to support growth, amid subdued domestic demand, rising tariffs and deflationary pressures. In this context, Fitch sees “the government debt/GDP to continue its sharp upward trend over the next few years, driven by these high deficits, ongoing crystallisation of contingent liabilities and subdued nominal GDP growth.” The assessment was made before President Trump announced new tariffs on Wednesday, but analysts at the agency indicated that there is headroom at the current rating to accommodate the likely implications for economic growth and fiscal metrics from the tariffs.
Prisoner’s Dilemma
Yesterday saw the worst selloff since the pandemic. Equity markets gave a strong reaction to Trump’s tariff nonsense: the S&P500 lost almost 5% erasing around $2 trillion in market capital, Nasdaq 100 tanked 6% and the Dow Jones dumped 4%. Apple, Amazon, Nvidia, Microsoft, Tesla lost tens and for some hundreds of billions in market cap. Companies that have complex worldwide supply chains like Gap, H&M and Dell saw heavy losses, as well. Gap and Dell lost around 20% of their total market cap in a single session. These are not meme stocks, these are established companies. In Europe, the Stoxx 600 lost more than 2.5%, the Hang Seng index is down by around 1.50% this morning, Nikkei lost more than 17% since January, the treasury yields tanked across continents as investors moved money to safety, gold hit a fresh record, while the US dollar index lost around 1.70%.
The tariff chaos will likely help the euro end the week above the 1.10 mark and sterling above 1.30 against the US dollar. And gains could be sustainable as nations look willing to retaliate. The EU said there will be a strong response that could include measures against American tech giants and limitation on US investments and Canada imposed 25% levies on US-made vehicles. Bloomberg even suggests that the US treasuries are at risk of foreign buyer strike in tariff retaliation!
The global economy has now entered a dark tunnel. No one knows what’s next. For the Europeans, there is some kind of a consensus that the European Central Bank (ECB) would shift toward a more supportive stance than otherwise as long as inflation remains in check. The Swiss National Bank (SNB) is now expected to pull the rates down to 0% and even to the negative territory to – at least – counter the franc’s strength and help exporters with macroprudential measures. For the Federal Reserve (Fed) however, opinions diverge. Some think that the Fed will cut rates aggressively to slow economic slowdown, while others think that the Fed won’t cut at all this year due to rising inflation expectations. Activity on Fed funds futures give reason to the former - the probability of a June cut shot up to around 95% - but the Fed will be less restrictive in its response compared to GFC or pandemic due to inflation.
Pandemic-like supply chain disruption?
The risk of a heavy hit to global supply chains will require very strong reorganization that could take months and even years. As such, it’s not crazy to make parallels with the supply disruption of the pandemic to foresee what could happen next. And if we do that, the answer is clear: the inflation jump that we are about to see could not be ‘transitory’. The Fed could make the bet to cut rates despite heating inflation and to stabilize financial markets. But taming the strong downside revisions to earnings projections when the global supply chains are put under such pressure will be harder. The selloff could accelerate before rebound.
US jobs data doesn’t matter much
The US will reveal its latest jobs data today. On Wednesday, the ADP printed a better-than-expected figure. A consensus of analysts' estimates on Bloomberg suggests that the US economy may have added around 137K new nonfarm jobs last month. Either way, the US economy will soon start feeling the pain of tariffs – as manufacturing jobs won’t come to the US overnight – and the latter makes this week’s report totally uninteresting.
Crude Oil tanks on very bad combo
US crude dived 6% dive yesterday on the tumbling global growth and demand expectations combined with the OPEC+ decision to restore production more than expected. OPEC+ countries yesterday announced that they would bring 411K barrels a day to the market – the equivalent of three-monthly tranches from its previous output restoration plan. As such, the supply / demand fundamentals remain comfortably negative. Obviously, the tariffs will hit the global oil demand much less compared to the pandemic. Yet the upcoming slowdown in global economic activity reinforces the probability of a further slide toward the $50pb level.
DOGE-Driven Layoffs Set the Stage for US Jobs Report
In focus today
In the US, the March Jobs Report finishes off an eventful week. We think nonfarm payrolls growth slowed down to just 110k (from +151k) amid federal layoffs and sharply slowing immigration. The unemployment rate could edge slightly higher to 4.2% although we think tighter labour supply growth will constrain the rate from rising significantly. Average hourly earnings growth likely remained steady at +0.3% m/m SA.
In Sweden, the flash inflation data for March is released (CET 08:00). We expect another substantial increase in food prices, which will elevate underlying inflation, CPIF excluding energy, to 3.2% year-on-year (Feb. 3.0%) according to our forecast. This is slightly higher than the Riksbank's forecast of 3.1%. The high readings complicate policy making for the Riksbank given that the weak recovery, which met another headwind by the tariffs, would justify further rate cuts, in our view.
Economic and market news
What happened yesterday
In the US, ISM services surprised to the downside for March, declining sharply to 50.8 (cons. 53) from 53.5 in February. In contrast to its PMI counterpart released earlier, which pointed to a more positive outlook, this ISM reading showed the softest expansion in the services sector since June last year. The March Challenger Report on layoff announcements showed 275k job cuts in March, a significant increase from 172k in February and the highest value since May 2020. With the government leading all sectors in job cuts, this reading to a large degree reflects the impact of the DOGE plans to eliminate positions in the federal government.
In the euro area, services PMI for March was revised up to 51.0 from 50.4 in the flash release. This is positive news since the services sector is the largest part of the economy, accounting for 74% of GDP. In isolation the final March PMI report supports the hawk camp in the ECB calling for a pause in April. Yet, declining inflation and recent tariff announcements should tip the balance towards a cut in April given downside risks to growth and inflation almost at target.
In Sweden, composite PMI has decreased to 50.6%, primarily due to a drop in the Services PMI, which fell to 49.4 from a revised 50.5 in February. This marks the first contraction of the year and the lowest level since September. All areas of the index declined, with employment - which is for 20% of the Services PMI - remaining below 50 for the eighth consecutive month. The strong performance of the Manufacturing PMI earlier this week is helping sustain the composite index level.
In Norway, housing prices rose 0.1 % m/m (SA) in March, confirming signals of a cooler market after rate cut expectations and some easing of regulation lifted prices towards the end of last year and into 2025. This is weaker than Norges Bank (NB) assumed in the latest MPR at 0.7 % m/m. However, NB has repeatedly stressed that stronger nominal housing prices is first and foremost a correction in real prices back to the 2022-level, and that credit growth remains muted and below income growth. Hence, the figures will not affect monetary policy in the coming months.
Equities: Global equities experienced a severe downturn yesterday, likely for reasons familiar to everyone. A closer examination reveals significant outperformance by defensive sectors compared to cyclicals. While this is not entirely surprising, the fact that markets declined so heavily yet utilities and consumer staples rose was admittedly unexpected. The US markets were hit hardest, which makes a lot of sense given that US consumers are most affected by this situation. The US is also facing the largest revisions to its growth outlook following the implementation of the new US tariff regime. With both uncertainty and recession risk significantly heightened following "liberation day", it is unsurprising to see the VIX spike to a level of 30.
Whether discussing the direction for equities, cyclicals versus defensives, or the level of volatility and implied volatility, it would, in our opinion, look very different without the current political environment in the US. It is quite rare to witness a correction (a drop of more than 10%) in global equities under the current macroeconomic conditions. However, that is the reality with Trump as the US president, and one must act accordingly. In the US yesterday, the Dow was down 4.0%, the S&P 500 fell 4.8%, the Nasdaq declined 6.0%, and the Russell 2000 dropped 6.6%. Asian markets continue to trend lower this morning, and the same is true for futures in Europe and the US.
FI&FX: The dollar index DXY experienced its second biggest loss in one day since the GFC, Nasdaq slumped 6.0% (third biggest one-day loss since GFC) while the broader S&P 500 was down 4.8%. Nikkei -3.6% and equity futures are in red. Treasuries rallied massively lead by the short end of the curve as 2Y is down 30bp since Tuesday's peak. Bullish steepening characterized fixed income across regions. EUR/USD jumped three figures to trade close to 1.11 this morning, USD/JPY dropped from 150 to 146. CHF alongside JPY are the two natural outperformers. SEK initially had a strong day, although gains were erased in the US session. NOK sold off throughout the day as the oil price dropped below USD 70. A sharp selloff of the zloty on quite a remarkable dovish shift from the NBP.
USD/CHF Daily Outlook
Daily Pivots: (S1) 0.8483; (P) 0.8658; (R1) 0.8769; More…
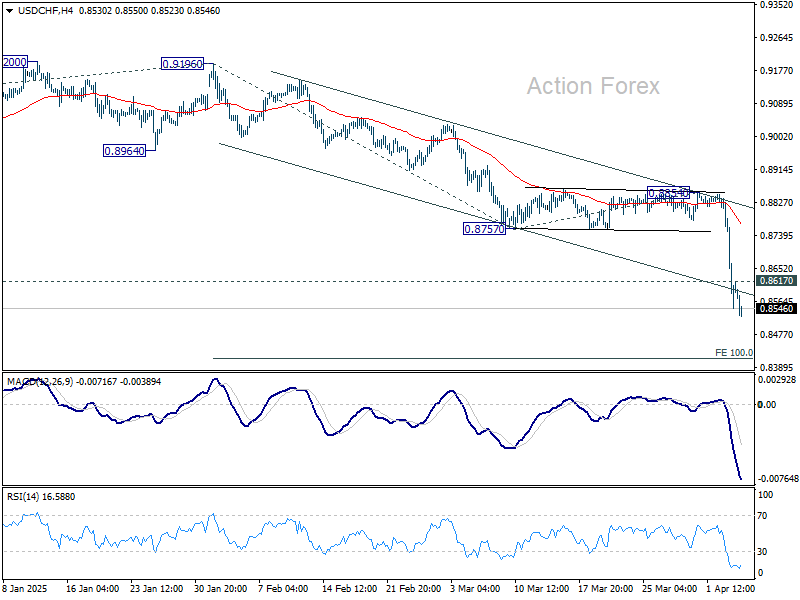
USD/CHF's steep decline is still in progress and there is no sign of bottoming yet. Intraday bias stays on the downside for 100% projection of 0.9196 to 0.8757 from 0.8854 at 0.8415. On upside, above 0.8617 minor resistance will turn intraday bias neutral and bring consolidations. But recover should be limited below 0.8757 support turned resistance to bring another fall.
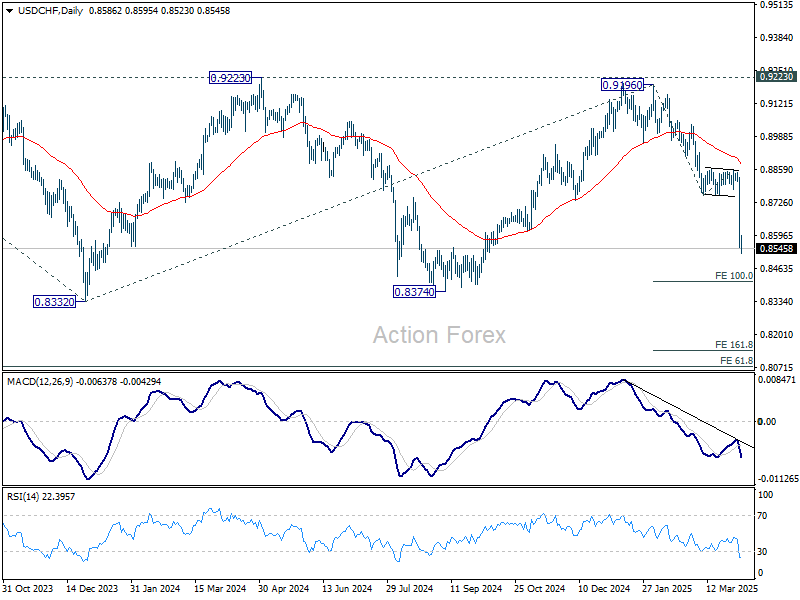
In the bigger picture, rejection by 0.9223 key resistance keep medium term outlook bearish. That is, larger fall from 1.0342 (2017 high) is not completed yet. Firm break of 0.8332 (2023 low) will confirm down trend resumption. Next target is 61.8% projection of 1.0146 (2022 high) to 0.8332 from 0.9196 at 0.8075.
Global Market Rout Deepens Ahead of US Jobs Data
There’s no relief in sight for the markets as risk aversion extends into Friday’s Asian session. Japan’s Nikkei is leading the losses once again, falling over -3% and cementing a near 10% weekly drop — the worst performance since early 2020. Singapore’s Strait Times Index has finally caught up with the global rout, slumping nearly -3% as traders there digest the full extent of the tariff-driven global selloff. Meanwhile, Hong Kong and China markets are taking a breather, closed for the Ching Ming Festival holiday. But the pause might only delay—not prevent—the contagion, as sentiment across asset continues to sour.
US futures point to more pain ahead, with DOW at risk of closing below the psychological 40k psychological level this week. Markets appear unconvinced that a bottom is in sight, especially with geopolitical uncertainty and trade war escalation clouding the outlook. One of the clearest signs of deepening concern is the move in US Treasury yields. 10-year yield has broken below the critical 4% psychological support during Asian session, for the first time in six months. A weekly close below 4% could mark a seismic shift in sentiment, likely reinforcing safe-haven flows and risk aversion even further.
Today’s U.S. non-farm payrolls report is the marquee event, but its interpretation is unlikely to offer a clear rescue narrative. A strong report won’t necessarily be bullish, as markets are more focused on looming global trade frictions than short-term economic strength. Conversely, a weak NFP print might push Fed rate cut expectations higher, but would also reinforce fears that the economy is already sliding into a downturn. In short, there’s little in this data that could provide comfort in the current climate.
In currencies, despite the steep selloff, Dollar is not the weakest performer this week. That spot goes to the Aussie, followed by the greenback and Kiwi. At the other end, the new safe-haven trio of Swiss Franc, Japanese Yen, and Euro are leading the pack. Sterling and Loonie sit in the middle of the spectrum.
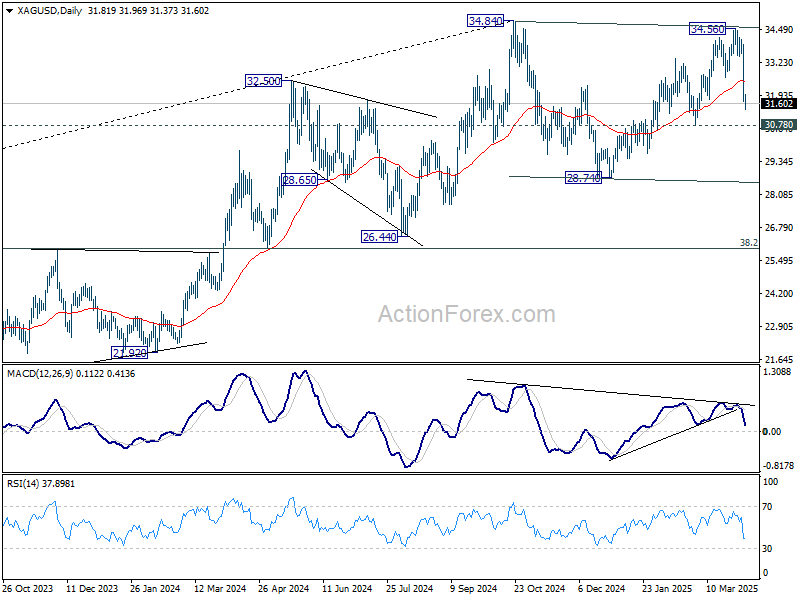
Technically, Silver's steep decline yesterday indicates that rise from 28.74 has already completed at 34.56, after rejection by 34.84 key resistance. Fall from 34.56 is now seen as the third leg of the corrective pattern from 34.84. Deeper fall should be seen to 30.78 support first. Firm break there will target 28.74 support, and possibly below.
In Asia, at the time of writing, Nikkei is down -3.07%. Japan 10-year JGB yield is down -0.147 at 1.204. Singapore Strait Times is down -2.69%. Hong Kong and China are on holiday. Overnight, DOW fell -3.98%. S&P 500 fell -4.84%. NASDAQ fell -5.97%. 10-year yield fell -0.141 to 4.055.
NFP unlikely to offer relief, miss could cement Q2 fed cut
Today’s US non-farm payrolls report comes as the markets are already reeling from this week’s tariff shock. With consensus expecting a 128k rise in jobs for March and the unemployment rate holding steady at 4.1%, the print itself may not do much to lift sentiment or Dollar, even if it exceeds expectations.
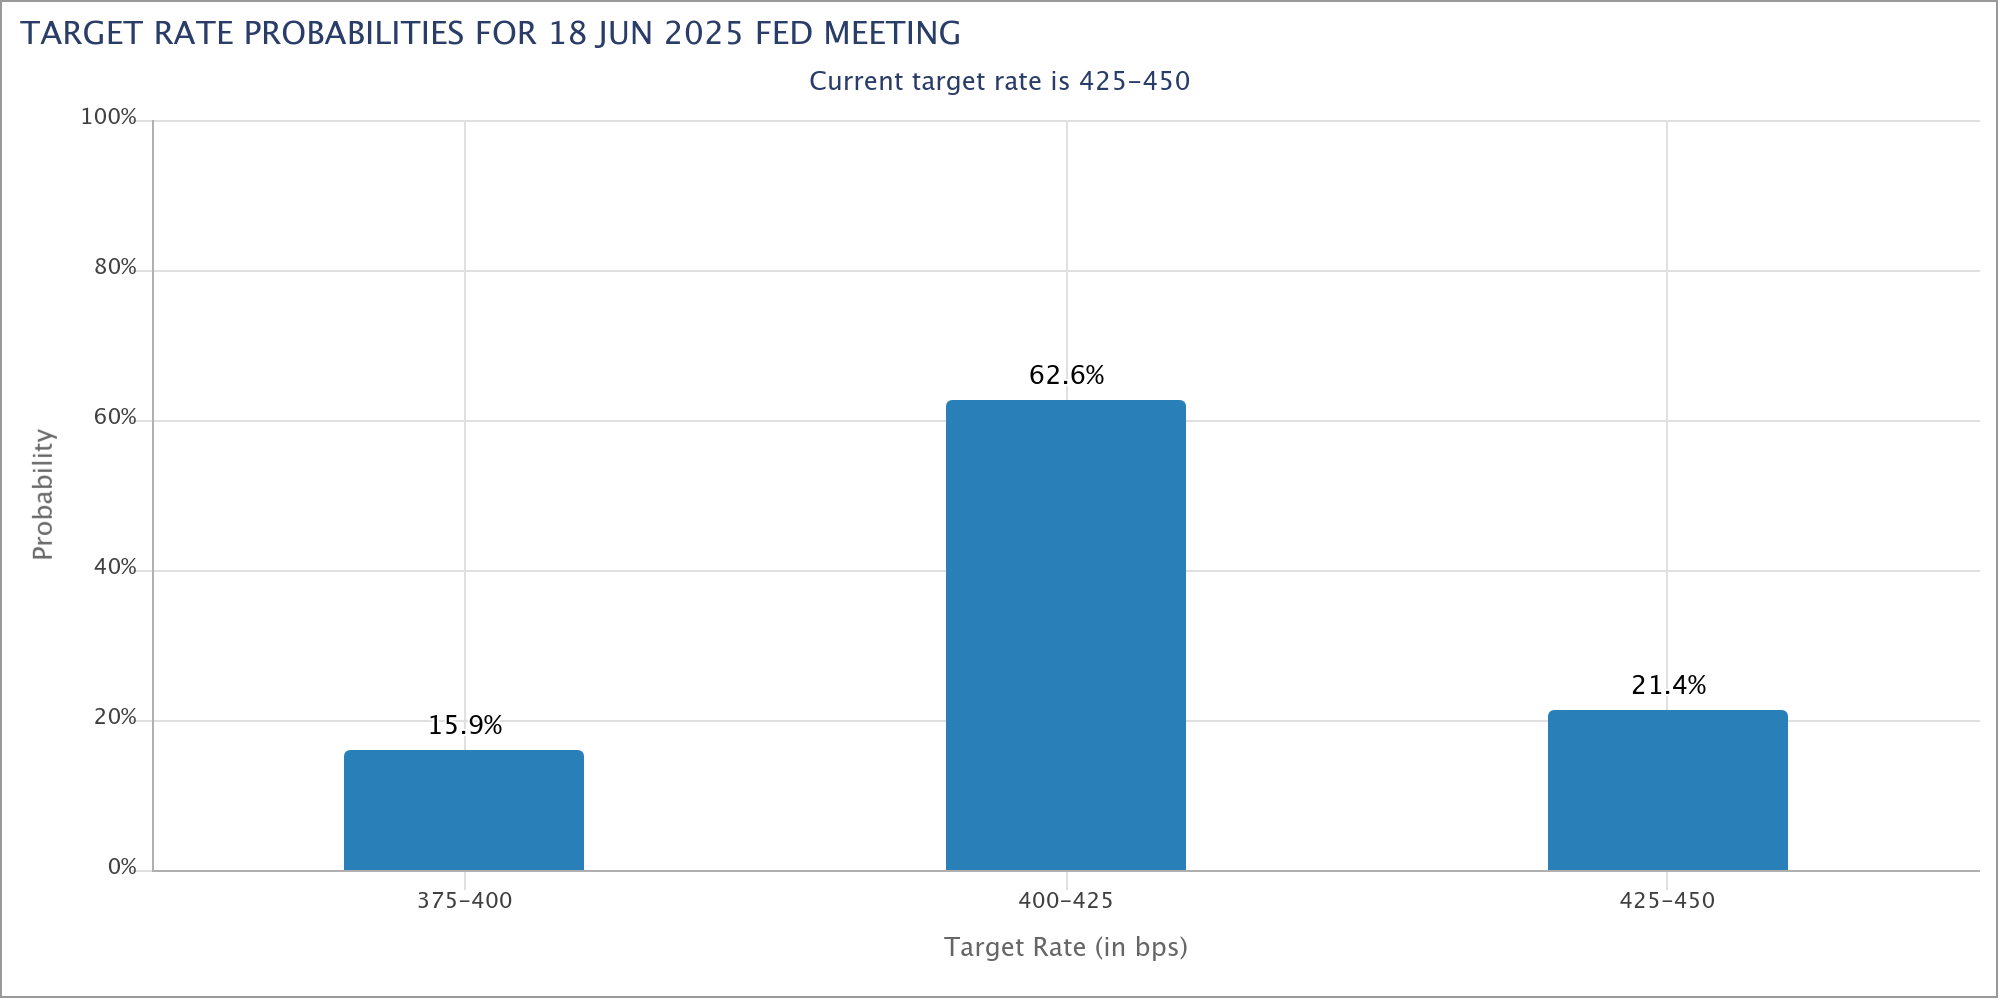
On the other hand, a downside surprise could further shift the odds in favor of a Fed rate cut in Q2. Currently, fed funds futures suggest nearly an 80% probability of a 25bps reduction in June.
While Fed has signaled patience, deteriorating jobs data may leave policymakers with little choice but to move sooner rather than later. Such development would in turn apply further pressure on Dollar.
Recent data paints a murky picture: the employment components in both ISM manufacturing (44.7) and services (46.2) surveys fell deep into contraction in March. ADP report came in at a modest 155k growth.
Whether today's NFP captures the full extent of that weakness as indicated by ISM data remains to be seen, but the underlying trend is clearly deteriorating.
Fed’s Jefferson: Important to take time and think carefully amid sweeping policy shifts
Fed Vice Chair Philip Jefferson reiterated in a speech overnight that there is "no need to be in a hurry" to adjust policy further. Current policy settings are appropriately positioned amid a period of sweeping changes in trade, immigration, fiscal, and regulatory policies.
He stressed the importance of assessing the "cumulative effect" of these evolving policies before making any shifts in the monetary path.
Commenting on the new of import tariffs announced this week after the formal remarks, Jefferson acknowledged the heightened uncertainty such measures introduce, adding that they could weigh on household sentiment and business investment.
In this environment, Jefferson said it is important to “take our time and think carefully” as it evaluates the broader economic impact.
Fed’s Cook: Risks tilt toward high inflation and slower growth
Fed Governor Lisa Cook highlighted in a speech overnight that her baseline forecast sees the US economy will "slow moderately" this year, with a slight uptick in unemployment. Also, inflation progress will "stall in the near term", because of tariffs and other policy changes.
Cook acknowledged the potential for a more optimistic scenario in which new policies prove minimally disruptive and consumer demand holds up, allowing for stronger-than-expected growth.
However, she placed "more weight on scenarios where risks are skewed to the upside for inflation and to the downside for growth".
Given the elevated risks and uncertainty, Cook supports the case to keep interest rates unchanged for now. With both sides of the Fed’s dual mandate facing uncertainty and risks, she stressed that policymakers must remain "patient but attentive".
BoJ's Ueda: US tariffs likely to pressure Japan’s economy
BoJ Governor Kazuo Ueda warned that the 24% tariffs imposed by the US on Japanese goods could have broad implications. He emphasized that heightened uncertainty over the economic outlook may weigh on corporate sentiment and trigger volatile market behavior. This, in turn, could place "downward pressure on global and Japanese economies".
Meanwhile, Ueda noted that the effect on inflation remains uncertain, as the tariffs could either suppress prices by weakening demand or push them higher through supply chain disruptions.
Despite these concerns, Ueda maintained a cautiously optimistic view on Japan’s economy. He pointed out that corporate sentiment remains positive, and capital expenditure plans are stronger than in the same period of prior years.
He referred to the latest Tankan survey as supportive of BoJ's baseline view that Japan’s economy is "recovering moderately". Still, Ueda noted that the survey, conducted from late February to March 31, may not have fully captured the impact of the US tariff announcements.
BoJ Deputy Governor Shinichi Uchida, also speaking at the session, reiterated that the central bank remains committed to adjusting rates if the likelihood of achieving its 2% inflation target increases.
Uchida emphasized that future policy decisions will be made on a meeting-by-meeting basis, based on updated forecasts, "without any preconception".
USD/CHF Daily Outlook
Daily Pivots: (S1) 0.8483; (P) 0.8658; (R1) 0.8769; More…
USD/CHF's steep decline is still in progress and there is no sign of bottoming yet. Intraday bias stays on the downside for 100% projection of 0.9196 to 0.8757 from 0.8854 at 0.8415. On upside, above 0.8617 minor resistance will turn intraday bias neutral and bring consolidations. But recover should be limited below 0.8757 support turned resistance to bring another fall.
In the bigger picture, rejection by 0.9223 key resistance keep medium term outlook bearish. That is, larger fall from 1.0342 (2017 high) is not completed yet. Firm break of 0.8332 (2023 low) will confirm down trend resumption. Next target is 61.8% projection of 1.0146 (2022 high) to 0.8332 from 0.9196 at 0.8075.
NFP unlikely to offer relief, miss could cement Q2 Fed cut
Today’s US non-farm payrolls report comes as the markets are already reeling from this week’s tariff shock. With consensus expecting a 128k rise in jobs for March and the unemployment rate holding steady at 4.1%, the print itself may not do much to lift sentiment or Dollar, even if it exceeds expectations.
On the other hand, a downside surprise could further shift the odds in favor of a Fed rate cut in Q2. Currently, fed funds futures suggest nearly an 80% probability of a 25bps reduction in June.
While Fed has signaled patience, deteriorating jobs data may leave policymakers with little choice but to move sooner rather than later. Such development would in turn apply further pressure on Dollar.
Recent data paints a murky picture: the employment components in both ISM manufacturing (44.7) and services (46.2) surveys fell deep into contraction in March. ADP report came in at a modest 155k growth.
Whether today's NFP captures the full extent of that weakness as indicated by ISM data remains to be seen, but the underlying trend is clearly deteriorating.
Cliff Notes: Tariff Trauma
Key insights from the week that was.
Starting in Australia, it was unsurprising to see the RBA Monetary Policy Board leave the cash rate unchanged at 4.10%. The decision statement was little changed from February given the relatively quiet and well behaved data flow. In the subsequent press conference, Governor Bullock once again noted that the Board still does not “endorse” the market path for future cash rate reductions.
Post-meeting communications were centred on the considerable two-sided risks at hand. On consumption, the Board notes “there is a risk that any pick-up… is slower than expected” which softer growth in retail sales in February gives credence to – our take on the broader household spending indicator will be released later today on Westpac IQ. However, the Board also stated that “labour market outcomes may prove stronger than expected”, a risk highlighted by the latest job vacancies data which shows that the labour market remains relatively tight. “Uncertainty about the outlook abroad” was certainly seen in the latest trade data, even though it pre-dates this week’s developments.
Given the highly uncertain backdrop and competing risks, the Board will remain focused on actual inflation outcomes. Our Q1 CPI preview provides more detail behind our forecast for trimmed mean inflation to move back into the target band on an annual basis (2.8%), and below the mid-point on a six-month annualised basis (2.3%). If inflation prints as we expect, we are confident that the RBA Board will deliver another 25bp rate cut in May.
Before moving offshore, a final note on housing. The post rate cut bounce in dwelling prices looks to have extended into March, up 0.4% following a 0.3% gain in February. While we still expect momentum to remain positive this year, we doubt there is much scope for the current pace to strengthen further. Longer-term prospects depend critically on the outlook for supply; the latest data dwelling approvals is mildly constructive on this front, having risen 26% over the past year, though this is still well short of the required pace to reach the Housing Accord target.
Offshore, the focus remained on US tariffs all week. On April 2, “Liberation Day”, US President Donald Trump announced the immediate implementation of reciprocal tariffs. While Trump described these rates as being based on the US' country-by-country estimates of monetary and non-monetary barriers US firms face in other countries, economists were quick to calculate the tariffs are half of each nation’s trade surplus with the US divided by total imports to the US. For China and Taiwan, it will be 34% and 32%; for India 26%; for Europe 20%; and for the UK, Australia and New Zealand, 10% – the lowest possible rate, regardless of if a country imposes any barriers to US firms or not.
While of limited significance for global growth, small developing markets will be particularly hard hit; Cambodia as an example faces a 49% tariff rate. It is expected that these tariffs will boost revenues and entice manufacturing investment in the US, but the cost of doing so and immense uncertainty over the policy outlook is likely to hold many firms back.
In response to these tariffs, ECB member Nagel said the ECB needs to "reassess" the current situation, with "the US administration’s decision to impose tariffs endanger[ing] global economic stability." The European Commission President von der Leyen noted that that the EU is "prepared to respond" to US tariffs, "already finalising a first package of countermeasures in response to tariffs on steel…[and] now preparing for further countermeasures". China is also likely to respond swiftly – the response and counter-response by the US likely to prove a key theme next week.
We remain of the view that the US is most at risk from its own measures. Early signs of weakness in their economy can already be seen. The ISM manufacturing PMI index dropped 1.3pt to 49.0. The detail of the survey highlighted a rapid adjustment to demand, the new orders index falling 3.4pt to 45.2, the lowest level in almost two years, almost 10pts below January’s level. Companies also reported declining production volumes, falling headcount and rising inventories.
On the services side, the headline index declined from 53.5 to 50.8 in March. Business activity edged higher in the month, from 54.4 to 55.9; but new orders declined, from 52.2 to 50.4, and the backlog of orders were worked through aggressively, this index declining from 51.7 to 47.4. The decline in the employment index was most notable however, from 53.9 to 46.2. At face value, this result and that of the manufacturing sector points to outright declines in employment in coming months.
Tonight, the March employment report will be closely scrutinised. To date, it has been sentiment that has held back spending. If the labour market deteriorates, the US could find itself struggling through a persistent period of contraction, bearing in mind that the Atlanta Federal Reserve’s nowcast of GDP suggests activity declined 2.8% annualised in Q1, albeit largely as a result of a pull-forward of imports to get ahead of the impending tariffs.
Ending on a positive note, China and Asia have considerable capacity to offset the negative consequences of US trade policy in the short term through stimulus and by enticing private investment related to the region’s ongoing economic development. Into the medium-term, continued growth in the region’s population, industry and household incomes will deepen exposed nations’ export markets, reducing the significance of the US market to the world. Australia is well positioned to benefit from this growth and economic development.
USD/JPY Takes a Hit—Will Bears Extend Their Grip?
Key Highlights
- USD/JPY started a major decline from the 150.50 resistance zone.
- It traded below a key bullish trend line with support at 149.20 on the 4-hour chart.
- EUR/USD surged above the 1.1000 resistance zone.
- Gold prices corrected gains and traded below the $3,100 level.
USD/JPY Technical Analysis
The US Dollar faced a strong rejection near 150.50 against the Japanese Yen. USD/JPY started a major decline below the 149.50 and 148.80 levels.
Looking at the 4-hour chart, the pair settled below the 148.50 level, the 100 simple moving average (red, 4-hour), and the 200 simple moving average (green, 4-hour). It traded below a key bullish trend line with support at 149.20.
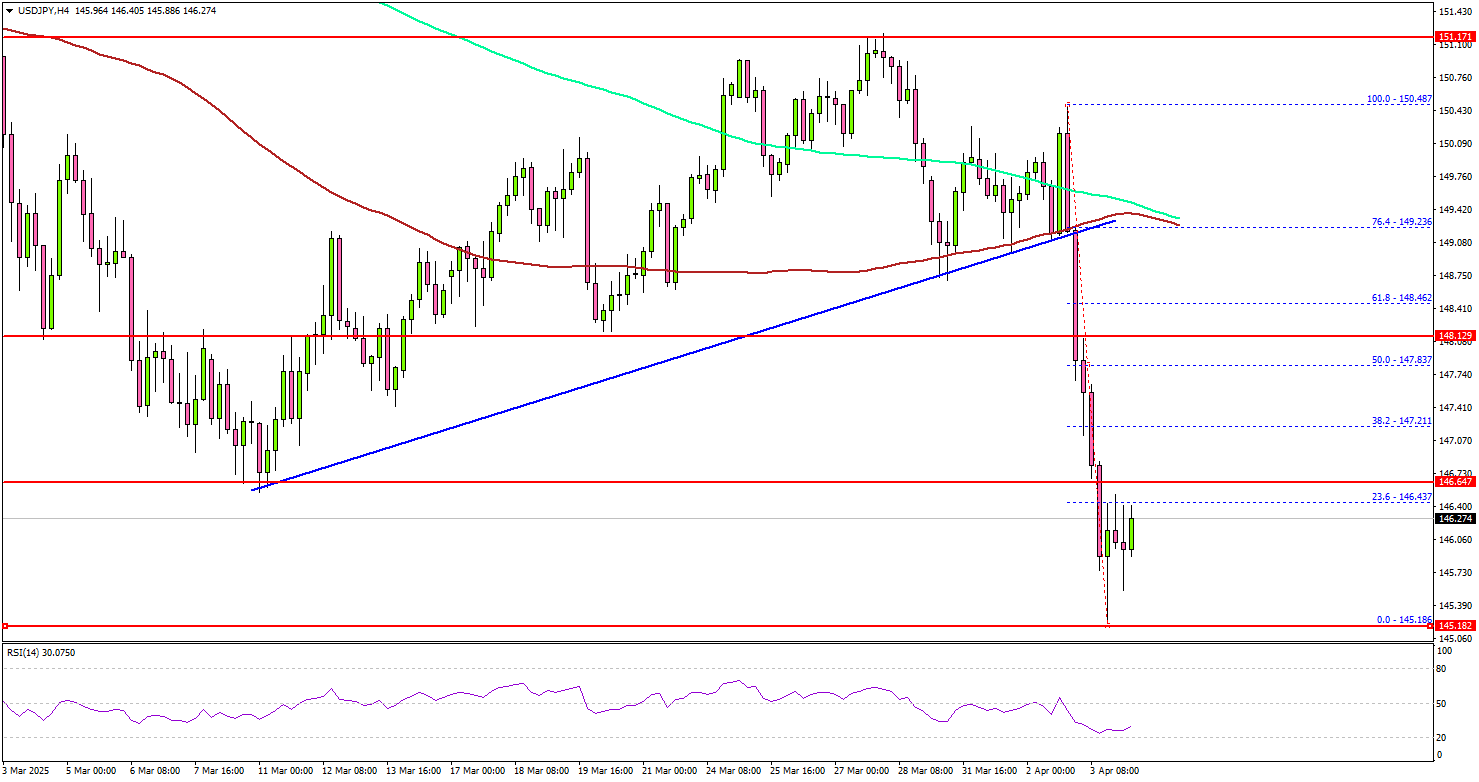
The pair even tested the 145.50 support. If there is a recovery wave, the pair could face resistance near the 146.65 level. The next major resistance is near the 147.20 level.
The main resistance is now forming near the 148.00 zone. A close above the 148.00 level could set the tone for another increase. In the stated case, the pair could even clear the 148.50 resistance.
On the downside, immediate support sits near the 145.50 level. The next key support sits near the 145.00 level. Any more losses could send the pair toward the 144.20 level.
Looking at Gold, the price started a sharp downside correction and there was a clear move below the $3,100 level.
Upcoming Economic Events:
- US nonfarm payrolls for March 2025 – Forecast 140K, versus 151K previous.
- US Unemployment Rate for March 2025 - Forecast 4.1%, versus 4.1% previous.
BoJ’s Ueda: US tariffs likely to pressure Japan’s economy
BoJ Governor Kazuo Ueda warned that the 24% tariffs imposed by the US on Japanese goods could have broad implications. He emphasized that heightened uncertainty over the economic outlook may weigh on corporate sentiment and trigger volatile market behavior. This, in turn, could place "downward pressure on global and Japanese economies".
Meanwhile, Ueda noted that the effect on inflation remains uncertain, as the tariffs could either suppress prices by weakening demand or push them higher through supply chain disruptions.
Despite these concerns, Ueda maintained a cautiously optimistic view on Japan’s economy. He pointed out that corporate sentiment remains positive, and capital expenditure plans are stronger than in the same period of prior years.
He referred to the latest Tankan survey as supportive of BoJ's baseline view that Japan’s economy is "recovering moderately". Still, Ueda noted that the survey, conducted from late February to March 31, may not have fully captured the impact of the US tariff announcements.
BoJ Deputy Governor Shinichi Uchida, also speaking at the session, reiterated that the central bank remains committed to adjusting rates if the likelihood of achieving its 2% inflation target increases.
Uchida emphasized that future policy decisions will be made on a meeting-by-meeting basis, based on updated forecasts, "without any preconception".