
Sample Category Title
Tokyo Inflation Rises, Keeping BOJ on Track for Rate Hike
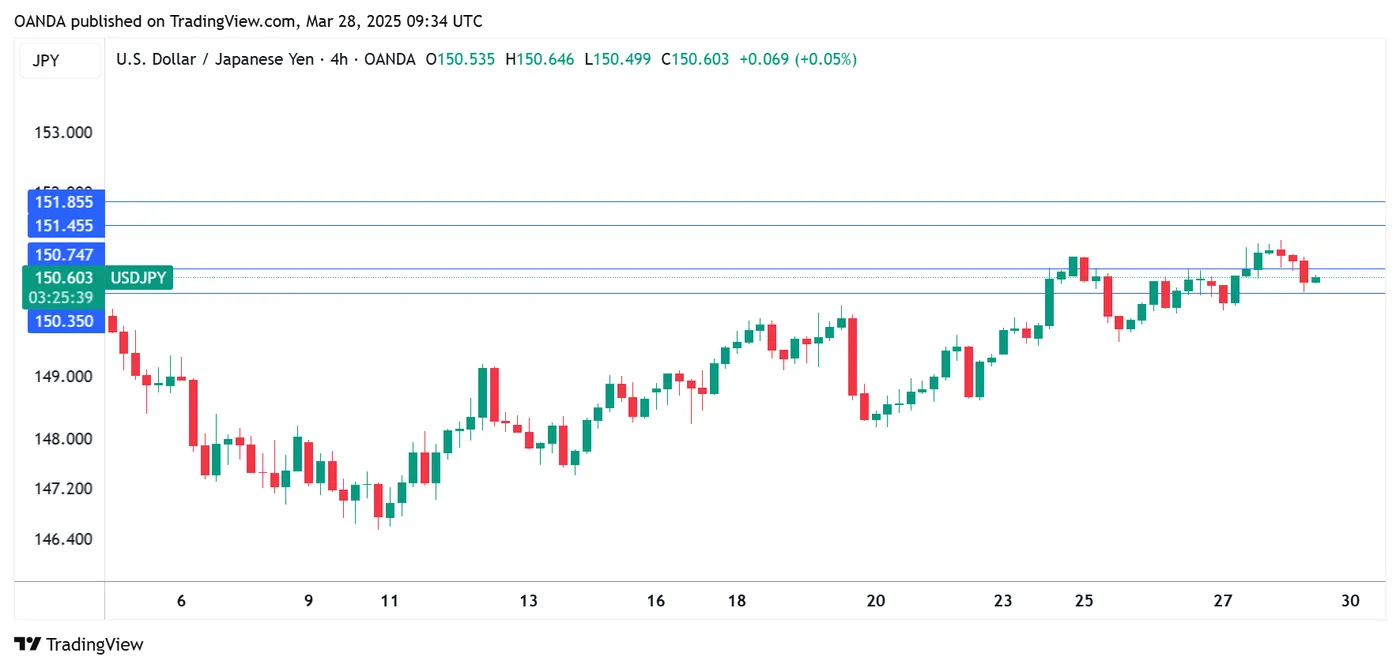
The Japanese yen has posted considerable gains on Friday. In the European session, USD/JPY is trading at 150.53, down 0.33% on the day.
Tokyo core inflation accelerates to 2.4%, higher than expected
Inflation in Japan's capital accelerated in February. Tokyo Core CPI, one of the most important inflation indicators, rose to 2.4% y/y, up from 2.2% in January and above the market forecast of 2.2%.
Tokyo CPI climbed to 2.9%, up from 2.8% in January but below the market estimate of 3.1%. The gain was largely driven by rising rice prices, which have soared by 90% over the past year.
This is the fifth straight month that both headline and core inflation has stayed above the Bank of Japan's 2% target, supporting the case for the central bank to continue raising interest rates. The BoJ has been cautious and held rates earlier this month, citing the uncertainty in the global economy.
Earlier this week, Governor Kazuo Ueda said that the recent spike in inflation was driven by temporary factors such as higher import costs and food prices, which was not a reason to tighten policy. However, Ueda warned that if the acceleration in food and other prices proved to be broad-based, the BoJ would have to respond with a rate hike.
Ueda has been sending strong signals about another rate hike but hasn't specified a timeline. The BoJ meets next on May 1 and the money markets have priced in a 27% chance of a quarter-point hike.
BOJ Summary of Opinions indicates concern over inflation
Overshadowed by the Tokyo inflation report was the release of the BoJ Summary of Opinions from the March meeting.
Hawkish members noted that inflationary pressures were rising and rising food prices could have a significant impact on underlying inflation, while the more dovish members focused on risks to Japan's economy due to US tariff policy. The takeaway from the discussion is that the BoJ has probably not circled a date to raise rates and remains in a wait-and-see-mode.
USD/JPY Technical
- USD/JPY is testing support at 150.75, followed by support at 15.035
- 151.45 and 151.85 are the next resistance lines
Pound Stands Strong Amid Global Trade Tensions
The GBP/USD pair is consolidating around 1.2941 this Friday as the British pound continues to outperform its peers. Unlike other major currencies, the pound has remained relatively insulated from escalating global trade tensions, giving it a distinct advantage.
Why the pound is outperforming
The UK’s distance from ongoing trade wars has shielded sterling from the worst volatility triggered by US tariff policies. While other economies brace for the impact of trade restrictions, the UK, at least in theory, faces fewer immediate risks from President Trump’s protectionist measures.
Adding to sterling’s resilience is the fiscal plan of UK Treasury Chief Rachel Reeves, which outlines spending reductions totalling 14 billion GBP. This move could significantly boost the economy’s fiscal potential, creating a 10 billion GBP reserve for future spending needs. As a result, the government may reduce bond issuance, easing pressure on public finances.
Mid-week, the pound dipped slightly following the release of UK inflation figures. The Consumer Price Index (CPI) rose by 0.4% month-on-month in February, rebounding from a -0.1% decline in January. On an annual basis, inflation eased to 2.8% (down from 3.0%), likely due to seasonal energy demand during the colder months. However, the market reaction was short-lived, suggesting sustained confidence in the pound’s strength.
Technical analysis of GBP/USD
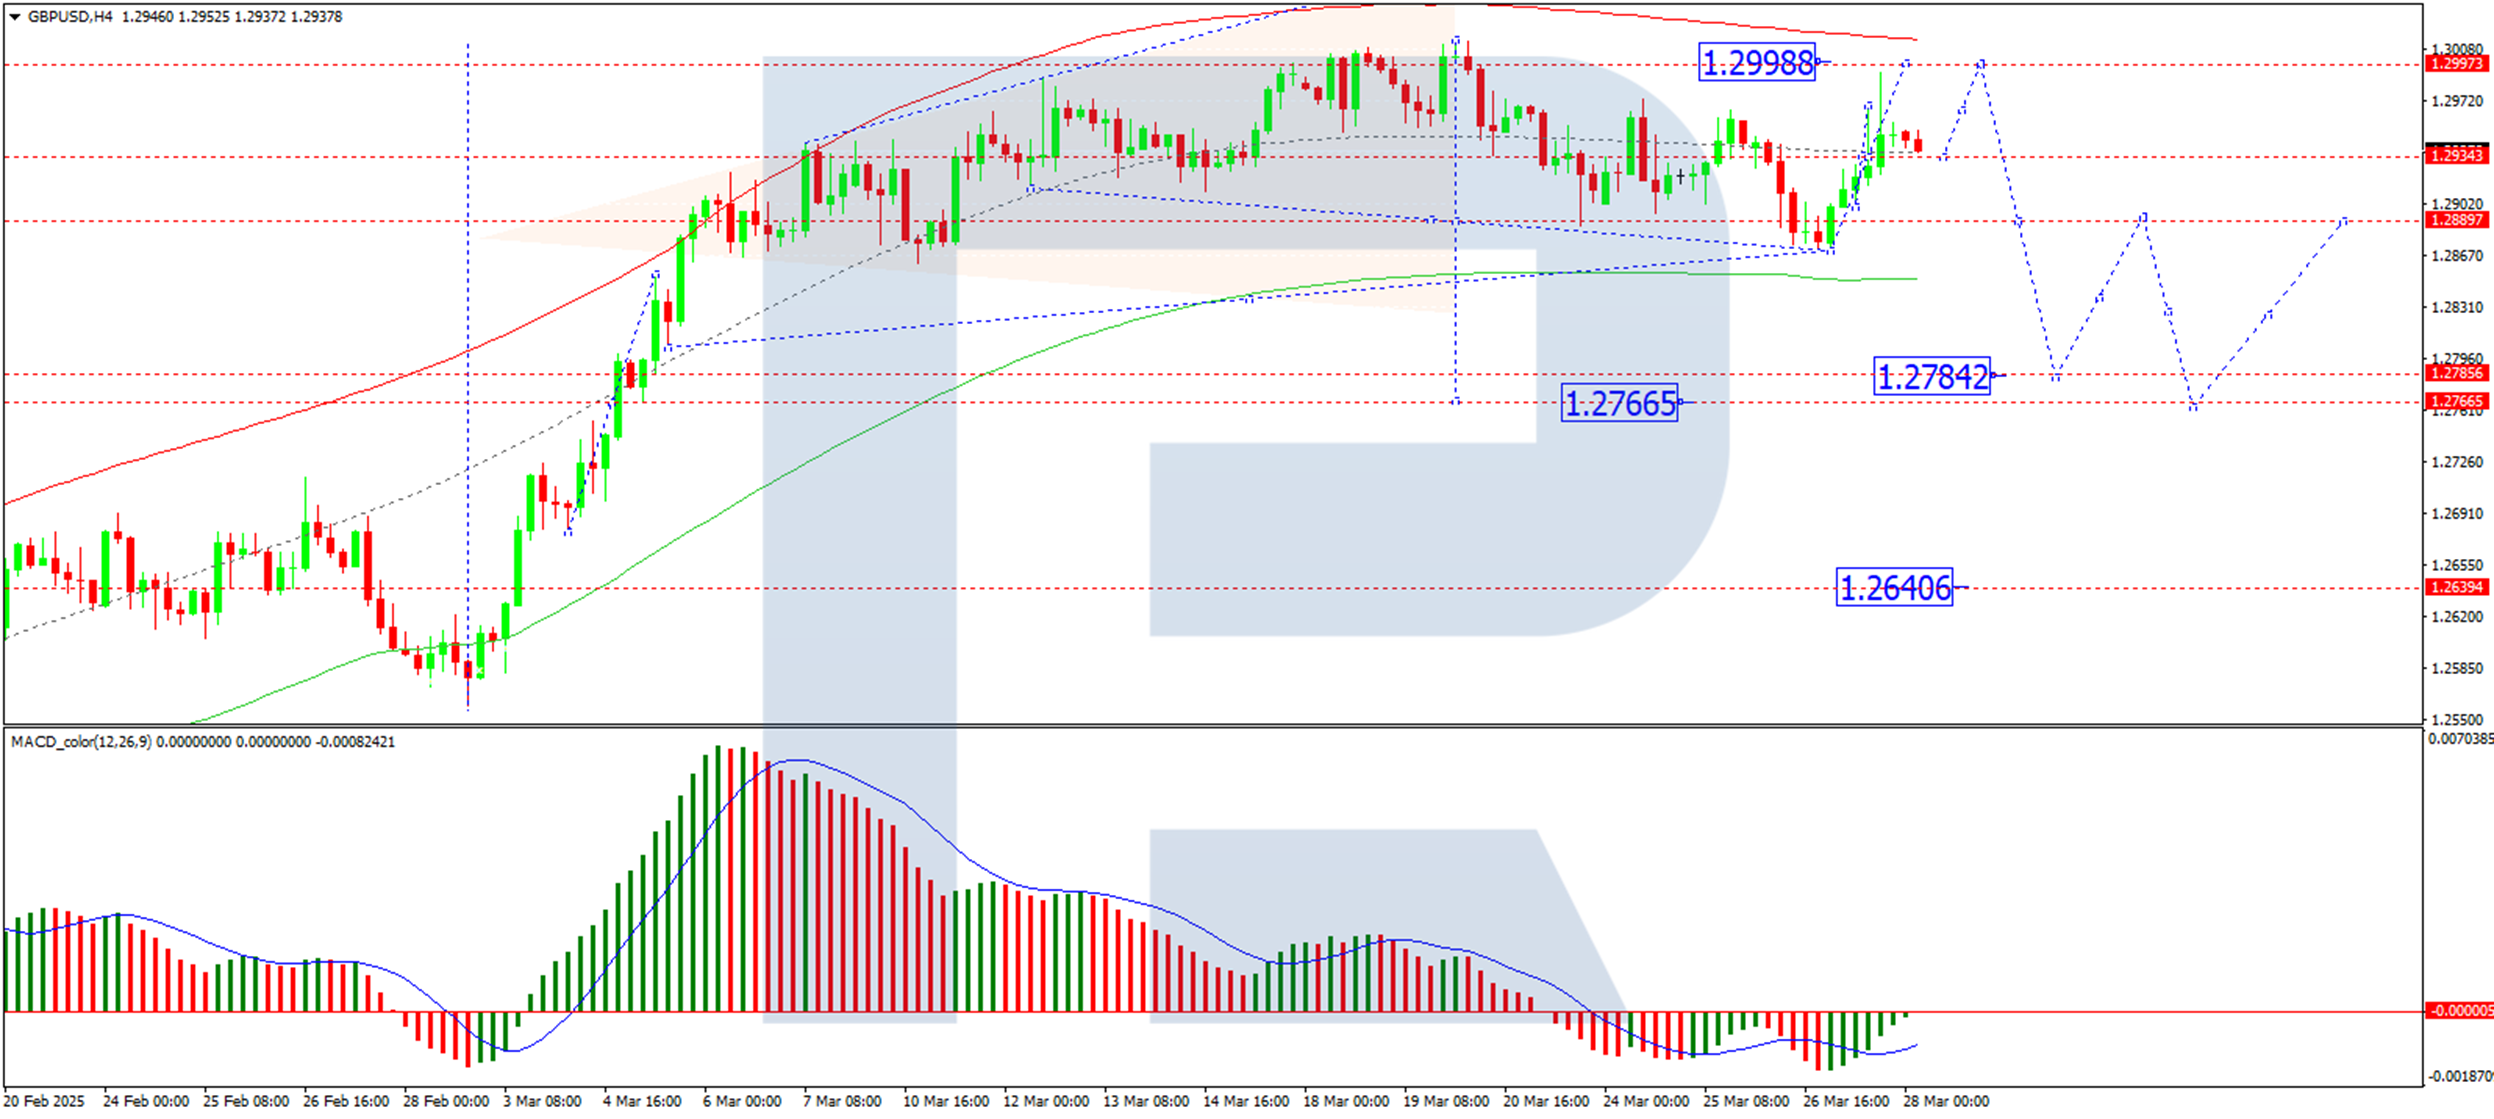
H4 Chart: The pair is consolidating near 1.2934, with a potential upward extension towards 1.2998. A subsequent downward wave towards 1.2784 remains possible, supported by the MACD indicator, where the signal line remains below zero but is trending upward.
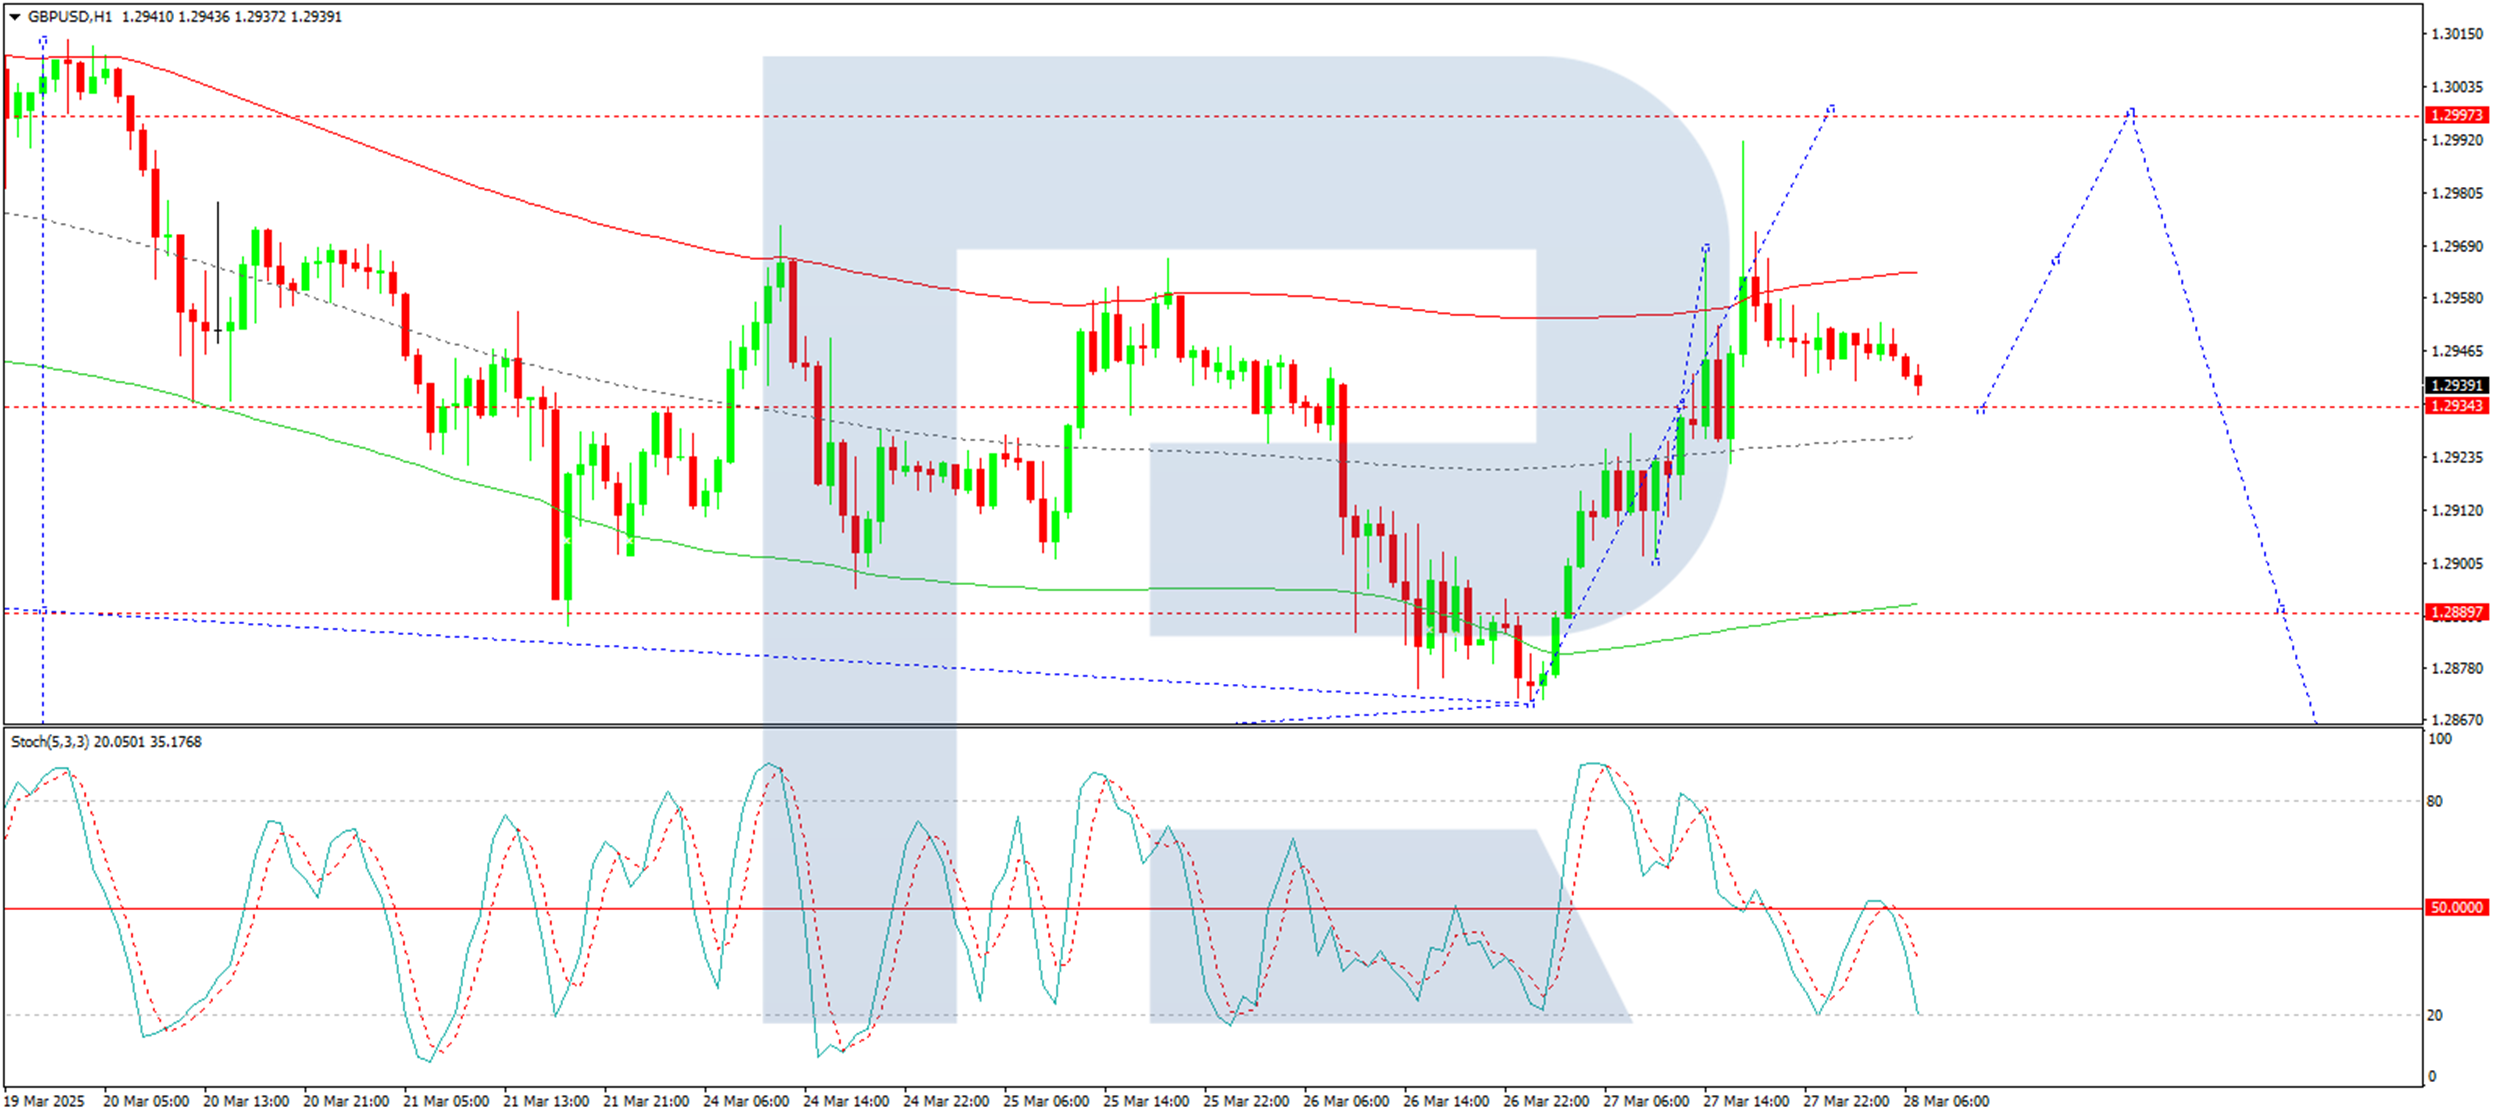
H1 Chart: After hitting a local high at 1.2970, a pullback towards 1.2934 (testing support from above) is likely. A rebound towards 1.2998 could follow before a potential decline to 1.2888. The Stochastic oscillator supports this outlook, with its signal line below 50 and pointing downward towards 20.
Conclusion
While short-term fluctuations persist, the pound’s resilience, supported by favourable fiscal policies and its detachment from global trade conflicts, positions it as a standout performer. Traders should monitor key technical levels for potential breakouts or reversals in the coming sessions.
Gold Price Hits Record High
On 19 March, we reported that gold had surpassed $3,000 per ounce for the first time in history and suggested this psychological level could be tested.
As shown on the XAU/USD chart, the price briefly dipped below $3,000 but quickly rebounded. According to the Smart Money Concept methodology, this may have been a liquidity sweep triggered by stop-loss orders placed below the key level. Regardless, the test occurred (as indicated by the arrow), and the bulls resumed the rally. The new all-time high is now around $3,080 and could be broken again today.
Why Is Gold Rising?
➝ Uncertainty over Trump’s tariff plans
➝ Expectations of lower interest rates
Gold is traditionally seen as a hedge against economic and political uncertainty and tends to perform well in a low-rate environment. Analysts at Goldman Sachs have raised their year-end 2025 gold price forecast to $3,300.
Technical Analysis of XAU/USD
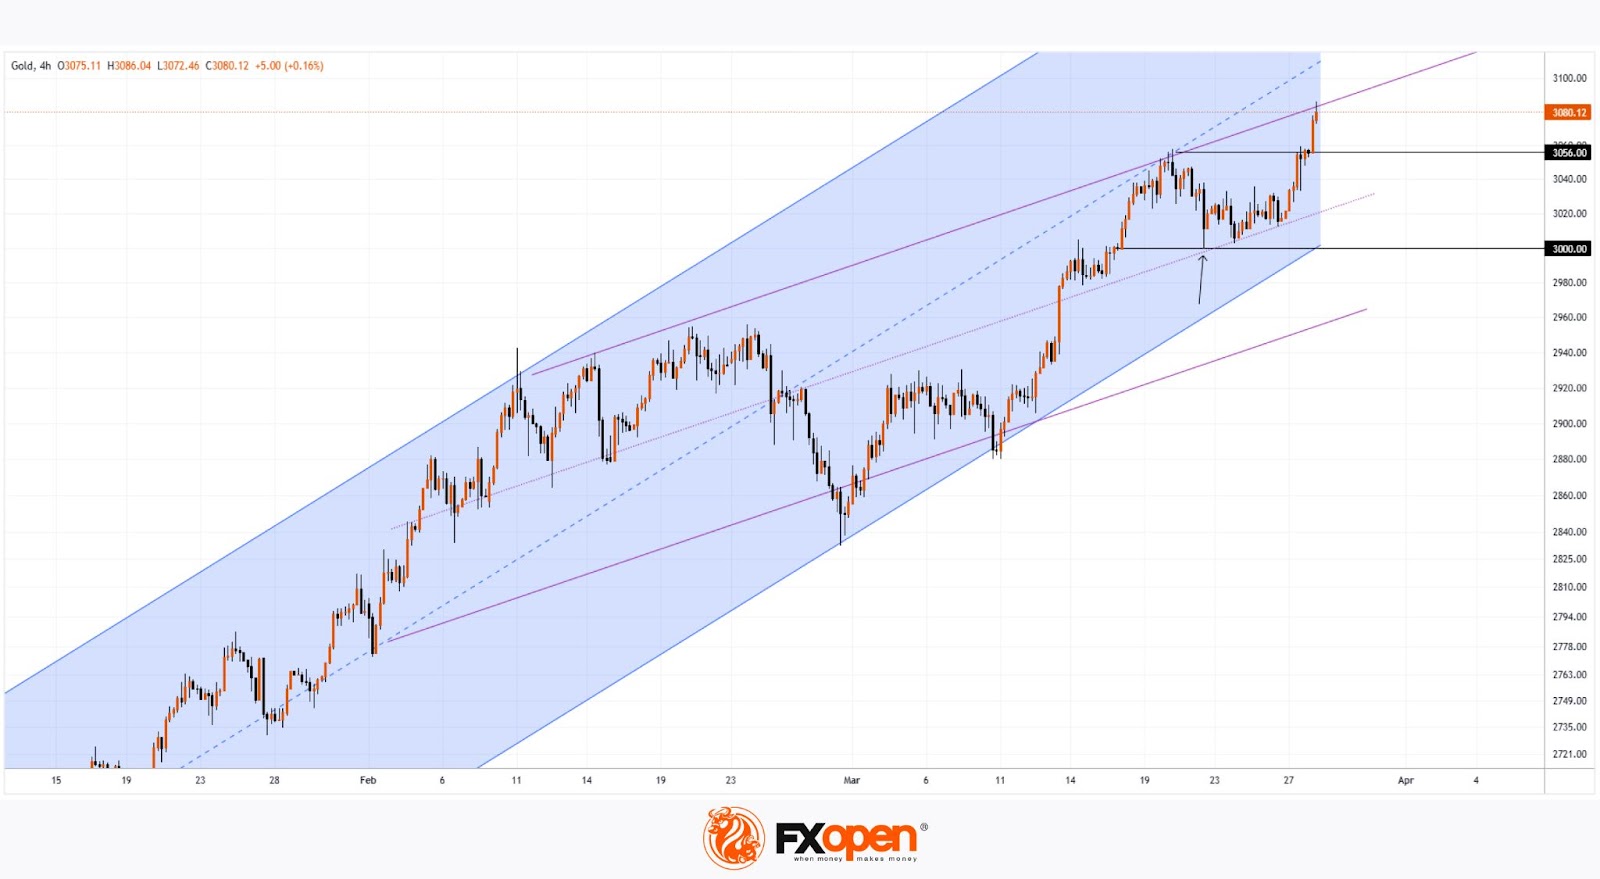
➝ Looking at gold’s broader trend, price movements continue to follow an upward channel (marked in blue), which has remained relevant since early 2025.
➝ Alternatively, a second, less steep ascending channel (marked in purple) suggests that gold is currently near its upper boundary, indicating a possible pullback. However, the $3,056 level—previously resistance—could now act as support, paving the way for a move towards the next milestone at $3,100.
Start trading commodity CFDs with tight spreads. Open your trading account now or learn more about trading commodity CFDs with FXOpen.
This article represents the opinion of the Companies operating under the FXOpen brand only. It is not to be construed as an offer, solicitation, or recommendation with respect to products and services provided by the Companies operating under the FXOpen brand, nor is it to be considered financial advice.
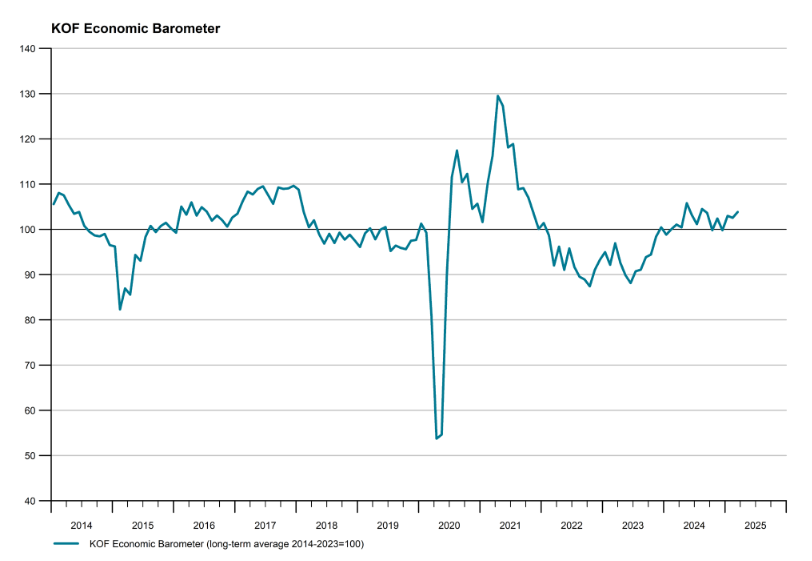
Swiss KOF rises to 103.9, robust economic outlook
Switzerland's KOF Economic Barometer rose to 103.9 in March, beating expectations of 102.6 and up from revised 102.6 in February. The index has remained above its medium-term average since the start of the year, reinforcing the view that the Swiss economy "remains robust".
KOF noted that improvements were broad-based, with stronger signals coming from manufacturing, services, and construction. Private consumption indicators also showed improvement while foreign demand remains unchanged.
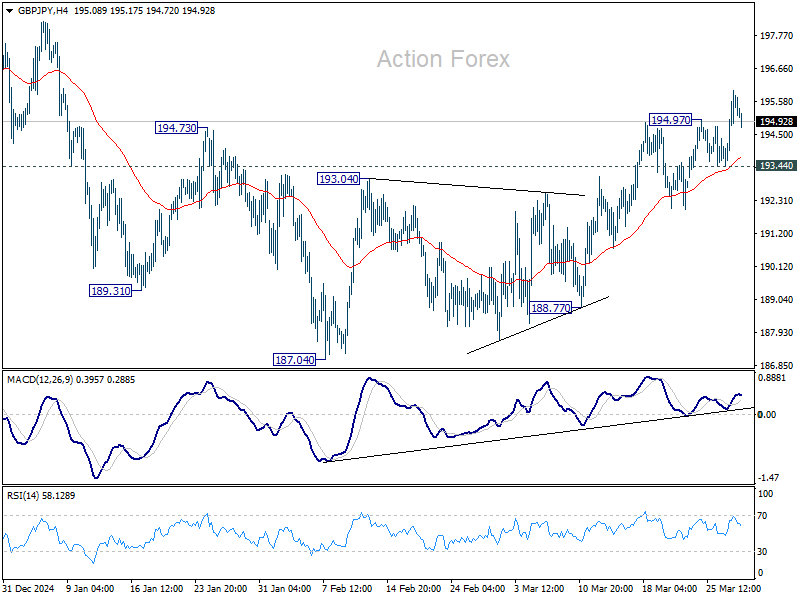
GBP/JPY Daily Outlook
Daily Pivots: (S1) 194.07; (P) 195.03; (R1) 196.54; More...
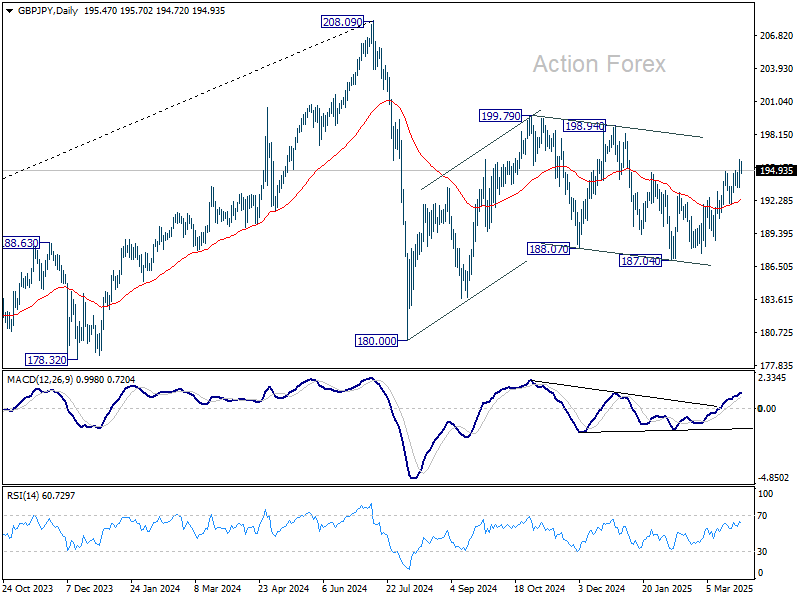
GBP/JPY's rebound from 187.04 resumed by breaking through 194.97 temporary top. Intraday bias is back on the upside for 198.94 resistance. For now, further rally is in favor as long as long as 193.44 support holds, in case of retreat. Overall, corrective pattern from 180.00 is still extending.
In the bigger picture, price actions from 208.09 are seen as a correction to rally from 123.94 (2020 low). Strong support should be seen from 38.2% retracement of 123.94 to 208.09 at 175.94 to contain downside. However, sustained break of 152.11 will bring deeper fall even still as a correction.
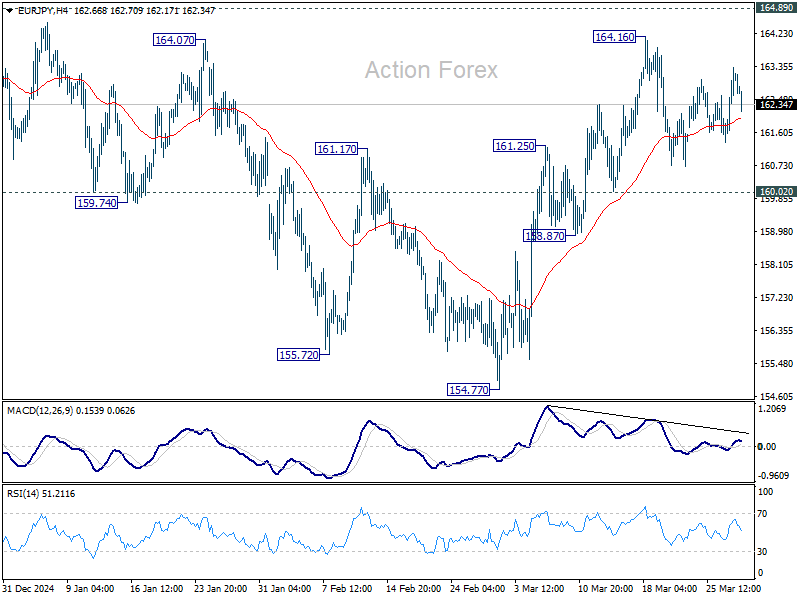
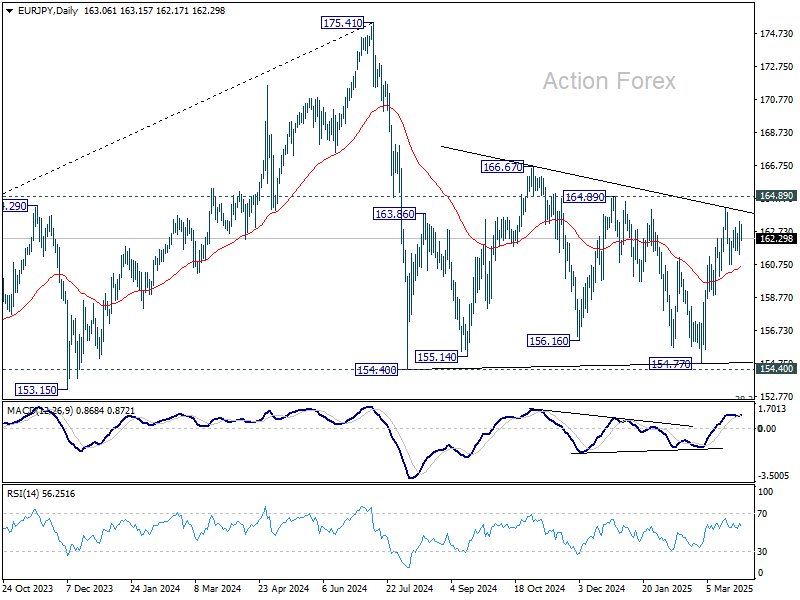
EUR/JPY Daily Outlook
Daily Pivots: (S1) 161.90; (P) 162.64; (R1) 163.89; More...
Range trading continues in EUR/JPY below 164.16 and intraday bias stays neutral. Further rally remains in favor as long as 160.02 support holds. Above 164.16 will target 164.89 and then 166.67. On the downside, however, break of 160.02 will argue that rise from 154.77 has completed and turn bias to the downside. Overall, sideway consolidation pattern from 154.40 is still extending.
In the bigger picture, price actions from 175.41 are seen as correction to rally from 114.42 (2020 low). Strong support should be seen from 38.2% retracement of 114.42 to 175.41 at 152.11 to contain downside. However, sustained break of 152.11 will bring deeper fall even still as a correction.
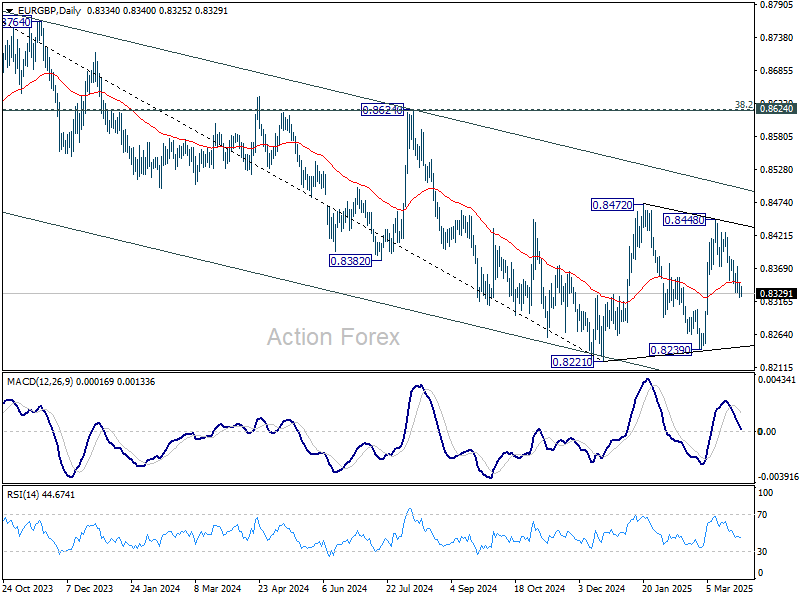
EUR/GBP Daily Outlook
Daily Pivots: (S1) 0.8327; (P) 0.8339; (R1) 0.8353; More...
Intraday bias in EUR/GBP remains mildly on the downside at this point. Rise from 0.8239 might have completed at 0.8448 already. Deeper fall would be seen back to 0.8239 support. On the upside, above 0.8384 minor resistance will turn bias back to the upside for 0.8448. Overall, consolidation pattern from 0.8221 is still in progress and could extend further.
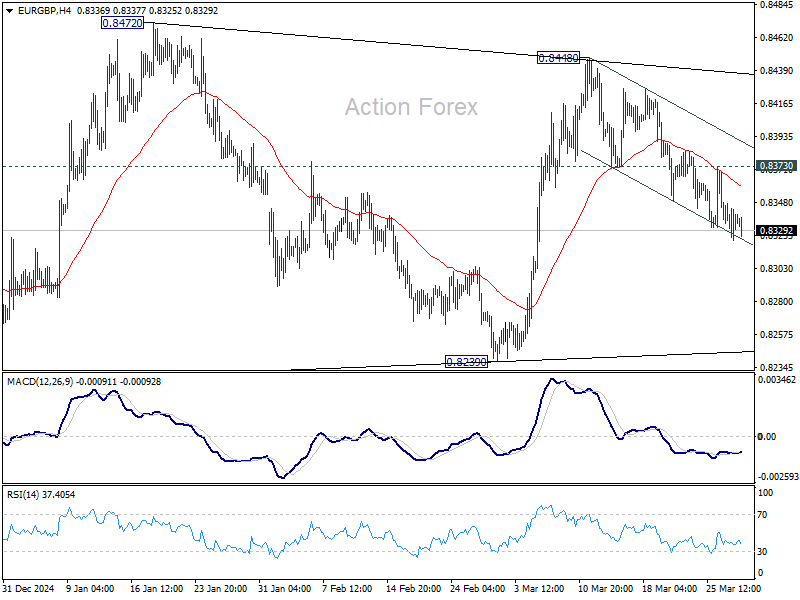
In the bigger picture, EUR/GBP is still bounded inside medium term falling channel. While rebound from 0.8221 might extend higher, it could still develop into a corrective pattern. Overall outlook will be neutral at best and down trend from 0.9267 (2022 high) could extend, at least until decisive break of channel resistance (now at 0.8495).
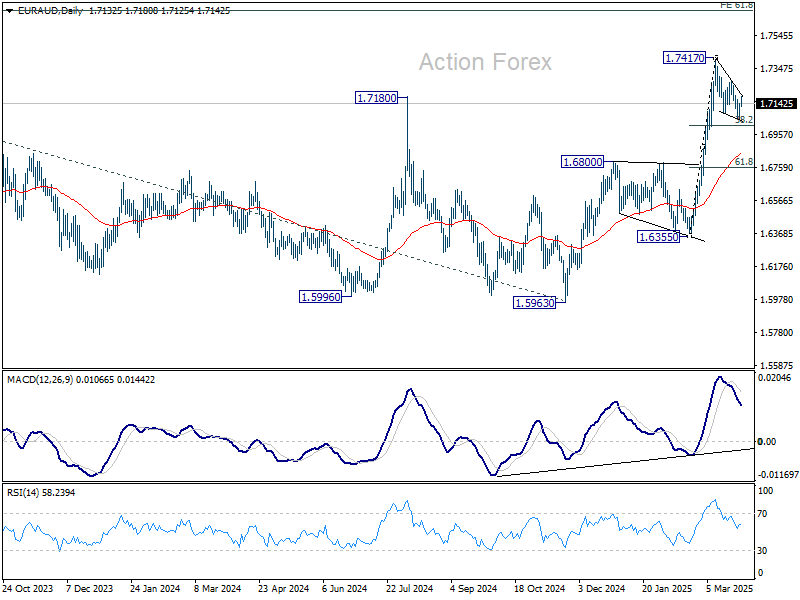
EUR/AUD Daily Outlook
Daily Pivots: (S1) 1.7076; (P) 1.7109; (R1) 1.7164; More...
Intraday bias in EUR/AUD is turned neutral with current rebound. Overall outlook is unchanged that strong support should be seen from 1.6990 to complete the correction from 1.7147. On the upside, above 1.7270 will bring retest of 1.7417 first. Break there will resume whole rise from 1.6335.
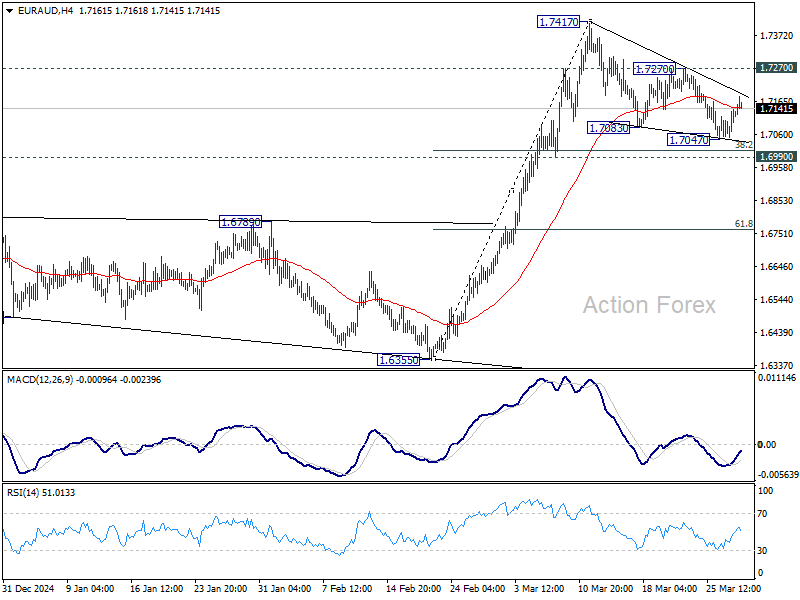
In the bigger picture, the breach of 1.7180 key resistance (2024 high) suggests that up trend from 1.4281 (2022 low) is resuming. Sustained trading above 1.7180 will confirm and target 61.8% projection of 1.4281 to 1.7062 from 1.5963 at 1.7682, which is also close to 61.8% retracement of 1.9799 (2020 high) to 1.4281 at 1.7691. For now, this will remain the favored case as long as 1.6800 resistance turned support holds, even in case of deep pullback.
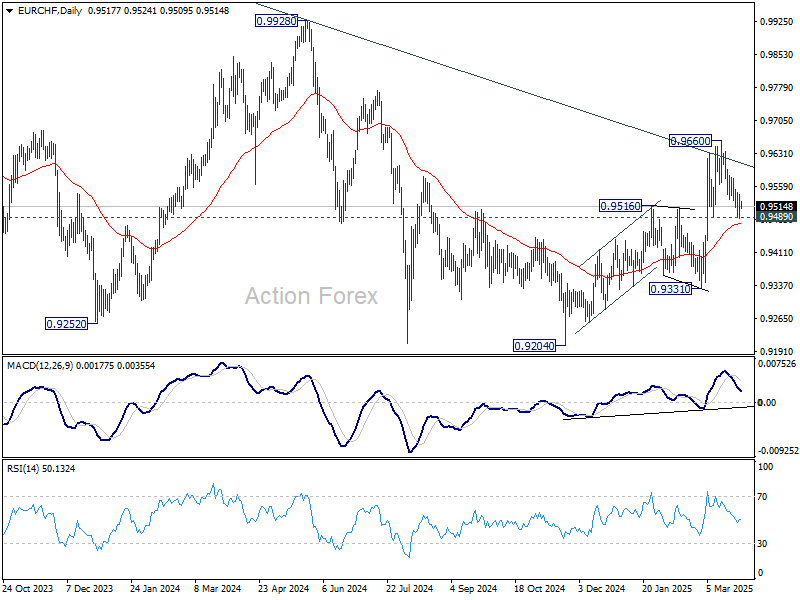
EUR/CHF Daily Outlook
Daily Pivots: (S1) 0.9496; (P) 0.9519; (R1) 0.9548; More....
Intraday bias in EUR/CHF remains neutral at this point. Strong support is expected from 0.9489 to complete the correction from 0.9660. On the upside, above 0.9581 minor resistance will bring retest of 0.9660 first. However, sustained break of 0.9489 will dampen this view, and bring deeper fall back to 0.9331 support next.
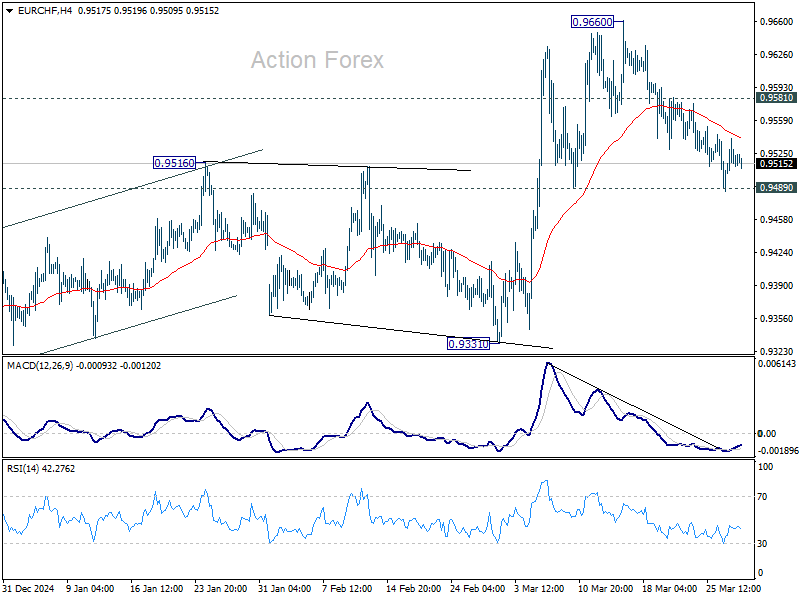
In the bigger picture, prior strong break of 55 W EMA (now at 0.9487) is a medium term bullish sign. Sustained break trading above long-term falling channel resistance (at around 0.9618) would suggest that the downtrend from 1.2004 (2018 high) has bottomed at 0.9204. Stronger rally should then be seen to 0.9928 key resistance at least.
Inflation in Tokyo Easily Topped Analyst Forecasts
Markets
The US Congressional Budget Office yesterday published its projections for the US federal budget deficit and debt for the period 2025-2055. Both are expected to rise substantially further under the assumption that current laws will remain unchanged. The latter of course complicates investors’ assessment on the exact meaning of the report as it for example considers the Trump tax cuts to expire under current law. A the same time, the long term impact of current spending cuts is difficult to assess. That said, the CBO expects the Budget deficit to rise from an expected 6.2% in 2025 to 7.3% in 2055. The rise in the deficit, amongst others, is for an important part driven by higher interest rate payments (expected to rise from 3.2% of GDP to 5.4%). The debt is seen rising from 100% of GDP this year to a new post-WWII record of 107% in 2029 to reach 156% of GDP in 2055. Aside from higher interest rate payments, a slower (potential) GDP growth (1.7% compared to an average of 2.4% over the previous 30 years) further complicates debt sustainability. Lower population growth in this respect is an important factor behind slower GDP growth. The outcome was no big surprise and the market reaction was very limited. Even so, the topic of debt sustainability will remain high on the political and market agenda as the Trump administration is taking sweeping steps that are at risk to further raise the deficits and in any case limit the visibility/raise the uncertainty on the US deficit/debt trajectory going forward. US yields in technical trading yesterday changed between -2.7 bps and +1.9 bps. Fed’s Collins indicated that tariffs inevitably add to inflation. Fed’s Barkin focused on the negative impact of instability for demand. In Europe/Germany the bull steepening continues with German yields again easing between 5.0 bps (2-y) and 0.3 bps (30-y). On equity markets, the US announcing 25% tariffs on auto imports didn’t help to restore investor confidence ahead of next week’s ‘tariffs Liberation Day’. Evens so, declines on US (S&P 500 -0.33%) and European equity markets (EuroStoxx 50 -0.57%) remained orderly. The dollar ceded modest ground (DXY 104.33 from 104.62). EUR/USD rebounded to close near 1.08, not that bad given the region’s exposure to (auto)tariffs.
Today’s calendar is well filled with first national EMU March inflation data (Spain, France, Belgium), ECB inflation expectations and EC economic confidence. In the US the February PCE deflators are worth looking at. Soft EMU inflation data might reinforce the case for the ECB to ‘frontload’ its next rate cut to April. US deflators are expected little changed, but holding well above the Fed target (headline 2.5%, core 2.7%). Even so, data probably will have to significantly deviate from consensus for markets to engage in lasting move, with investors taking a cautious approach ahead of next week’s US tariffs announcement.
News & Views
Is its quarterly Monetary Policy report released yesterday, the central bank of Brazil (BdB) downwardly revised its GDP growth projection for 2025 from 2.1% to 1.9%, with a larger reduction in expectations for the more cyclical components. On inflation, which was already at a high level, the Bank took notice that it has risen again from 4.87% on November to 5.06% in February, 0.33pp above the December scenario and said that deanchoring risk of expectations has increased. March inflation published yesterday even printed at 5.26%. The BdB now projects that inflation remains above the upper limit of the tolerance interval (3.0% +/- 1.5%) throughout 2025, starting to fall from 2025Q4, but still staying above target. In the relevant monetary policy horizon, considered to be 2026Q3, the projected inflation still stands at 3.9%. The Bank last week raised its policy rate by 100 bps to 14.25%, and indicated a further adjustment, albeit at of a lower magnitude at its next meeting.
Inflation in Tokyo, often a reliable guide for where national Japanese price pressures are headed to, easily topped analyst forecasts. Prices in March rose 2.9%, accelerating from 2.8% in February and to be compared with a 2.7% forecast. The gauge excluding fresh food (favoured by the central bank) unexpectedly quickened to 2.4%, as did the narrowest indicator (ex. fresh food and energy), to 2.2%. Services prices rose by 0.8%, the fastest pace since December. It was up from 0.6% in February in a sign of building consumer momentum thanks to strong wage increases. In theory the numbers today add to a case for the Bank of Japan to hike policy rates further from the current 0.5%, potentially already at the May 1 meeting. However, comments from officials recently turned more balanced amid a darkening outlook for the global economy that’s posing risks for Japan’s as well. Money markets currently price the next hike for September but we believe the BoJ will act sooner (June or July at the latest). The Japanese yen appreciates marginally this morning. USD/JPY eases towards 150.77.