Sample Category Title
Equities Extend Losses on Tariff Fears, But Forex Markets Hold Steady in Consolidation
US stock markets suffered another brutal session overnight, with NASDAQ leading the decline, shedding nearly -2%. All three major indexes closed below their respective 55 W EMAs, reinforcing the bearish case that the markets are now in a medium-term correction phase. This technical breakdown suggests that downside momentum is gaining traction, with investors recalibrating their expectations amid escalating economic uncertainty, particularly regarding the relentless stream of tariff threats.
A major driver of the selloff remains the intensifying trade war, which shows no signs of slowing down. Tariff threats are mounting almost daily, as analysts argue that markets have yet to fully price in the potential economic fallout. The momentum of these escalations is expected to persist well into the second quarter, particularly with reciprocal tariffs set to take effect in April.
The European Union has already signaled its intent to retaliate against US tariffs, and similar counter measures would be seen from other countries too. Beyond the EU response, additional tariffs are in the pipeline, targeting China with higher duties, and likely extending to non-border-related tariffs against Canada and Mexico. Japan could also find itself in Washington’s crosshairs, particularly over criticism about its weak currency. The sheer breadth of these tariff initiatives suggests that the market’s current adjustment may just be the beginning of a broader risk-off shift. Investors have just started offloading positions to hedge against further risks.
Meanwhile, despite the turbulence in equities, currency markets have remained relatively steady. So far this week, the Sterling is currently the strongest performer, followed by Euro and Dollar. On the weaker end of the spectrum, Swiss Franc is the worst performer, trailed by Loonie and Aussie. Kiwi and Yen are positioned in the middle. However, almost all major currency pairs and crosses are still trading within last week’s range, suggesting that the forex market is in a consolidation phase.
Looking ahead, today’s key data releases—UK GDP and the University of Michigan consumer sentiment and inflation expectations—will be closely watched. U.S. consumer sentiment has already plunged by -10 points over the past two months, reflecting the growing unease surrounding tariff policies. A further steep decline in sentiment could significantly heighten recession fears and deepen the market’s risk-off mood.
In Asia, at the time of writing, Nikkei is up 0.87%. Hong Kong HSI is up 2.33%. China Shanghai SSE is up 1.71%. Singapre Strait Times is down -0.21%. Japan 10-year JGB yield is down -0.018 at 1.528. Overnight, DOW fell -1.30%. S&P 500 fell -1.39%. NADSAQ fell -1.96%. 10-year yield fell -0.044 to 4.274.
NZ BNZ manufacturing hits 53.9 as recovery gains unexpected momentum
New Zealand’s BusinessNZ Performance of Manufacturing Index rose from 51.7 to 53.9 in February, marking its highest level since August 2022.
This solid improvement was driven by stronger production (52.4) and new orders (51.5), both also reaching their best levels since August 2022. Meanwhile, employment surged to 54.0, climbing 3.2 points from January and hitting its highest level since September 2021.
Despite the stronger data, business sentiment remains cautious. The proportion of negative comments from respondents rose to 59.5% in February, up from 57.7% in January. Many manufacturers cited weak orders and sluggish sales as ongoing challenges, signaling that while expansion has resumed.
BNZ’s Senior Economist Doug Steel welcomed the sustained improvement, noting that "pickup may be a bit faster than we are currently forecasting".
Gold hits record high, approaches 3000 amid ceasefire deadlock
Gold’s up trend resumed overnight and surged to new record highs as the precious metal remains well-supported by escalating global uncertainties. The psychological 3000 level is now in sight as investors flock to the safe-haven asset. The rally is being fueled by multiple factors, including intensifying trade tensions, stalemate in Ukraine-Russia ceasefire negotiations, and the extended broad selloff in US stock markets.
In particular, the latest developments surrounding the ceasefire talks between Russia and Ukraine have kept uncertainty high. Russian President Vladimir Putin stated that he agreed to the US-led ceasefire proposal in principle but stopped short of fully endorsing it.
Putin indicated that further discussions with US President Donald Trump would be necessary to ensure that the ceasefire results in a “long-term peace” and addresses the "root causes" of the conflict. He also expressed skepticism, questioning whether the proposed 30-day ceasefire would be used to “supply weapons” or “train newly mobilized units,” and raised concerns over how violations would be monitored.
Trump, in response, acknowledged that early reports from Russia were "going OK," but added that “doesn’t mean anything until we hear what the final outcome is.”
With the ceasefire deal still hanging in the balance, geopolitical risks stays high.
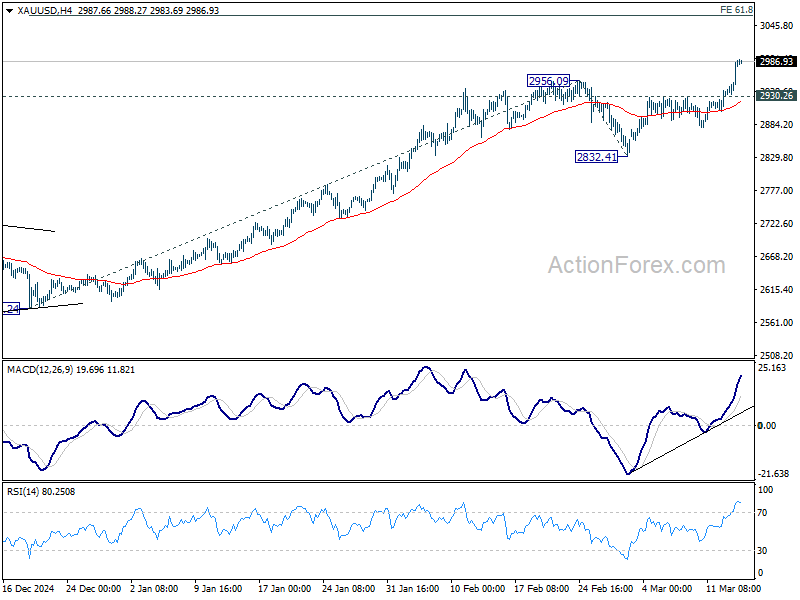
Technically, the next near term target for Gold is 61.8% projection of 2584.24 to 2956.09 from 2832.41 at 3062.21.
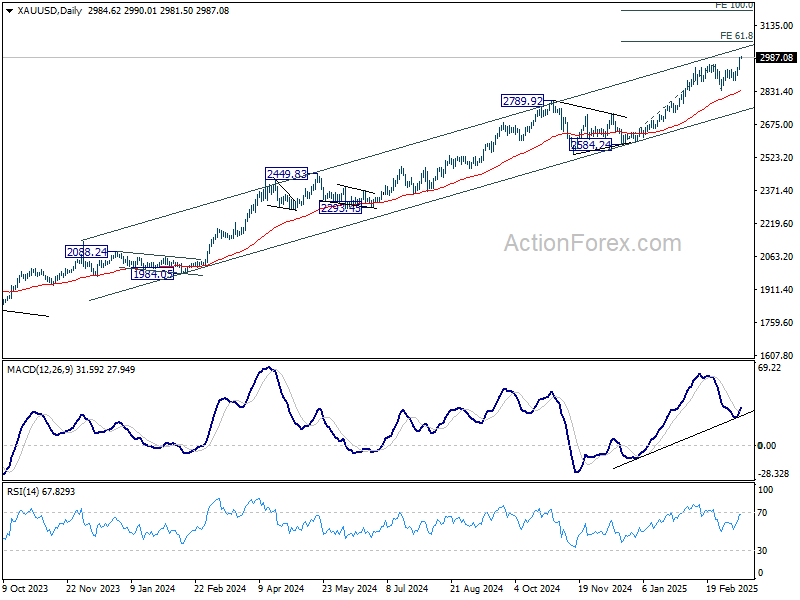
However, a key test lies ahead in the medium-term rising channel resistance, which has capped price advances since early 2024. Rejection at this level would still maintain gold’s bullish trend but keep its momentum in check.
On the other hand, decisive breakout above the channel resistance would signal acceleration in Gold’s uptrend. In such a scenario, gold could quickly reach 100% projection level at 3204.26.
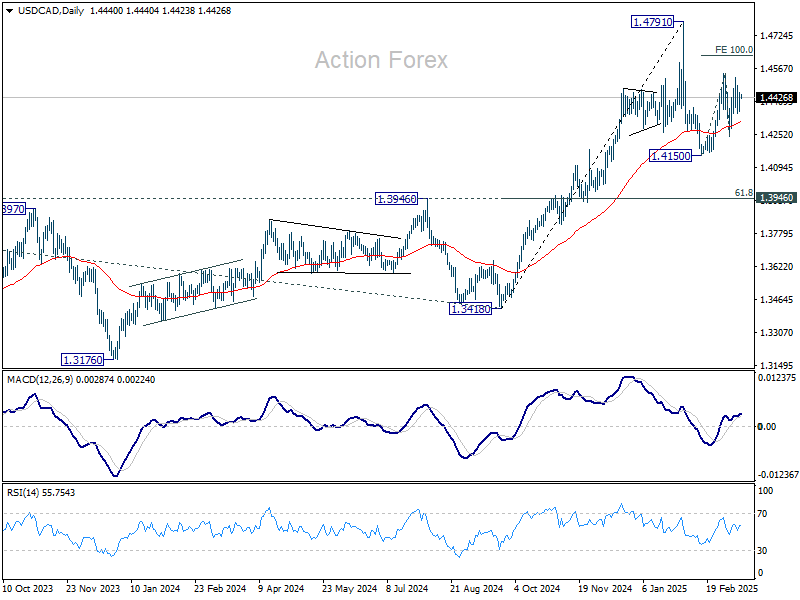
USD/CAD Daily Outlook
Daily Pivots: (S1) 1.4384; (P) 1.4418; (R1) 1.4477; More...
Intraday bias in USD/CAD stays neutral as sideway trading continues. Price actions from 1.4791 high are seen as a corrective pattern, with rebound from 1.4150 as the second leg. On the upside, break of 1.4541 will target 100% projection of 1.4150 to 1.4541 from 1.4238 at 1.4629 and above. But for now, strong resistance is expected from 1.4791 to limit upside to bring the third leg. On the downside, break of 1.4238 will confirm that the third leg has started through 1.4150 support.
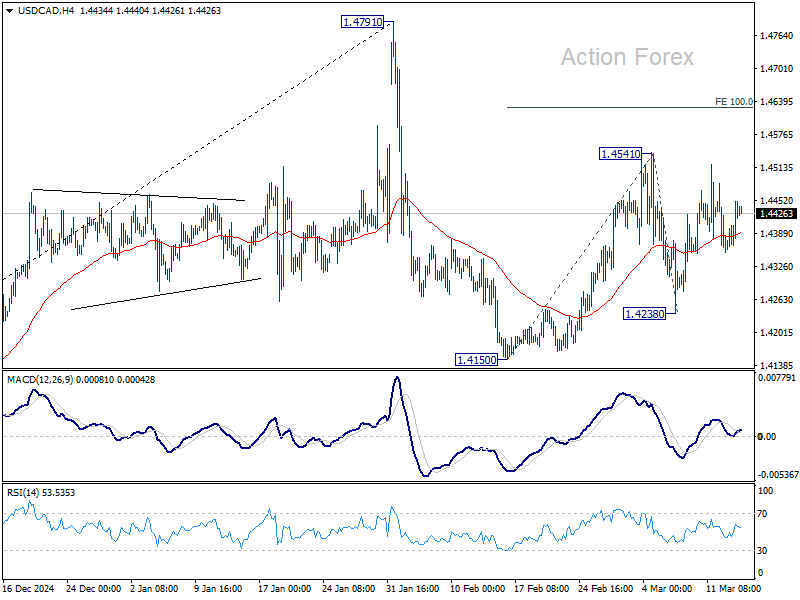
In the bigger picture, long term up trend is tentatively seen as resuming with prior breach of 1.4667/89 key resistance zone (2020/2015 highs). Next target is 100% projection of 1.2401 to 1.3976 from 1.3418 at 1.4993. This will remain the favored case as long as 1.3976 resistance turned support holds (2022 high), even in case of deep pullback.
Elliott Wave View: EURUSD Nesting Higher in Bullish Outlook
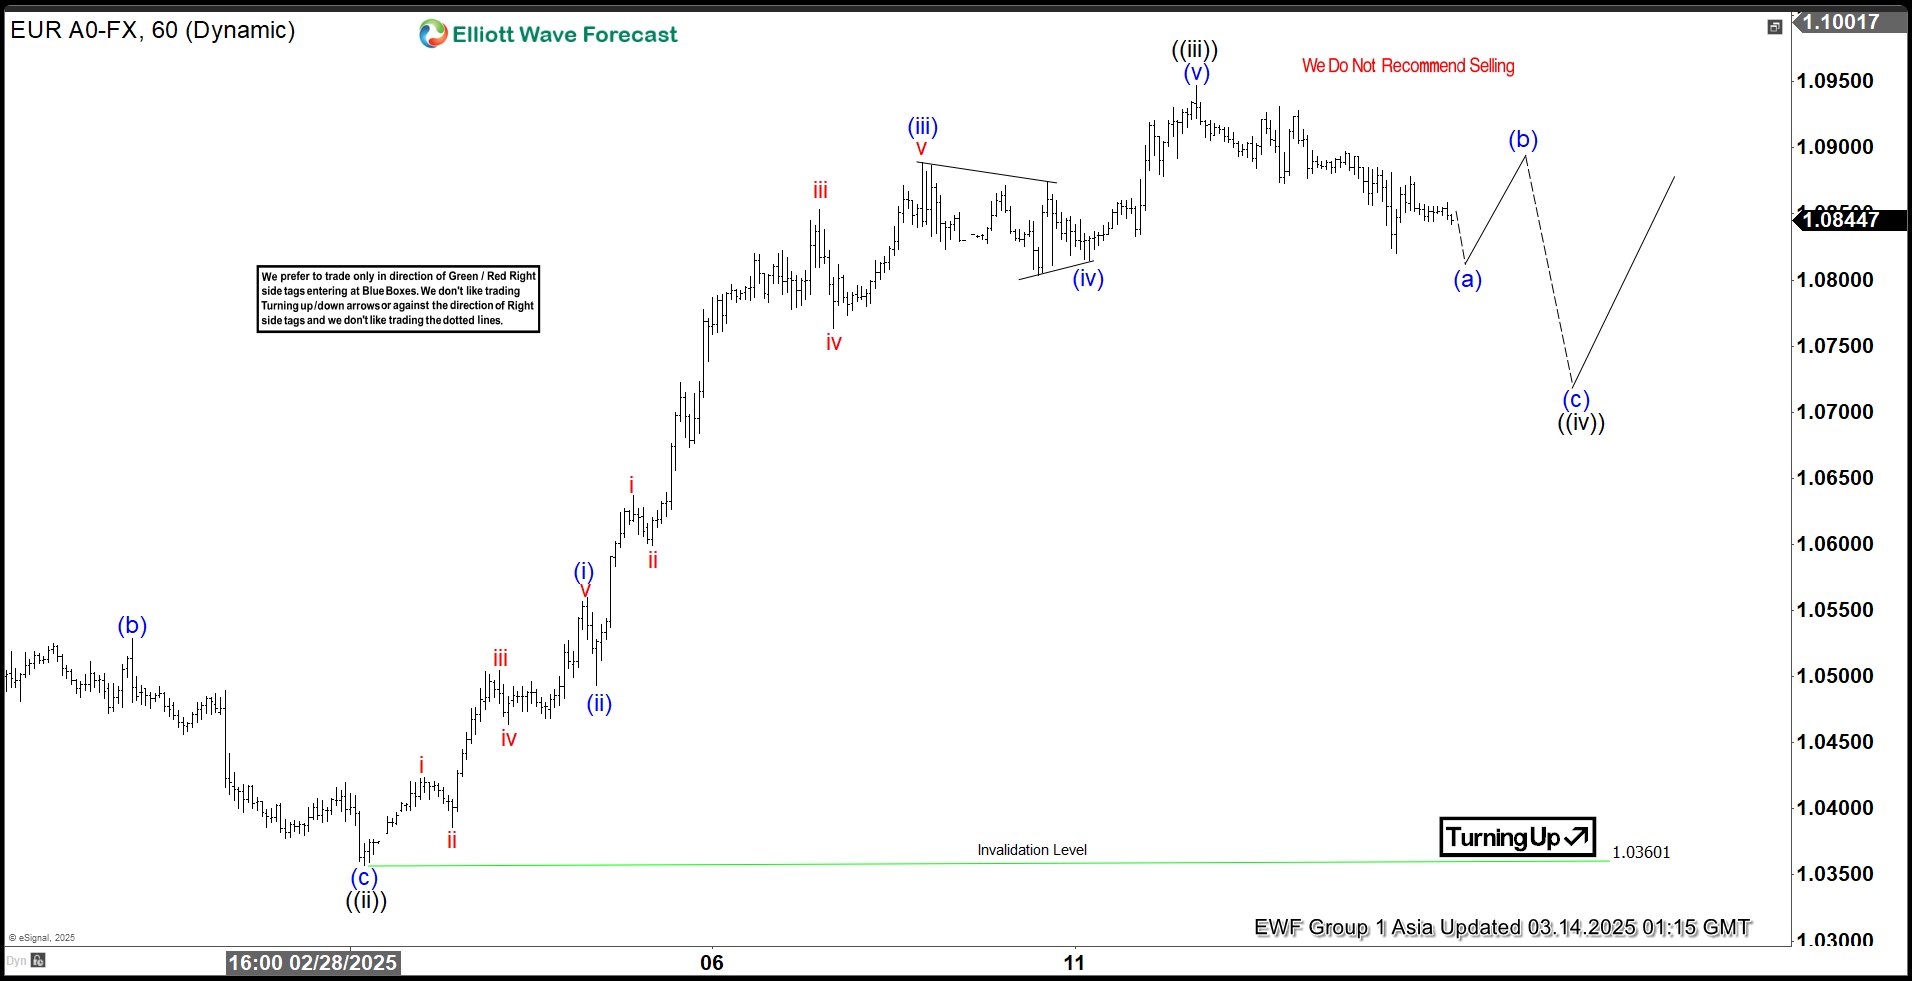
Short term outlook of EURUSD shows a bullish impulsive structure with extension (nest) from 1.13.2025 low. Up from 1.13.2025 low, wave 1 ended at 1.0533 and pullback in wave 2 ended at 1.0205. Pair has resumed higher in wave 3 which subdivides into another 5 waves of lesser degree. Up from wave 2, wave ((i)) ended at 1.0528. Dips in wave ((ii)) ended at 1.036. Pair then resumed higher in wave ((iii)).
Up from wave ((ii)), wave (i) ended at 1.056 and pullback in wave (ii) ended at 1.0493. Wave (iii) higher ended at 1.0888 and dips in wave (iv) ended at 1.081. Final leg wave (v) ended at 1.0947 which completed wave ((iii)) in higher degree. Pullback in wave ((iv)) is in progress to correct cycle from 3.1.2025 low before it resumes higher. Internal subdivision of wave ((iv)) is unfolding as a zigzag structure. Down from wave ((iii)), wave (a) is expected to end soon, then it should bounce in wave (b), before turning lower again in wave (c) to end wave ((iv)). Near term, as far as pivot at 1.036 low stays intact, expect pullback to find buyers in 3, 7, or 11 swing for further upside.
EURUSD 60 Minutes Elliott Wave Chart
EURUSD Video
https://www.youtube.com/watch?v=2fJj-a_tz5U
Gold hits record high, approaches 3000 amid ceasefire deadlock
Gold’s up trend resumed overnight and surged to new record highs as the precious metal remains well-supported by escalating global uncertainties. The psychological 3000 level is now in sight as investors flock to the safe-haven asset. The rally is being fueled by multiple factors, including intensifying trade tensions, stalemate in Ukraine-Russia ceasefire negotiations, and the extended broad selloff in US stock markets.
In particular, the latest developments surrounding the ceasefire talks between Russia and Ukraine have kept uncertainty high. Russian President Vladimir Putin stated that he agreed to the US-led ceasefire proposal in principle but stopped short of fully endorsing it.
Putin indicated that further discussions with US President Donald Trump would be necessary to ensure that the ceasefire results in a “long-term peace” and addresses the "root causes" of the conflict. He also expressed skepticism, questioning whether the proposed 30-day ceasefire would be used to “supply weapons” or “train newly mobilized units,” and raised concerns over how violations would be monitored.
Trump, in response, acknowledged that early reports from Russia were "going OK," but added that “doesn’t mean anything until we hear what the final outcome is.”
With the ceasefire deal still hanging in the balance, geopolitical risks stays high.
Technically, the next near term target for Gold is 61.8% projection of 2584.24 to 2956.09 from 2832.41 at 3062.21.
However, a key test lies ahead in the medium-term rising channel resistance, which has capped price advances since early 2024. Rejection at this level would still maintain gold’s bullish trend but keep its momentum in check.
On the other hand, decisive breakout above the channel resistance would signal acceleration in Gold’s uptrend. In such a scenario, gold could quickly reach 100% projection level at 3204.26.
USD/JPY Upsides Capped—Bulls Struggle to Break Through
Key Highlights
- USD/JPY extended losses and tested the 146.60 zone.
- A major bearish trend line is forming with resistance at 148.80 on the 4-hour chart.
- EUR/USD is consolidating gains above the 1.0800 resistance zone.
- Bitcoin is facing many hurdles near the $85,000 resistance zone.
USD/JPY Technical Analysis
The US Dollar remained in a bearish zone below 148.80 against the Japanese Yen. USD/JPY extended losses below 147.50 before the bulls appeared.
Looking at the 4-hour chart, the pair tested the 146.60 zone and settled below the 100 simple moving average (red, 4-hour) and the 200 simple moving average (green, 4-hour). The pair started a minor recovery wave above the 147.50 level.
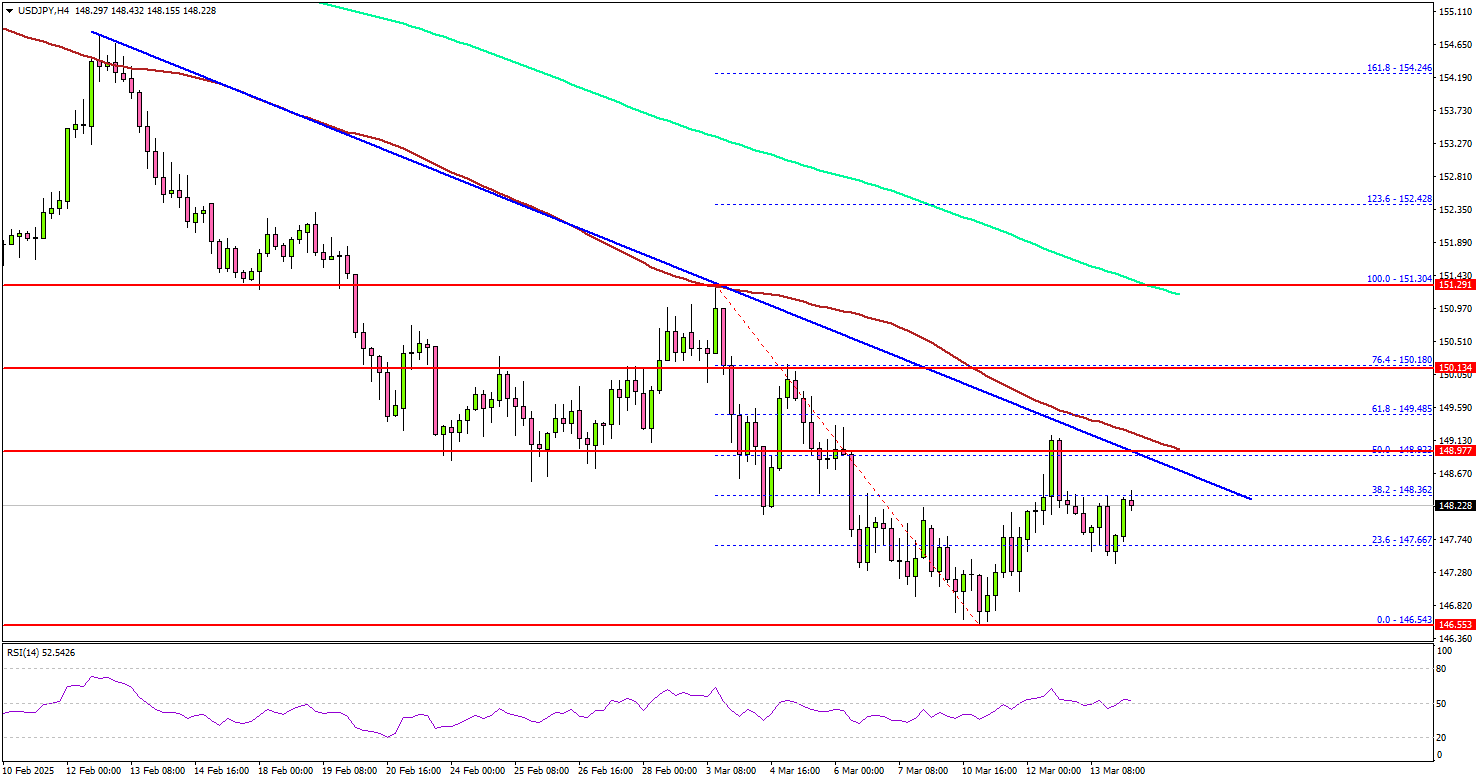
There was a spike above 148.50 but the bears were active near the 50% Fib retracement level of the downward move from the 151.30 swing high to the 146.63 low.
On the upside, the pair is facing resistance near the 148.80 level. There is also a major bearish trend line forming with resistance at 148.80 on the same chart. The next major resistance is near the 149.50 level and the 61.8% Fib retracement level of the downward move from the 151.30 swing high to the 146.63 low.
The main resistance is now forming near the 150.20 zone. A close above the 150.20 level could set the tone for another increase. In the stated case, the pair could even clear the 152.00 resistance.
On the downside, immediate support sits near the 147.50 level. The next key support sits near the 147.20 level. Any more losses could send the pair toward the 146.60 level. The main support could be 145.00.
Looking at EUR/USD, the pair remained stable and might soon now aim for a move toward the 1.1000 resistance.
Upcoming Economic Events:
- Michigan Consumer Sentiment Index for Mar 2025 (Prelim) – Forecast 63.4, versus 64.7 previous.
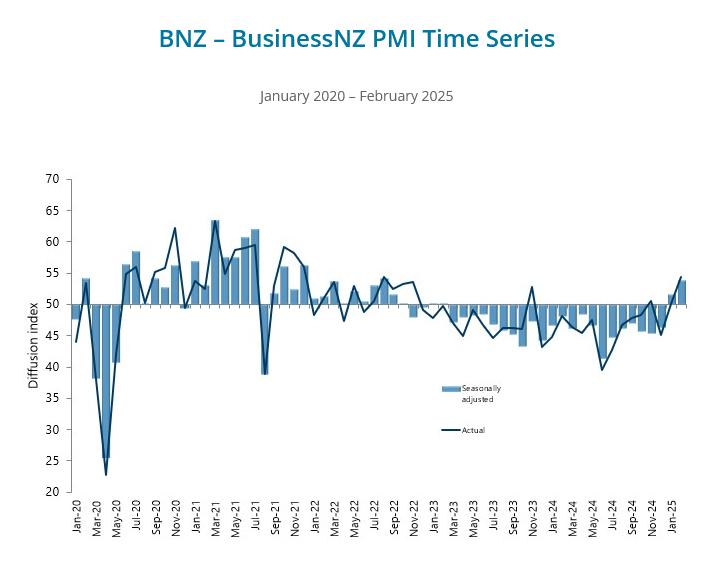
NZ BNZ manufacturing hits 53.9 as recovery gains unexpected momentum
New Zealand’s BusinessNZ Performance of Manufacturing Index rose from 51.7 to 53.9 in February, marking its highest level since August 2022.
This solid improvement was driven by stronger production (52.4) and new orders (51.5), both also reaching their best levels since August 2022. Meanwhile, employment surged to 54.0, climbing 3.2 points from January and hitting its highest level since September 2021.
Despite the stronger data, business sentiment remains cautious. The proportion of negative comments from respondents rose to 59.5% in February, up from 57.7% in January. Many manufacturers cited weak orders and sluggish sales as ongoing challenges, signaling that while expansion has resumed.
BNZ’s Senior Economist Doug Steel welcomed the sustained improvement, noting that "pickup may be a bit faster than we are currently forecasting".
Cliff Notes: Fickle Sentiment
Key insights from the week that was.
In Australia, the Westpac-MI Consumer Sentiment Index reported another encouraging lift, rising 4% from 92.2 in February to 95.9 in March. Easing cost-of-living pressures and the RBA’s decision to cut interest rates in mid-February supported the improvement in sentiment, following a few months of stabilisation around a ‘cautiously pessimistic’ level. The sub-indexes covering ‘family finances vs a year ago’ and ‘time to buy a major household item’ have been the chief laggards in the recovery to date, remaining well below long-run average levels. Constructive developments around inflation and interest rates are starting to turn the tide however, the sub-indexes rising 2.1% and 6.9% respectively in March. Forward-looking indicators are now all above their respective long-run averages which, along with positive views on the labour market, bodes relatively well for the economic outlook.
That said, the latest NAB business survey reminds us that the recovery is likely to be gradual and potentially bumpy. At +4, business conditions remained little changed at a below-average level in February, as firms reported a further deterioration in trading conditions and profitability. Given the persistence of this dynamic, business confidence continues to hover around a broadly neutral level, consistent with the notion that the pick-up in demand is likely to occur at a measured pace. While not fully apparent in the data yet, the fog of heightened trade tensions, coinciding with an upcoming federal election, is likely to keep businesses cautious in the near-term.
Offshore, the balance between growth and inflation is becoming increasingly precarious for central banks.
The US CPI came in below expectations in February, the headline and core measures both up 0.2% in the month and respectively 2.8% and 3.1% over the year. Food and energy inflation was negligible in the month. Within the core basket, shelter inflation eased to 0.3%, although that still equates to a 3.6% annualised rate which is elevated compared to history. Other services were neutral in the month, but inflation in this sub-sector remains stubbornly above target over the year. Core goods inflation also remained positive in the month, prices up 0.2% in February, ahead of the implementation of tariffs.
US trade policy meanwhile continues to escalate risks over the outlook for growth in the US, with President Trump holding fast to the planned full implementation of announced tariffs by 2 April and threatening to increase tariffs against any country who responds to the US’ measures. In particular, overnight President Trump threatened to impose a 200% tariff on wine, champagne and other alcoholic beverages from Europe if a proposed European tariff on US whiskey is implemented – itself a retaliation to the US' steel and aluminium tariffs which President Trump brought forward from 2 April to 12 March this week and has vowed no exemptions for. Consumer spending and confidence has been impacted to date, and there are numerous reasons to expect businesses to take a cautious approach to investment hence. Full detail on our US view will appear in the March Market Outlook on Westpac IQ later today.
With the risks to Canadian growth from US trade policy front and centre, the Bank of Canada this week lowered its policy rate by 25bps to 2.75%. While recent data has pointed to stronger-than-expected growth with inflation at target, downside risks are immediate and material. In short, growth is anticipated to be hampered by the tariffs directly through trade and due to deteriorating confidence amongst businesses and consumers. Businesses are reportedly delaying hiring and investment decisions and are also looking to change suppliers and keep more inventory on hand, adding to costs. At the same time, tariff news has also raised inflation expectations which the Bank is paying close attention to. In the press conference, Governor Macklem emphasised the importance of keeping inflation expectations anchored and avoiding second-round effects. On future moves, uncertainty was a key theme with Macklem not ruling out a hike or a recession given the uncertainty surrounding US trade policy.
Finally to Japan, wages data showed a 2.7% increase in base pay in January, led by the manufacturing sector. While nominal wages continue to increase, real wages fell 1.8%yr. RENGO had negotiated a wage increase of 3.6% for FY24 (ending March 2025) and employees have seen their nominal wages increase through this period. However, with inflation slow in abating, real wages have failed to gain, putting household spending at risk. This week, Q4 GDP was revised down to 2.2% annualised from a preliminary reading of 2.8%. The downshift came in part due to downward estimates to households spending which is now flat for Q4.
Still, Bank of Japan officials have continued to signal that rates will rise further, anticipating growth will pick up through the latter part of the year. Adding support to their considerations will be RENGO's announcement of the first estimate of the wage bargaining result. RENGO demanded an increase of 6.0% and this first estimate will mostly cover results from large companies. So far, large manufacturers such as Mitsubishi, Nippon and Toyota among others have reportedly met RENGO's demand. While this is positive news, the focus will be on how small businesses fare, data for which will be released over the next month. The BoJ is likely to remain on hold at its meeting next week waiting to digest more data and the outlook for small businesses first before making their next move. With a fresh set of forecasts and greater clarity around trade risks, their next hike will likely come in May.
Is Bitcoin (BTC/USD) Heading Lower? Examining Mt. Gox, Tariffs, and Technical Indicators
- Bitcoins price volatility has been impacted by Trump’s tariff policies, recession fears and Mt. Gox Transfers.
- Glassnodes’s accumulation trend score shows shifts in investor sentiment and increased selling pressure.
- Mt. Gox transfers are affecting markets but are overshadowed by tariff concerns.
Bitcoin’s rollercoaster ride continues as President Donald Trump and his tariff policies ramp up and weigh on overall market sentiment. The bitcoin price has been flirting with the $80,000 per bitcoin handle, dragging down the wider crypto market that’s now erased $1 trillion of value in just a month.
The hype around President Trump and his pro-crypto policies have faded as the effects of a global trade war take hold of financial markets. The tariff proposals by President Trump has for now cast a shadow over markets with BlackRock CEO Larry Fink stating that If people become more focused on supporting their own country, often referred to as nationalism, it could lead to higher inflation. This isn’t necessarily a bad thing, as some might find it appealing, but it would likely have an impact on prices.
Fears of a recession have also ramped up and thus weighing on crypto markets. Goldman Sachs economists have increased the chances of a recession in the next year from 15% to 20%. They pointed to Trump’s economic policies as the main concern. Yardeni Research economists also raised their recession estimate, from 20% to 35%, blaming Trump’s rapid actions with executive orders, firings, and tariffs.
Crypto Heatmap, March 13, 2025
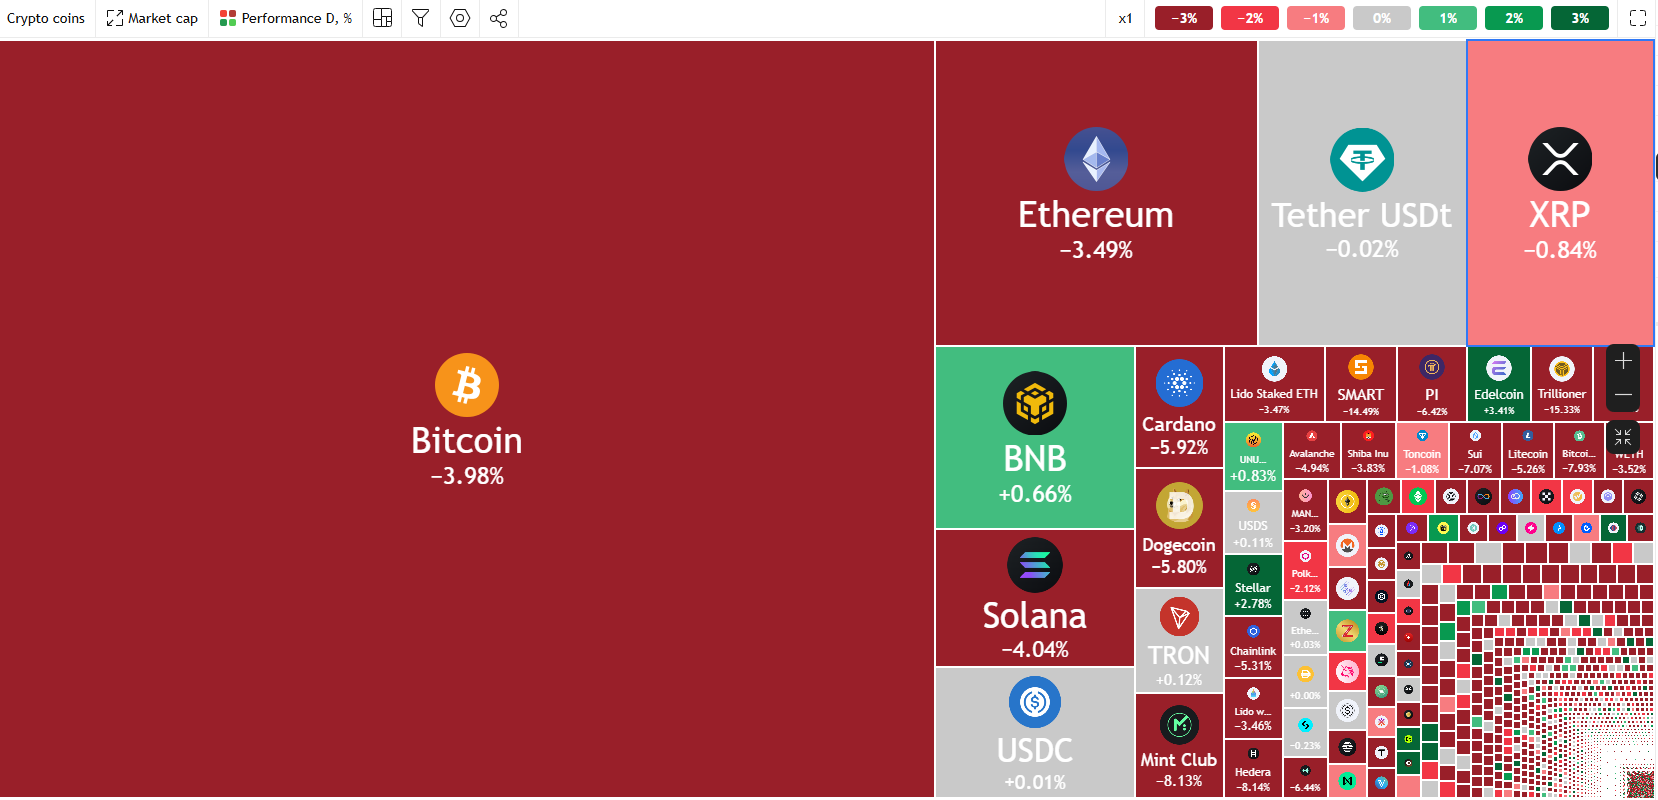
Source: TradingView (click to enlarge)
Was Mt. Gox Responsible for the Recent Selloff?
According to Look on chain, Mt. Gox moved 11,834 bitcoins this month, including 11,502 to an unknown wallet.
A recent transfer of $1.07 billion in March, followed by a complex repayment process starting in July 2023 and ending on October 31, has raised questions. Why now? The timing may be tied to the legal details of creditor repayments.
Every action from Mt. Gox still rattles the crypto world, even years after its 2014 bankruptcy. The platform still holds significant influence over the market.
However, so far, no large sell-offs have followed these repayments. Creditors, many of whom are experienced “hodlers,” appear to take a cautious approach rather than panicking. The extension of the repayment deadline to October 2024, announced at the end of 2023, has brought some relief. But the market operates on fear and instinct, and Mt. Gox continues to stir uncertainty. Fear, after all, often builds on itself.
Some bitcoins were moved to a hot wallet, which is often used for quick access to funds and could suggest a future sale. However, most of the bitcoins ended up in a “new wallet,” likely as a temporary step before being distributed further. This seems to be a cautious approach rather than an aggressive one. Still, the market tends to overreact, treating every unknown wallet as a potential threat and every transaction as a warning sign.
Thus the question is whether this was the reason for the selloff in crypto markets. While I believe this played a part, the ongoing pressure on Bitcoin prices is more indicative of fear across markets rather than a Mt.Gox situation.
Looking back at the market’s reaction during previous Mt. Gox moves and it is clear that the moves did not have a long lasting impact on crypto prices. The current decline and lack of a sustainable recovery suggest a different dynamic this time around.
Glassnode – The Week On-Chain
Bitcoin’s price cycles move between phases of buying (accumulation) and selling (distribution), with money shifting between different groups of investors over time. The Accumulation Trend Score measures these changes, with scores near 1 (dark purple) showing strong buying activity and scores near 0 (yellow) showing selling activity.
The chart shows that after periods of heavy accumulation, selling phases often follow, leading to weaker price movements. The most recent selling phase started in January 2025, matching Bitcoin’s drop from $108,000 to $93,000.
Right now, the Accumulation Trend Score is below 0.1, indicating ongoing strong selling pressure.
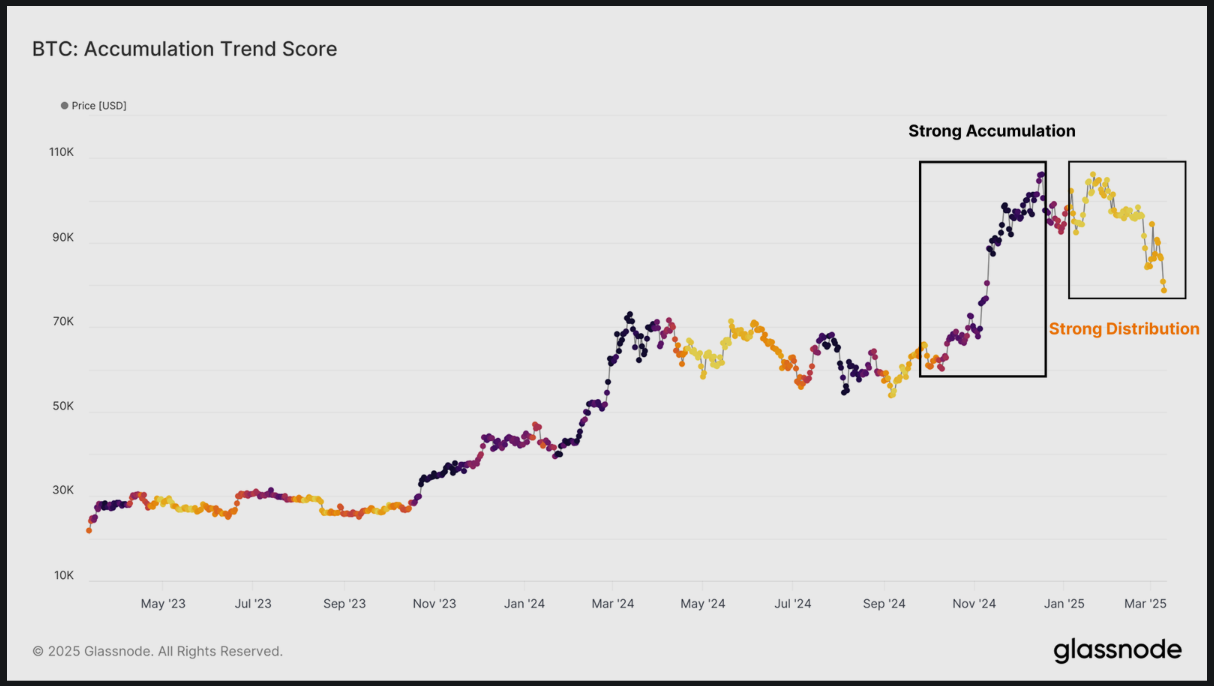
Source: Glassnode (click to enlarge)
The Accumulation Trend Score tracks how total Bitcoin balances on the blockchain are changing. However, it is influenced more by the actions of big players and doesn’t show where the Bitcoin was bought. While it’s useful for spotting general buying or selling trends, it doesn’t provide detailed information about key price levels where Bitcoin was acquired.
The cost-basis of Short-Term Holders (STH) shows that market momentum has turned negative, with less demand and growing uncertainty among investors.
Signs of fear-driven selling are clear, as the STH-SOPR (a measure showing profit or loss for short-term sellers) stays below 1, meaning most are selling at a loss. At the same time, STH-CDD (a measure of recent-holder activity) has jumped, showing more selling by short-term investors.
This wave of selling matches the market trading near its lower range. Many recent buyers are likely feeling significant financial pressure during this time.
All of the above does not currently inspire confidence for a sustained bullish move. The biggest takeaway and something which we are seeing in US Equity markets is the lack of dip-buying this time around. Not a surprise as markets are currently in a phase of capital preservation and risk aversion with no end in sight given the pending universal tariffs being proposed by the Trump administration.
It looks like a bumpy road ahead, so strap in and enjoy the ride.
Technical Analysis – BTC/USD
Bitcoin (BTC/USD) from a technical standpoint on the daily timeframe remains in a bearish trend.
A daily candle close above the 90000 handle will be needed for a change in structure and this remains some distance away at present.
Today it was the 200-day MA which served as a significant area of resistance and capped yesterdays attempted rally to the upside as well.
The decline today, found support at the 80000 handle with a brief foray below being met with some buying pressure. However, the daily candle closed as a bearish engulfing candle which hints at further downside ahead.
Looking at the potential of a break to the downside and we have support at the 78197 handle before the 75000 handle comes into focus. Below the 75000 mark the swing high from October 2024 at 73777 may be a key area to keep an eye on.
A move higher from current prices may find resistance at 82133 and the 200-day MA at 83636. Next focus will shift to the 85000 handle and the 90000 handle respectively.
Bitcoin (BTC/USD) Daily Chart, March 13, 2024
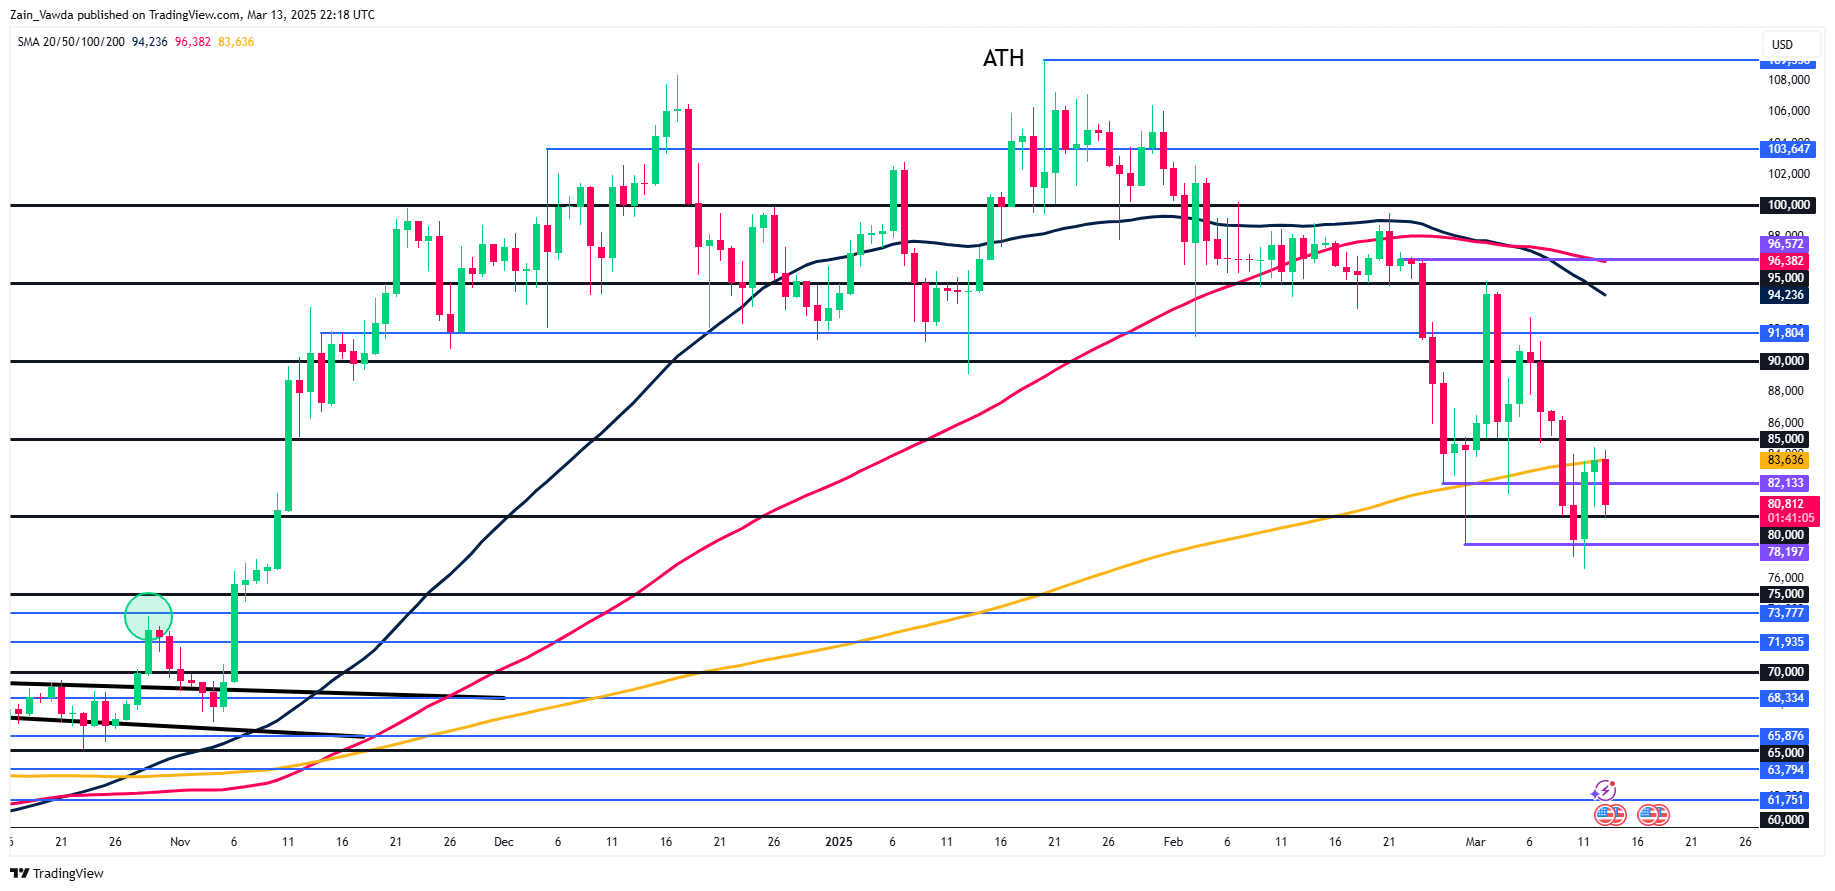
Source: TradingView.com (click to enlarge)
Support
- 80000
- 78197
- 75000
Resistance
- 82133
- 83636 (200-day MA)
- 85000
GOLD (XAUUSD) Elliott Wave: Forecasting the Rally From Equal Legs Area
Hello fellow traders,
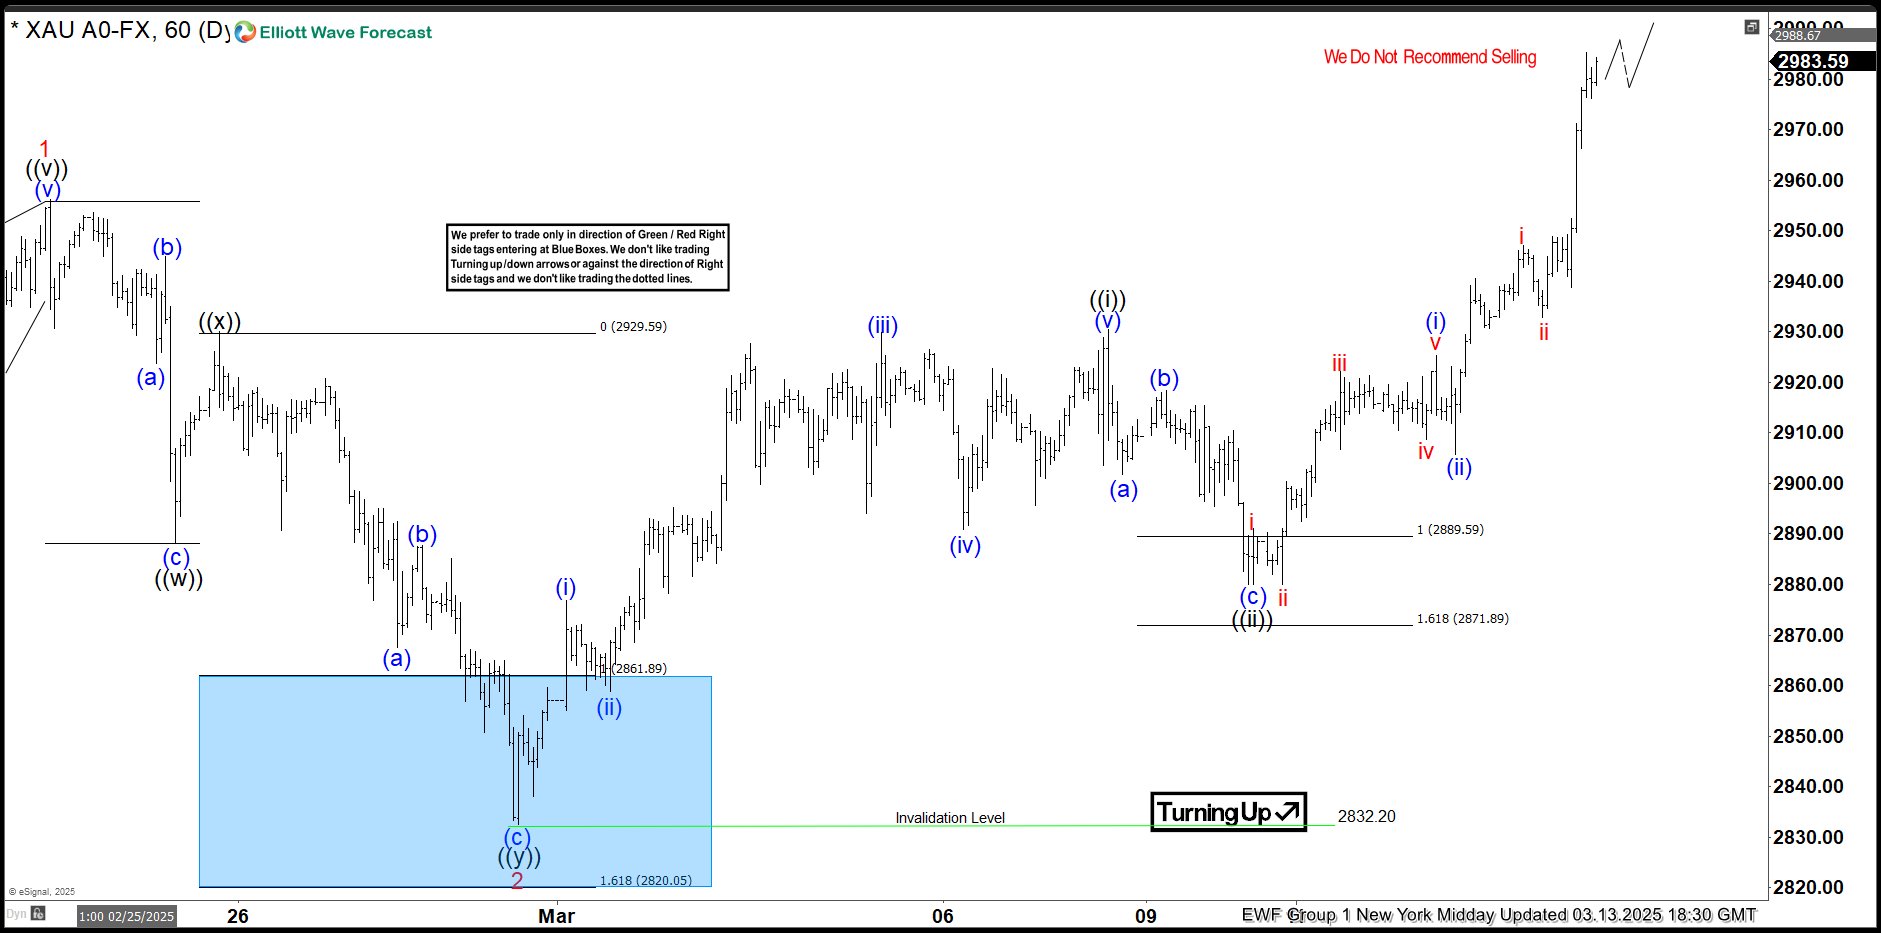
In this technical article, we are going to present Elliott Wave charts of GOLD (XAUUSD) . As our members know we are long in GOLD from previous equal legs area. As a result, members are enjoying profits in risk-free positions. Recently ,the commodity completed its intraday correction at the Equal Legs zone. In the following sections, we will explain the Elliott Wave count.
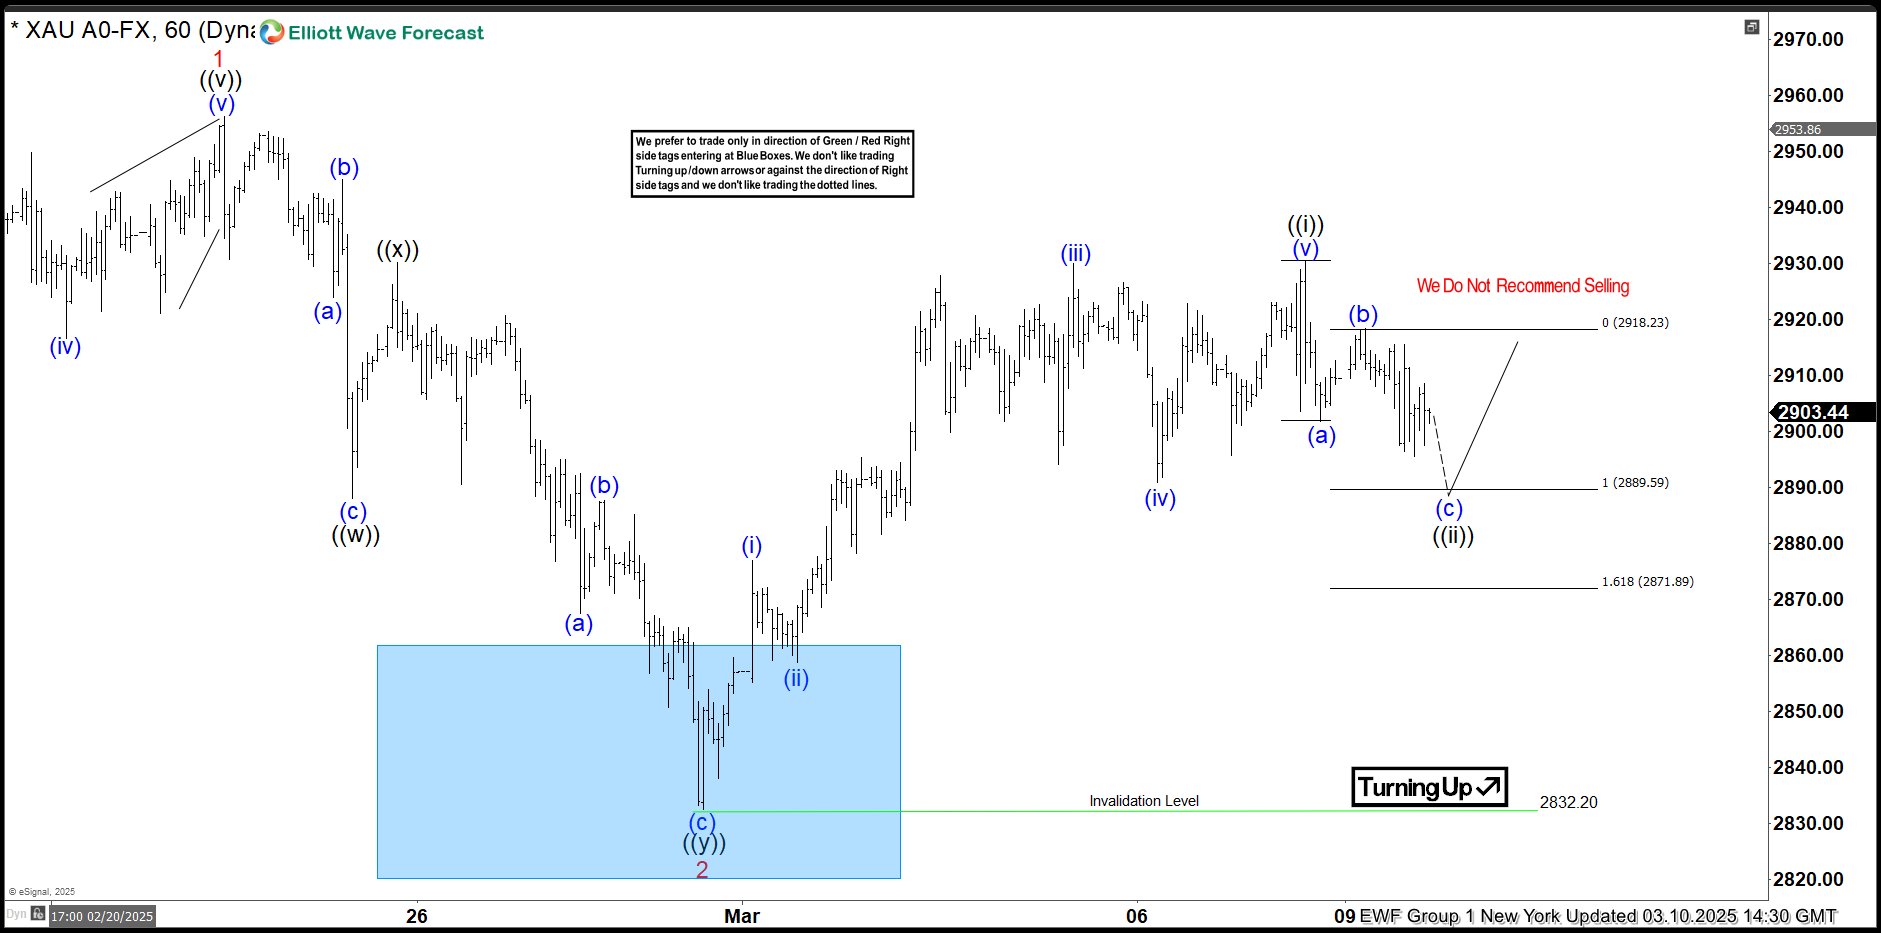
GOLD Elliott Wave 1 Hour Chart 03.10.2025
The current view suggests XAUUSD has completed a 5-waves pattern in the cycle from the 2832.2 low. GOLD is now forming a wave ((ii)) black correction. The price shows an incomplete sequence in the decline from the peak. This suggests more short-term weakness. We expect an extension toward the extreme zone at 2889.59–2871.89. At that zone buyers should re-enter, which could lead to a further rally. We recommend that members avoid selling gold.
Official trading strategy on How to trade 3, 7, or 11 swing and equal leg is explained in details in Educational Video, available for members viewing inside the membership area.
GOLD Elliott Wave 1 Hour Chart 03.04.2025
The commodity made another leg down toward the Equal Legs area and found buyers, as expected. XAUUSD is now showing a solid rally from the buying zone. The price has broken to new highs. This confirms further upward extension, provided the pivot at the 2832 low holds.
EURGBP Wave Analysis
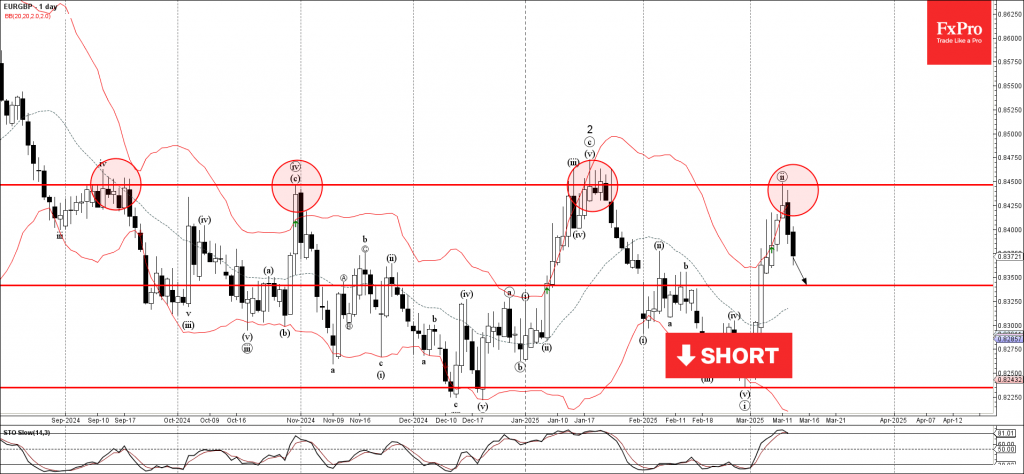
EURGBP: ⬇️ Sell
- EURGBP reversed from key resistance level 0.8450
- Likely to fall to support level 0.8340
EURGBP currency pair recently reversed down with the daily Shooting Star from the resistance area between the key resistance level 0.8450 (which has been reversing the price from September) and the upper daily Bollinger Band.
The downward reversal from this resistance area stopped the earlier short-term ABC correction ii from the end of February.
Given the strength of the resistance level 0.8450 and the overbought daily Stochastic, EURGBP currency pair can be expected to fall to the next support level 0.8340.
Gold Wave Analysis
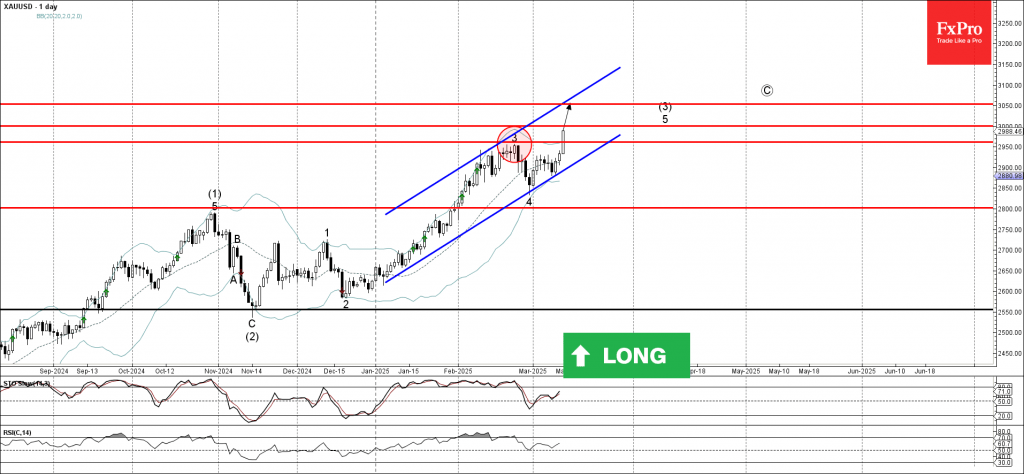
Gold: ⬆️ Buy
- Gold broke resistance level 2962.00
- Likely to rise to resistance level 3000.00
Gold rose sharply after breaking above the resistance level 2962.00 (top of the previous sharp upward impulse wave 3 from the end of February).
The breakout of the resistance level 2962.00 continues the active impulse wave 5 of the extended upward impulse sequence (3) from November.
Given the clear daily uptrend, Gold can be expected to rise to the next round resistance level 3000.00 – the breakout of which can lead to further gains toward 3050.00.