Sample Category Title
USD/CHF Weekly Outlook
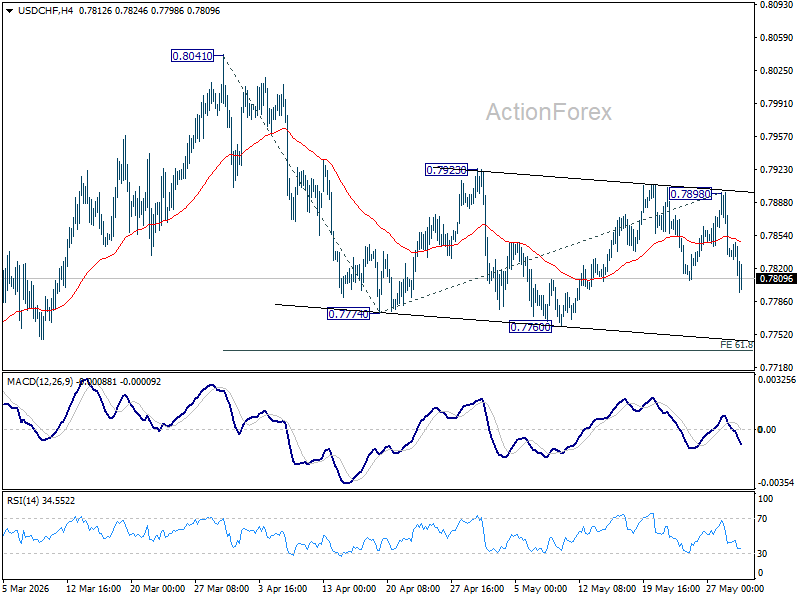
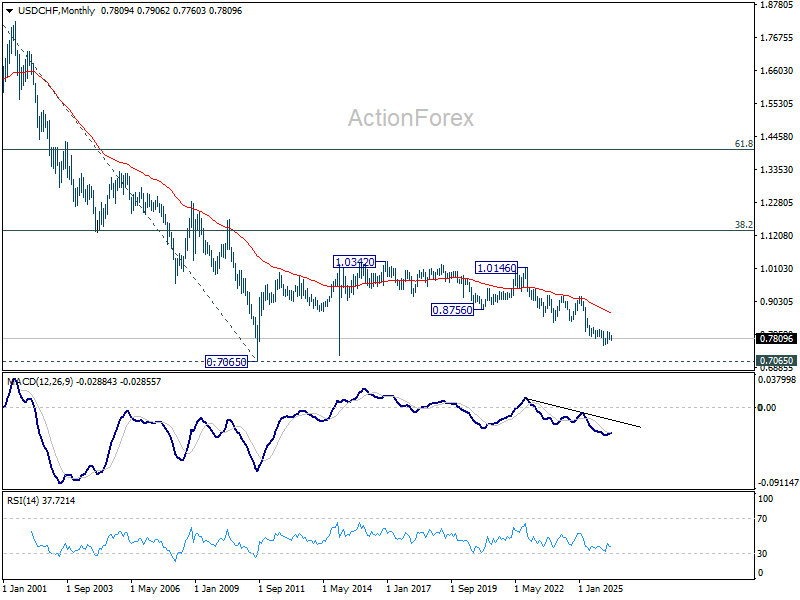
The late break of 0.7807 support suggests that USD/CHF's corrective rebound has completed. Initial bias is back on the downside this week for retesting 0.7760 first. Firm break there will resume the fall from 0.8041. Next target will be 61.8% projection of 0.8041 to 0.7774 from 0.7898 at 0.7733. Risk will now stay on the downside as long as 0.7898 resistance holds, in case of recovery.
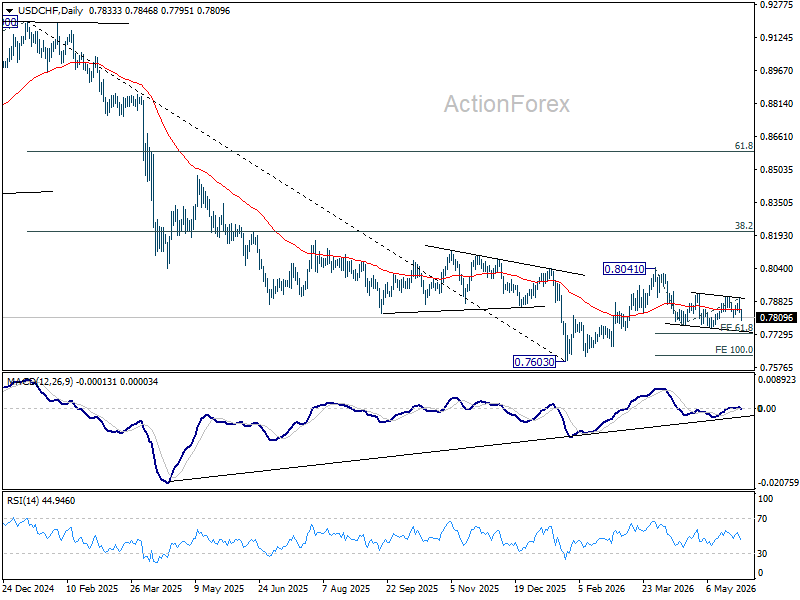
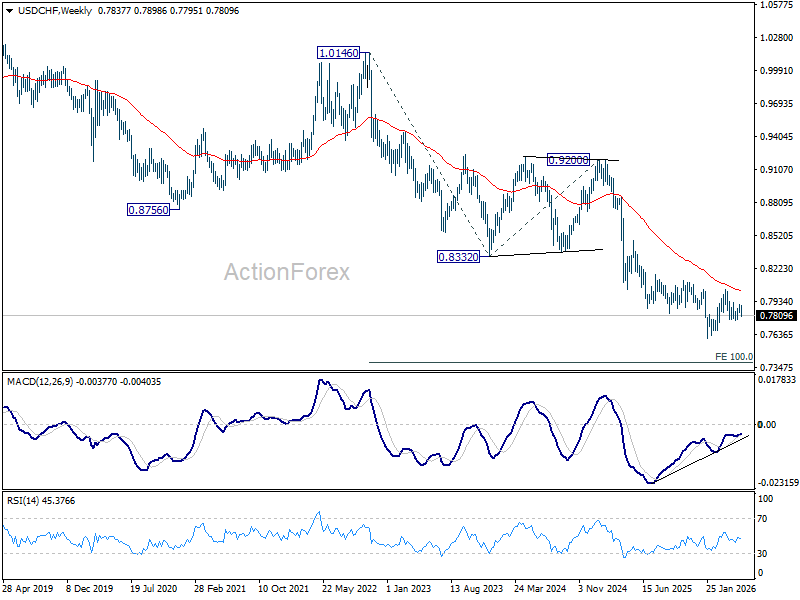
In the bigger picture, as long as 55 W EMA (now at 0.8028) holds, fall from 0.9200 is expected to continue, as part of the larger down trend. Firm break of 0.7603 will target 100% projection of 1.0146 (2022 high) to 0.8332 from 0.9200 at 0.7382.
In the long term picture, price action from 0.7065 (2011 low) are seen as a corrective pattern to the multi-decade down trend from 1.8305 (2000 high). It's uncertain if the fall from 1.0342 is the second leg of the pattern, or resumption of the downtrend. But in either case, outlook will stay bearish as long as 0.8756 support turned resistance holds (2021 low). Retest of 0.7065 should be seen next.
AUD/USD Weekly Report
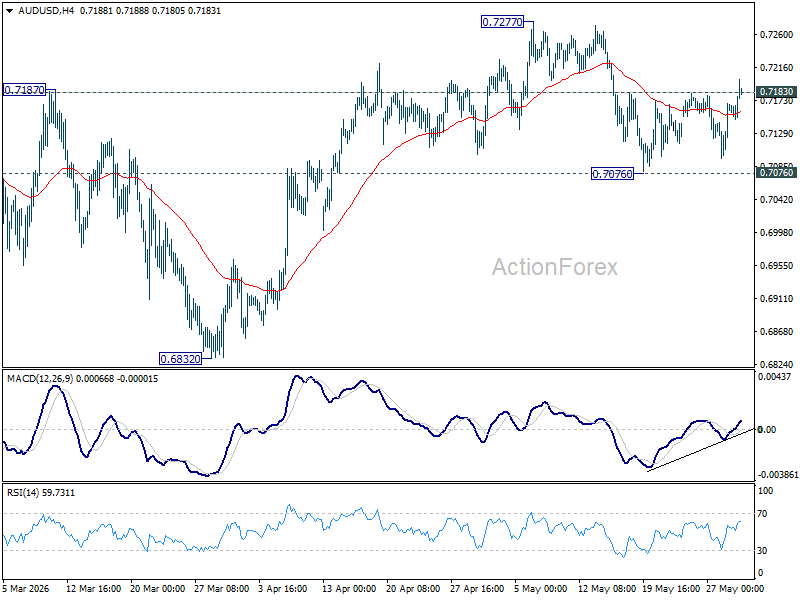
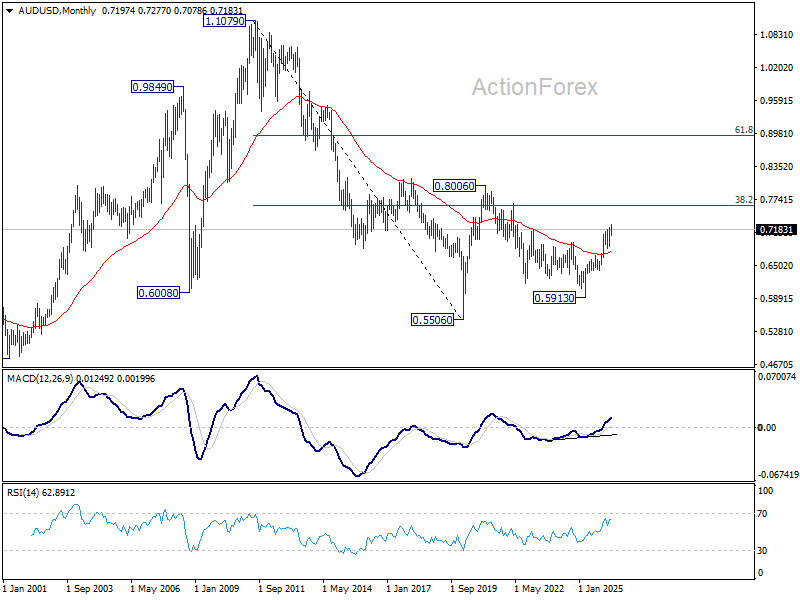
AUD/USD's late break of 0.7183 resistance suggests that pullback from 0.7277 has already completed at 0.7076, after defending 55 D EMA. Initial bias is back on the upside this week for retesting 0.7277 high first. Firm break there will resume larger up trend. For now, risk will stay on the upside as long as 0.7076 support holds, in case of retreat.
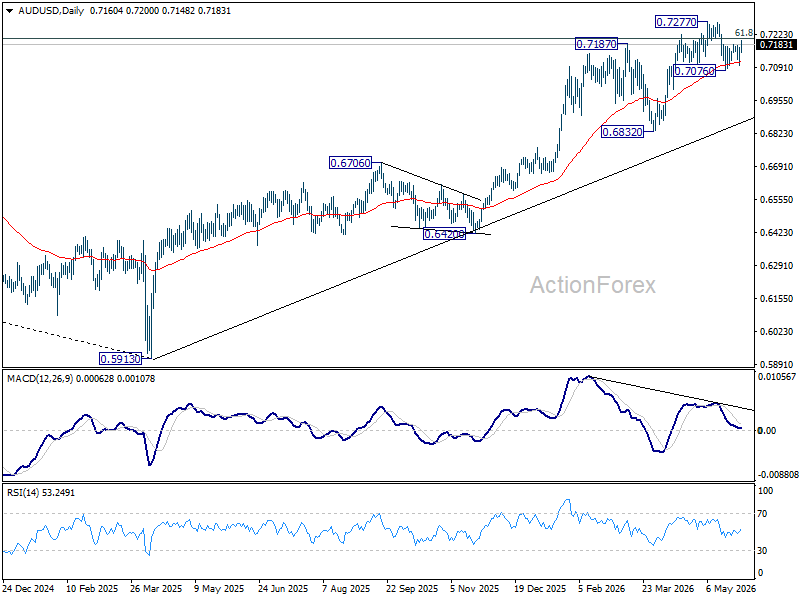
In the bigger picture, rise from 0.5913 (2024 low) is still in progress. Decisive break of 61.8% retracement of 0.8006 to 0.5913 at 0.7206 will solidify the case that it's already reversing the down trend from 0.8006 (2021 high). Further rally should then be seen to retest 0.8006. For now, outlook will remain bullish as long as 0.6832 support holds, in case of pullback.
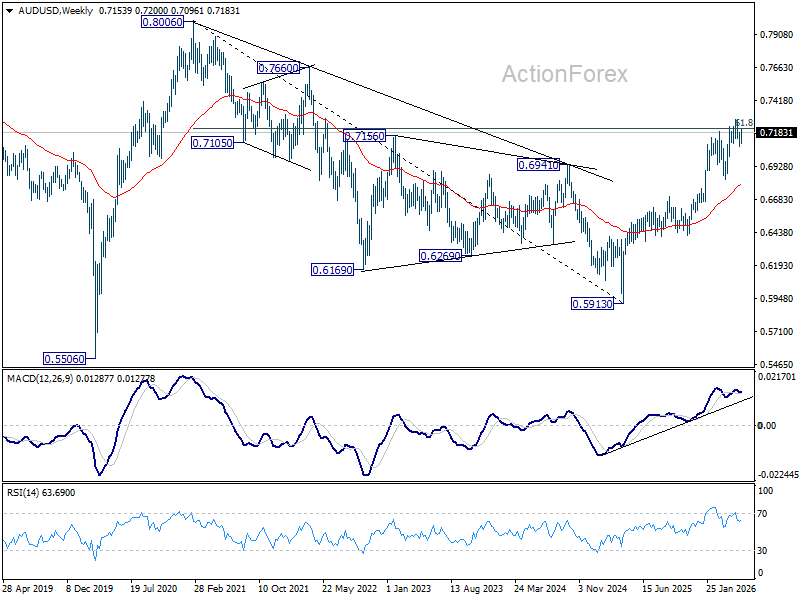
In the long term picture, rise from 0.5913 is seen as the third leg of the whole pattern from 0.5506 (2020 low). It's still early to judge if this is an impulsive or corrective pattern. But in either case, further rise should be seen back to 0.8006 and possibly above. This will remain the favored case as long as 55 W EMA (now at 0.6804) holds.
USD/CAD Weekly Outlook
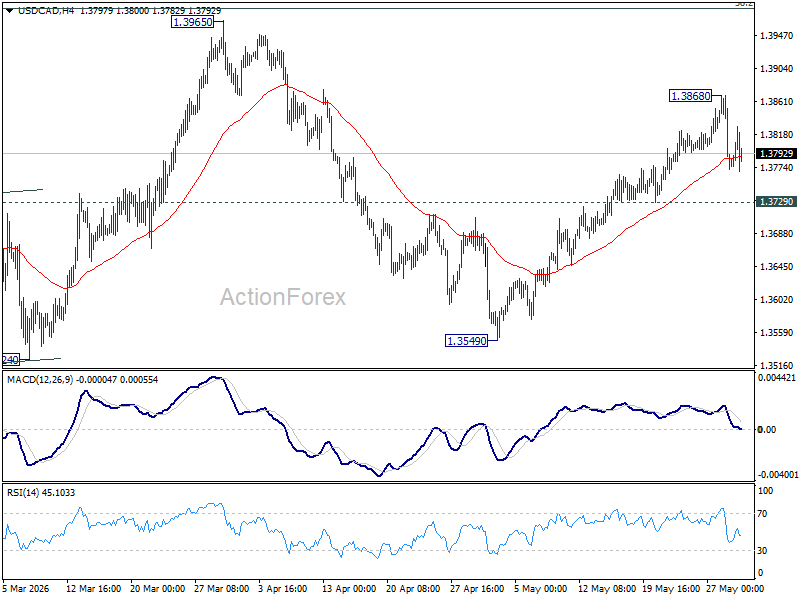
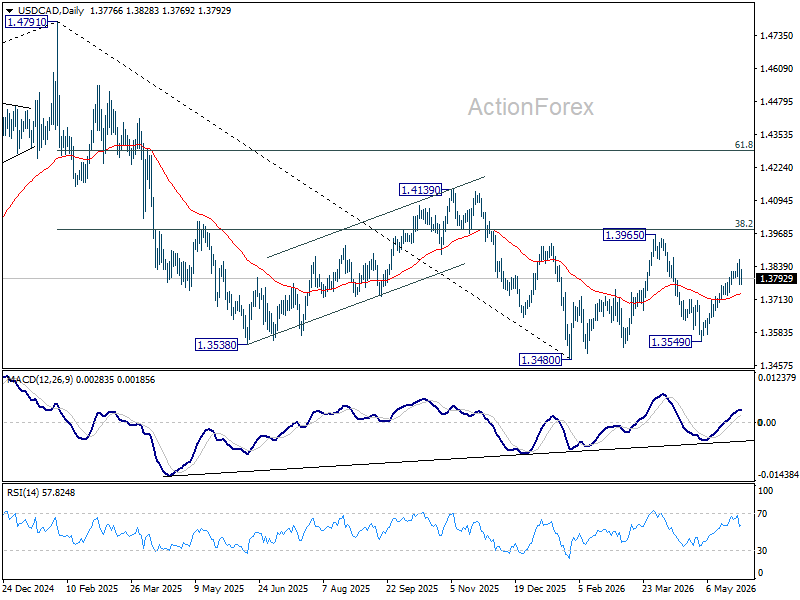
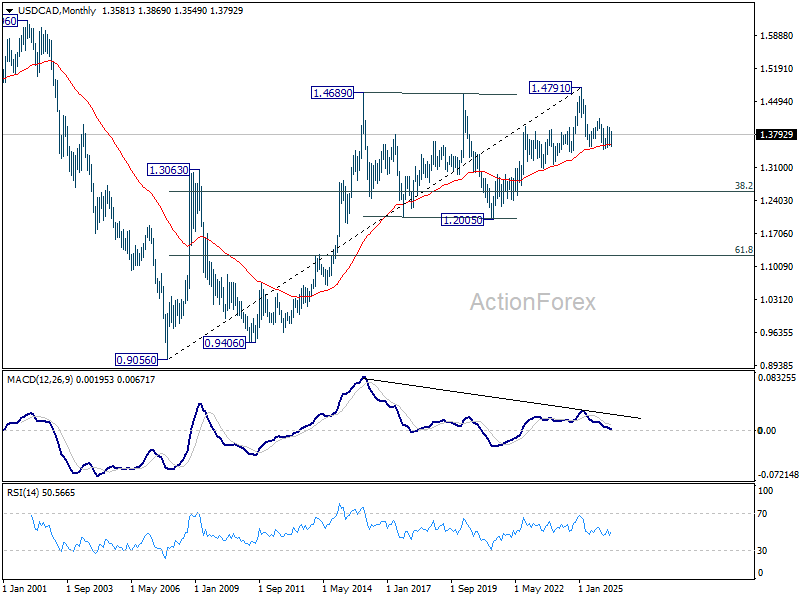
USD/CAD retreated after rising to 1.3868 last week. Initial bias remains neutral this week first. Further rise is expected with 1.3729 support intact. Rise from 1.3549 is seen as the third leg of the pattern from 1.3480. Above 1.3868 will target 1.3965 resistance next. Break of 1.3729 will suggest that the rebound has completed, and turn bias back to the downside.
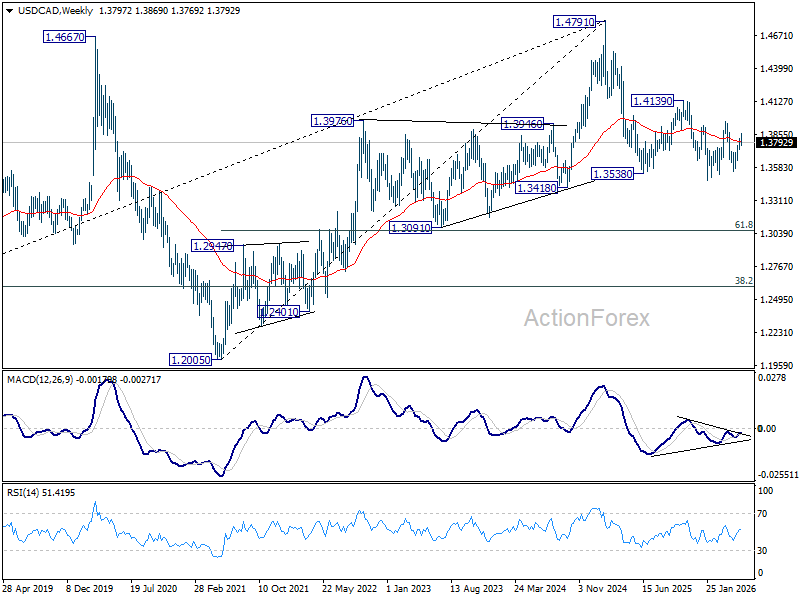
In the bigger picture, price actions from 1.4791 are seen as a corrective pattern to the whole up trend from 1.2005 (2021 low). Deeper fall could be seen, as the pattern extends, to 61.8% retracement of 1.2005 to 1.4791 at 1.3069. However, decisive break of 38.2% retracement of 1.4791 to 1.3480 at 1.3981 will argue that the correction has completed with three waves down to 1.3480 already.
In the long term picture, rising 55 M EMA (now at 1.3588) remains intact. Thus, up trend from 0.9056 (2007 low) could still be in progress. However, considering bearish divergence condition M MACD, sustained trading below 55 M EMA will argue that the up trend has completed with five waves up to 1.4791, and turn medium term outlook bearish for correction to 38.2% retracement of 0.9056 to 1.4791 at 1.2600.
GBP/JPY Weekly Outlook
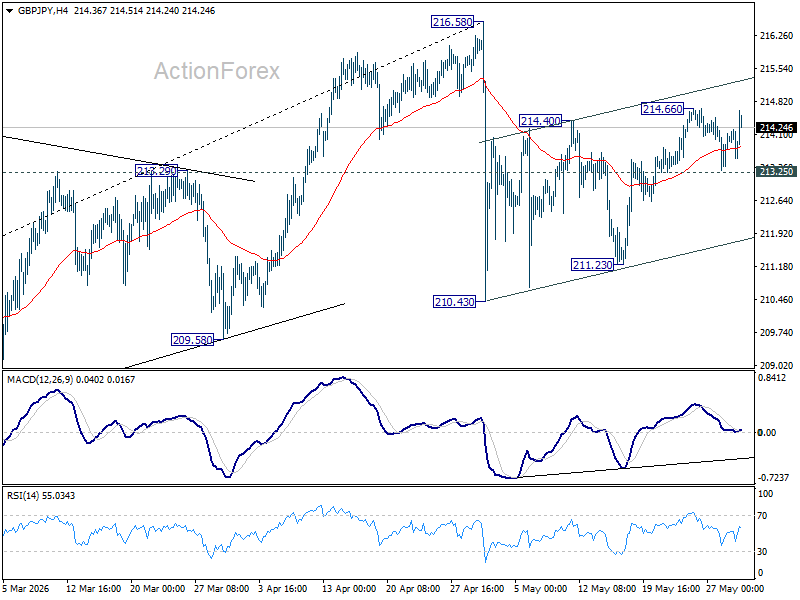
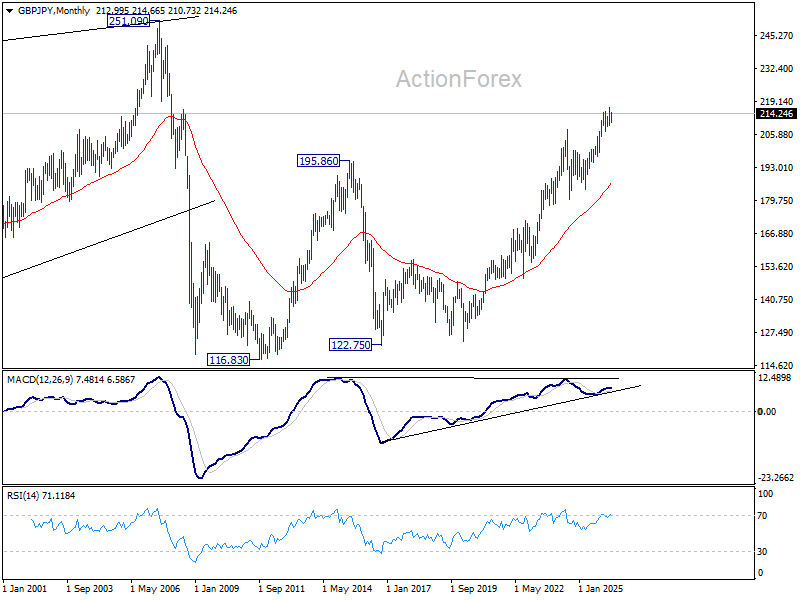
GBP/JPY edged higher to 214.66 last week but retreated since then. Initial bias remains neutral this week first. On the upside, above 214.66 will extend the rebound from 210.43 to retest 216.58 high. Strong resistance is expected there to bring reversal to extend the corrective pattern from 216.58 with another falling leg. On the downside, below 213.25 support will bring deeper fall back to 211.23.
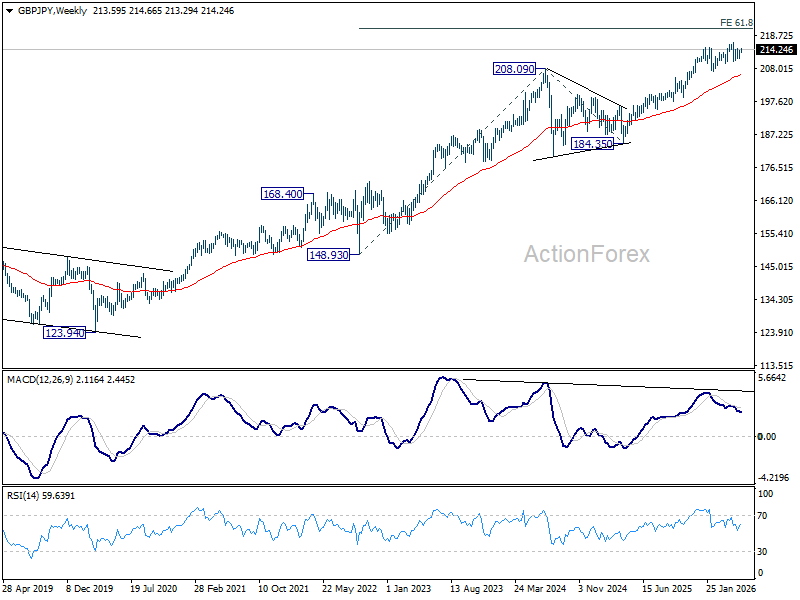
In the bigger picture, while the fall from 216.58 was steep, there is no clear sign of trend reversal yet. The long term up trend could still extend to 61.8% projection of 148.93 (2022 low) to 208.09 (2024 high) from 184.35 at 220.90 on resumption. However, sustained break of 55 W EMA (now at 205.97) will argue that it's already in medium term down trend for 184.35 support.
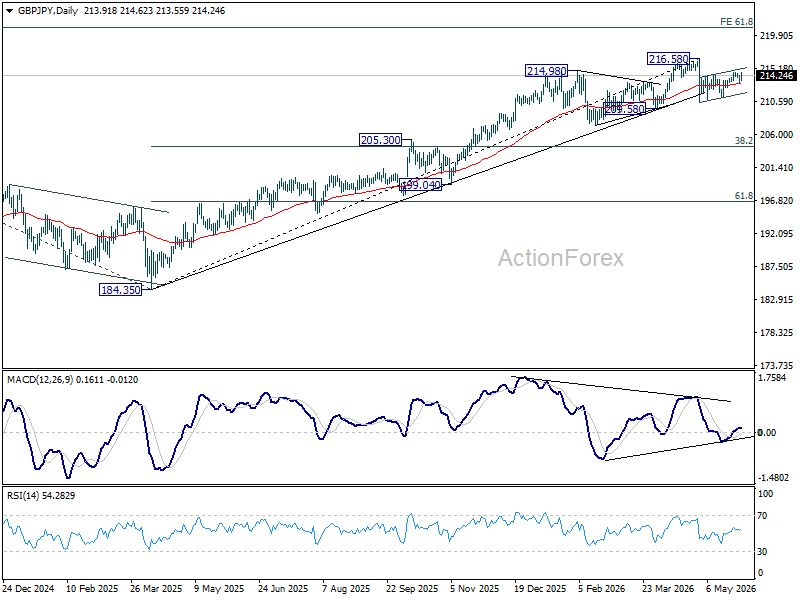
In the long term picture, up trend from 116.83 (2011 low) is in progress. Next target is 251.09 (2007 high). This will remain the favored case as long as 55 M EMA (now at 186.82) holds.
EUR/JPY Weekly Outlook
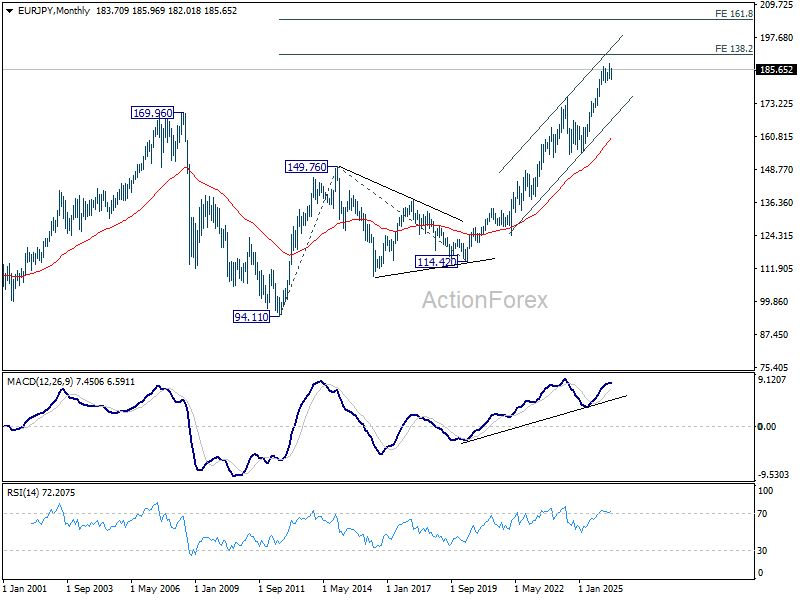
EUR/JPY's rally from 182.01 resumed and continued last week despite interim retreat. Initial bias is back on the upside this week for retesting 187.93 high. Strong resistance would be seen from there to bring reversal, to extend the corrective pattern from 187.93 with another falling leg. For now, risk will stay on the upside as long as 184.42 support holds, in case of retreat.
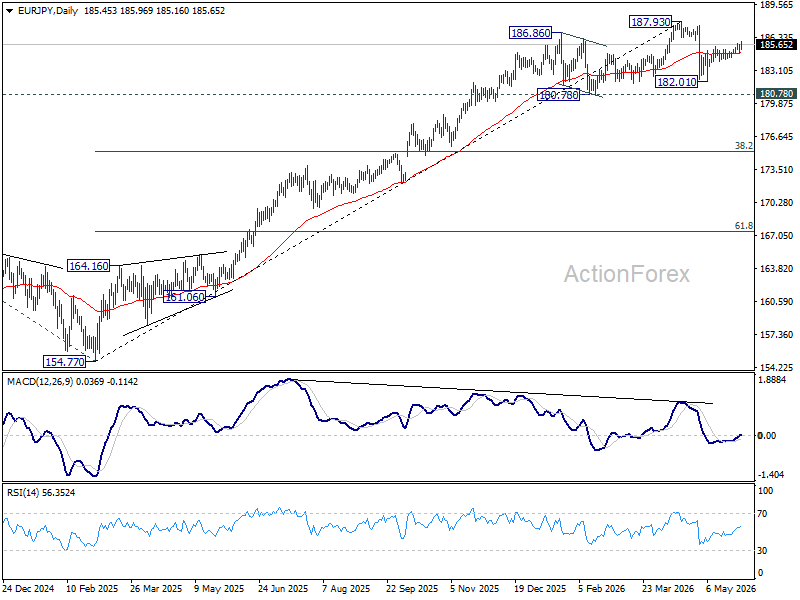
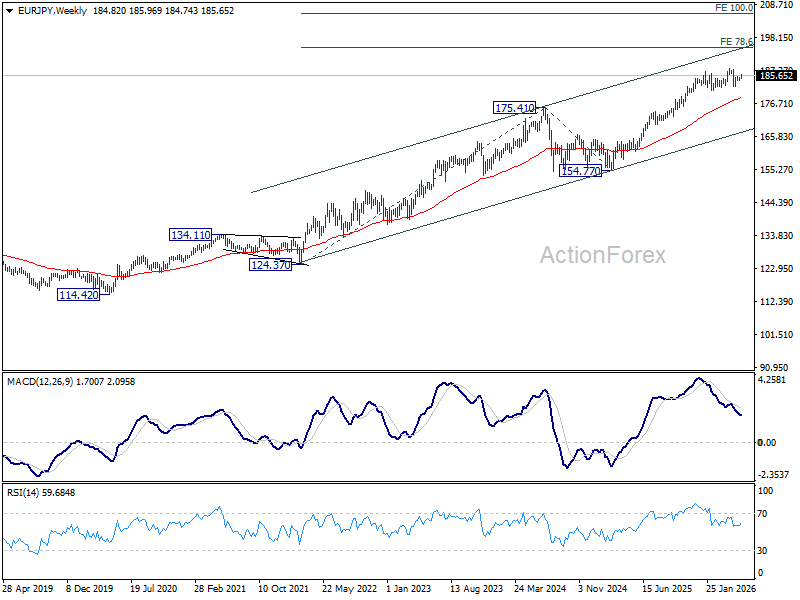
In the bigger picture, the pullback from 187.93 was steep, there is no sign of reversal yet. Uptrend from 114.42 (2020 low) is still expected to resume at a later stage to 78.6% projection of 124.37 (2022 low) to 175.41 (2025 high) from 154.77 at 194.88. However, sustained break of 55 W EMA (now at 178.53) will argue that it's already in a medium term down trend to 175.41 resistance turned support and below.
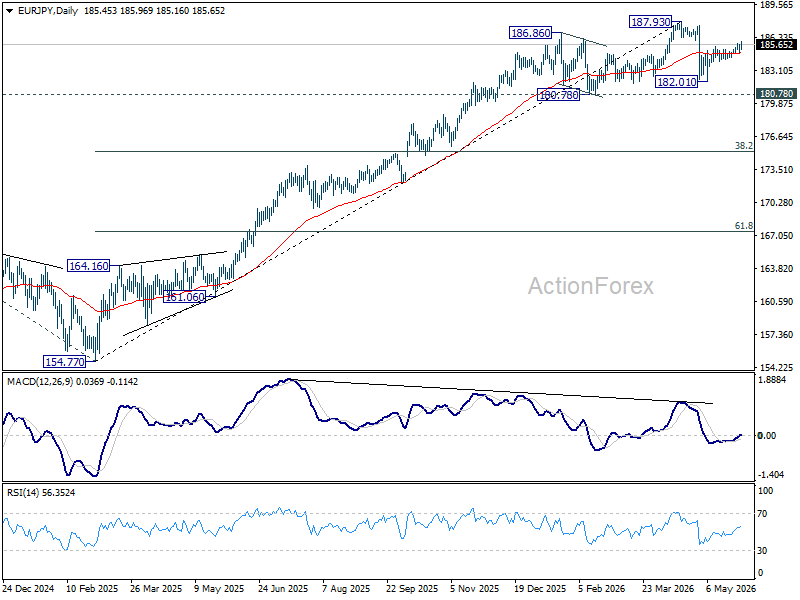
In the long term picture, up trend from 94.11 (2021 low) is in progress. Next target is 138.2% projection of 94.11 to 149.76 (2014 high) from 114.42 (2020 low) at 191.32. This will remain the favored case as long 55 W EMA (now at 178.53) holds.
EUR/GBP Weekly Outlook
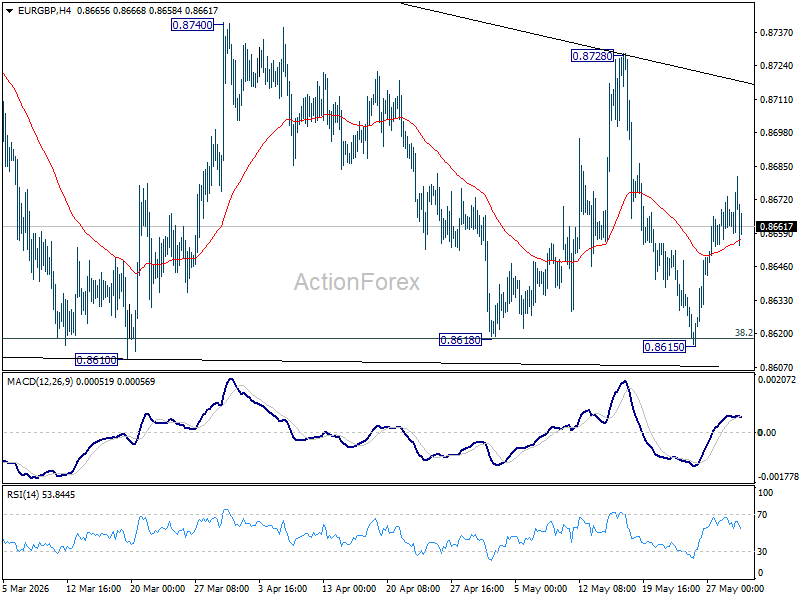
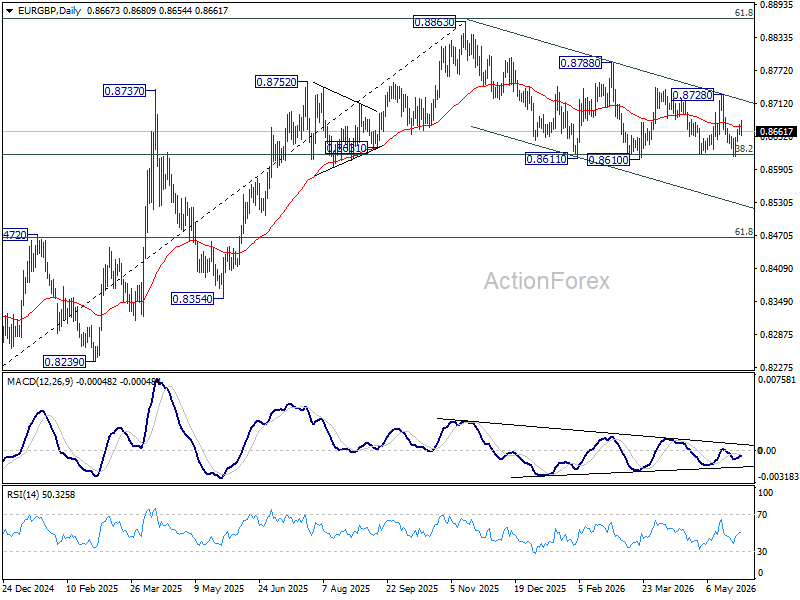
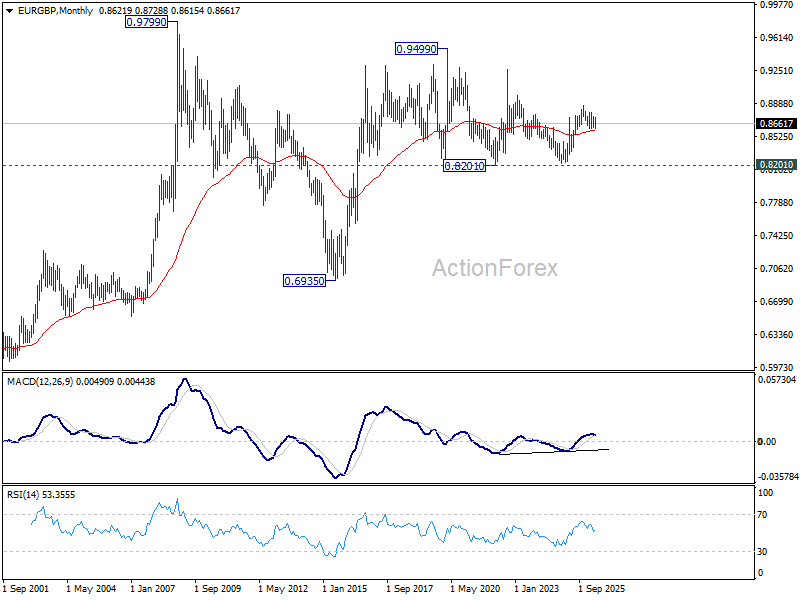
EUR/GBP continued to engage in sideway trading last week and outlook is unchanged. Initial bias remains neutral this week first. On the downside, decisive break of 0.8610 support will revive the case of bearish trend reversal. On the upside, break of 0.8728 resistance will bring stronger rally back towards 0.8740 resistance.
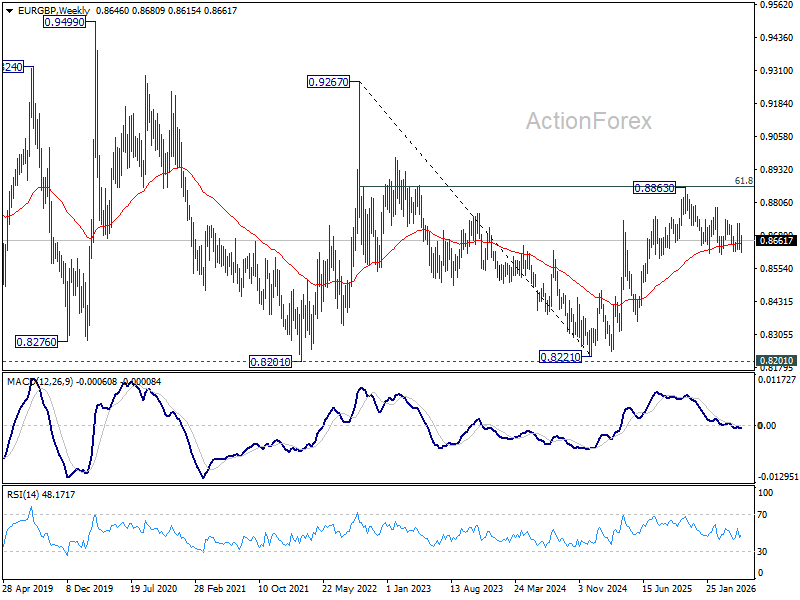
In the bigger picture, focus is staying on 38.2% retracement of 0.8821 to 0.8863 at 0.8618. Strong rebound from there will retain medium term bullishness. Rise from 0.8221 should resume through 0.8863 at a later stage. Nevertheless, sustained break of 0.8618 will confirm that whole rise from 0.8221 has completed at 0.8863. Deeper decline should then be seen to 61.8% retracement at 0.8466 at least.
In the long term picture, price action from 0.9499 (2020 high) is seen as part of the long term range pattern from 0.9799 (2008 high). Range trading should continue between 0.8201 and 0.9499, until there is clear signal of imminent breakout.
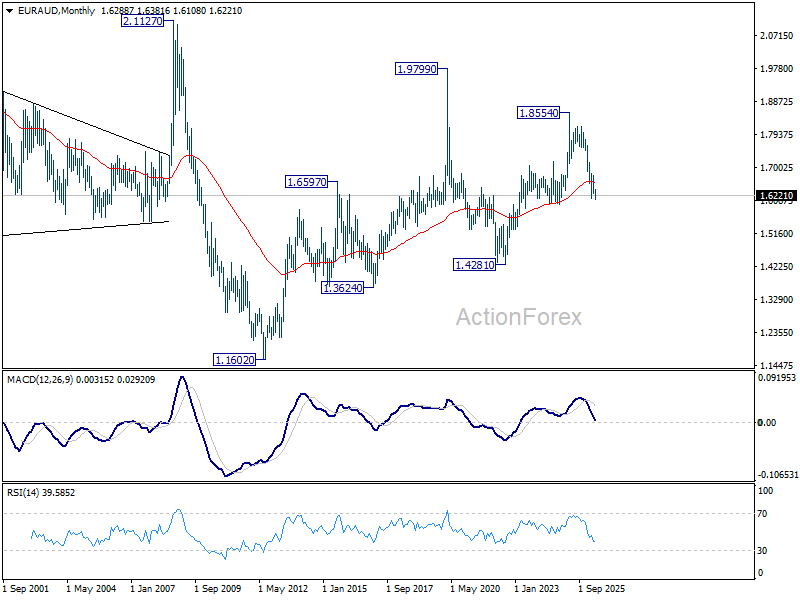
EUR/AUD Weekly Outlook
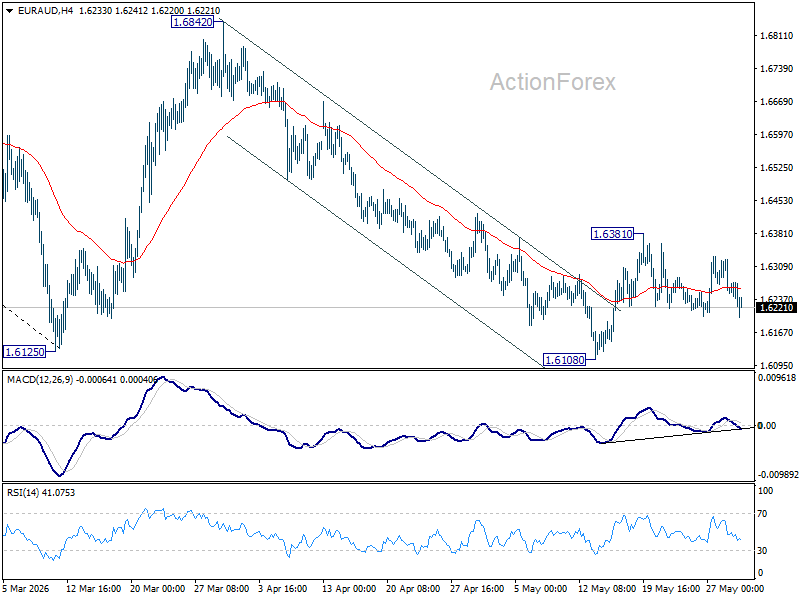
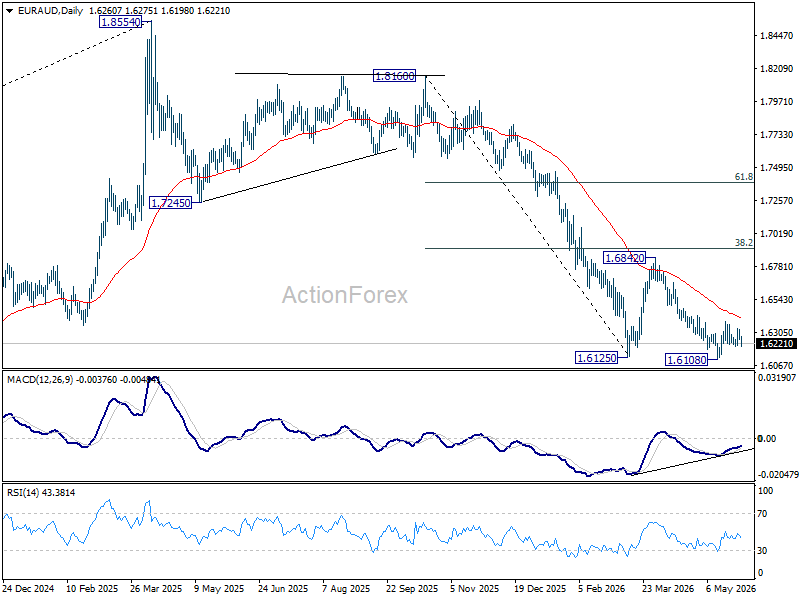
EUR/AUD stayed in sideway taring between 1.6108/6381 last week and outlook is unchanged. Initial bias remains neutral this week first. Rise from 1.6108 is seen as the third leg of the corrective pattern from 1.6125. . Above 1.6381 will bring stronger rebound to 55 D EMA (now at 1.6411) and above. Nevertheless, firm break of 1.6108 will resume the larger down trend from 1.8554.
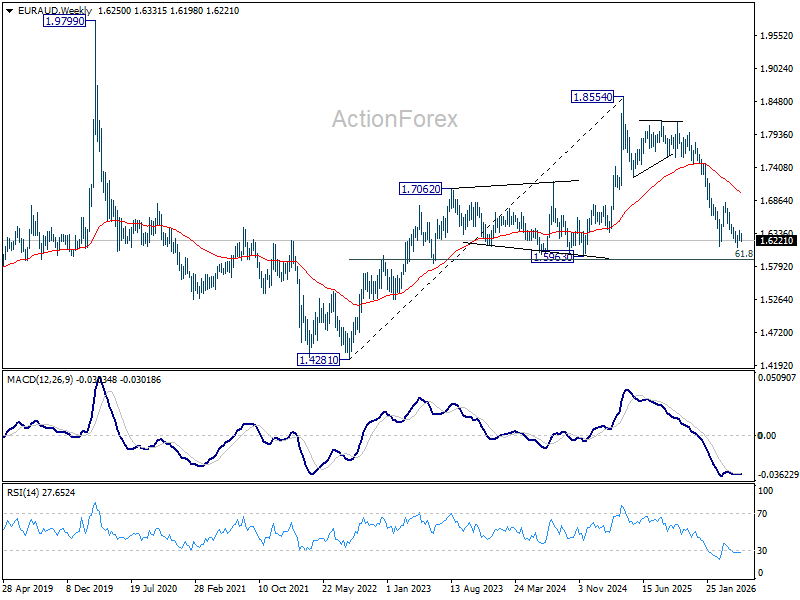
In the bigger picture, fall from 1.8554 (2025 high) is in progress and deeper decline should be seen to 61.8% retracement of 1.4281 to 1.8554 at 1.5913, which is slightly below 1.5963 structural support. Decisive break there will pave the way back to 1.4281 (2022 low). For now, risk will stay on the downside as long as 55 W EMA (now at 1.6983) holds, even in case of strong rebound.
In the longer term picture, fall from 1.8554 is seen as the third leg of the pattern from 1.9799 (2020 high), which is part of the pattern from 2.1127 (2008 high). Sustained trading below 55 M EMA (now at 1.6578) will confirm this bearish case, and pave the way back towards 1.4281.
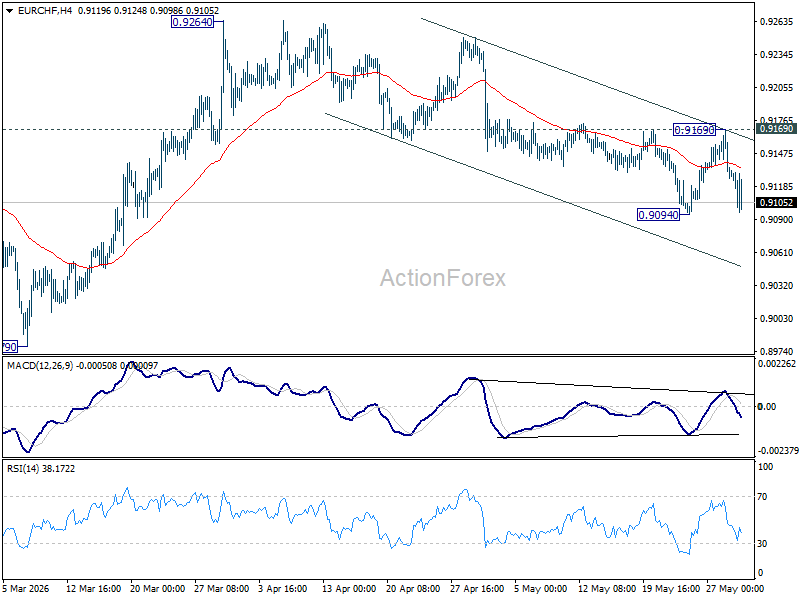
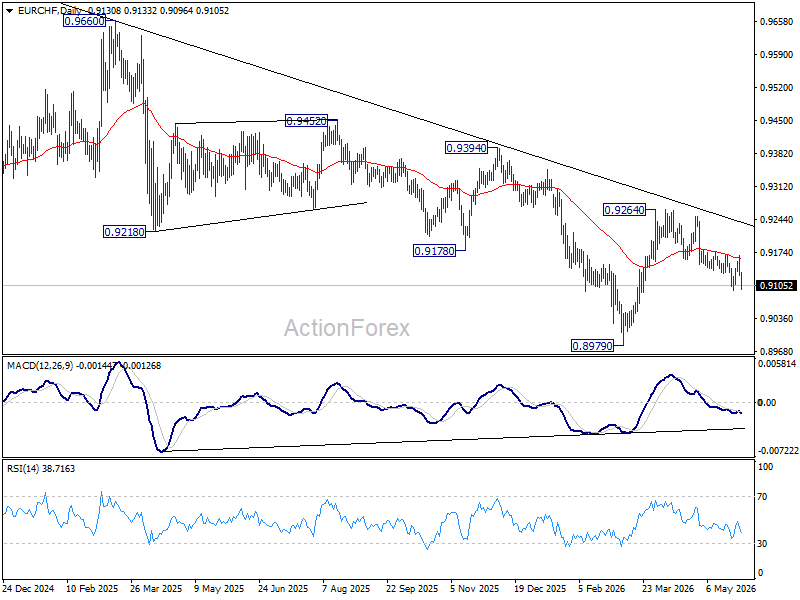
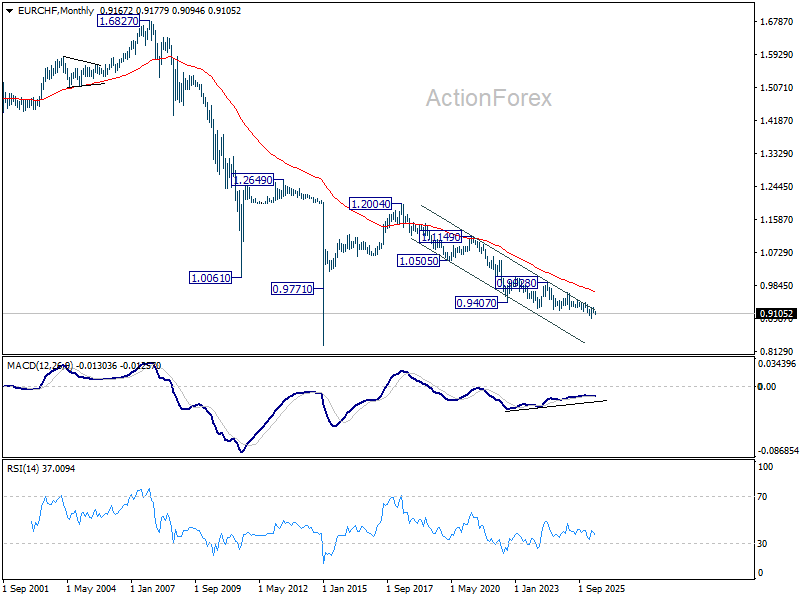
EUR/CHF Weekly Outlook
EUR/CHF attempted for recovery last week but failed after rejection by 55 D EMA (now at 0.9159). As downside is contained above 0.9094 temporary low, initial bias stays neutral this week first. Outlook is unchanged that rebound from 0.8979 should have completed at 0.9264. Break of 0.9094 will bring deeper fall back to retest 0.8979 low. For now, risk will stay on the downside as long as 0.9169 resistance holds, in case of recovery.
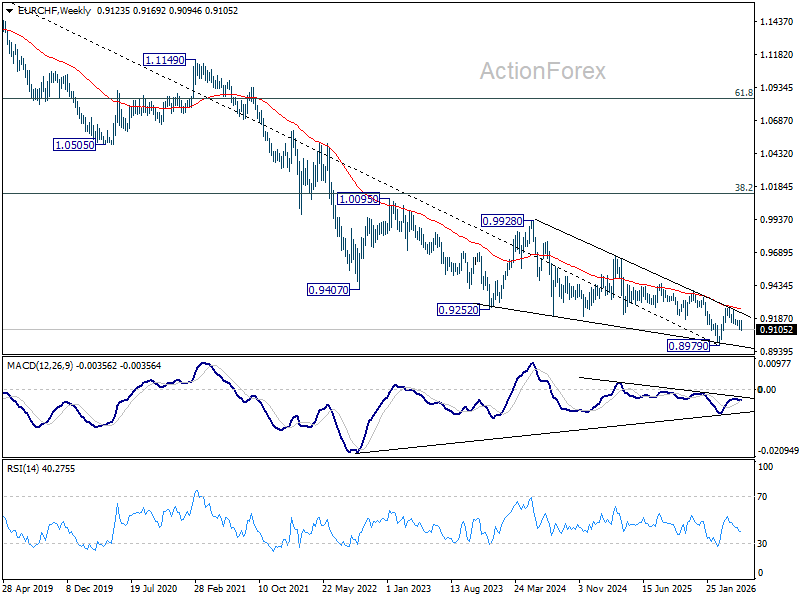
In the bigger picture, the rejection by 55 W EMA (now at 0.9252) suggests that the down trend from 0.9928 (2024 high) is still in progress. Firm break of 0.8979 will confirm down trend resumption. Outlook will stay bearish as long as 0.9394 resistance holds, in case of another rebound.
In the long term picture, outlook will stay bearish as long as 0.9407 support turned resistance (2022 low) holds. However, firm break of 0.9407 will argue that the down trend from 1.2004 (2018 high) has completed with five waves down to 0.8979. Stronger rebound should then be seen to 38.2% retracement of 1.2004 to 0.8979 at 1.0135 in the medium term.
The Weekly Bottom Line: Makings of a Deal
Canadian Highlights
- Markets swung on hopes of a Middle East truce, but the outlook remains fragile.
- Canada’s economy has stalled out over the past two quarters, with weak domestic demand and patchy investment pointing to subdued momentum.
- The upcoming CUSMA review is now central, as Canada looks to pair greater trade clarity with an energy led investment strategy.
U.S. Highlights
- Renewed hopes of a U.S.-Iran ceasefire extension pushed WTI prices 9% lower this week to $88 per barrel.
- Consumer spending remained resilient in April, amid rising inflationary pressures and dwindling household savings.
- More Fed officials are joining the chorus of sounding increasingly hawkish, with Fed futures 60% priced for a rate hike by year-end.
Canada – Canada’s Economy Stalls Ahead of Trade Negotiations
Hope for a peace deal to end the conflict between Iran and the U.S. and open the Strait of Hormuz dominated markets this week. While optimism around a possible 60-day truce has pushed oil prices sharply lower (down roughly nine percent relative to late last week), volatility remains elevated. Markets continue to respond quickly to shifting headlines, underscoring the fragility of the outlook. For Canada, this volatility comes at a time when market access to the U.S. remains an open question and continues to weigh on domestic activity.
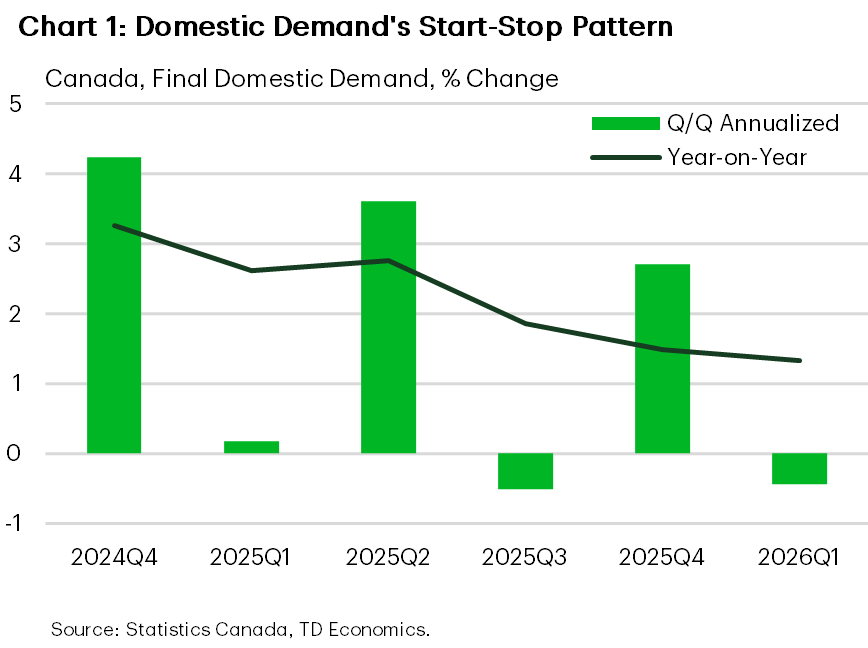
The first quarter GDP report showed the economy effectively stalled (-0.1% quarter-on-quarter annualized, q/q), undershooting expectations. The weakness was broad-based. Strong import growth dragged down the top line figure, but final domestic demand declined again (-0.4% q/q), and continues to proceed in fits and starts (Chart 1). Looking through the volatility final domestic demand is up 1.3% year-on-year (y/y), but this is still a below-trend figure, and consistent with an economy operating below capacity.
Household spending grew 1.5% q/q, supported by services, but momentum eased from Q4. On the investment side, good growth in machinery, equipment and intellectual property products were offset by another large contraction in residential investment (-7.9% q/q) and weaker outlays on engineering structures. Government investment also reversed after gains in late 2025.
Overall, the economy continues to muddle along with limited forward momentum. While early Q2 indicators suggest some rebound (with April GDP tracking higher), the broader trend still points to slack in the economy and subdued growth.
Canada’s lackluster growth performance puts the focus squarely on the upcoming CUSMA review. The economy has operated under the cloud of uncertain U.S. market access ever since the first tranche of tariffs were announced last year. On Monday the three countries are due to notify each other of what changes they want in the agreement, with discussions to follow. The United States and Mexico have already scheduled formal negotiating rounds. Minister for U.S.-Canada Trade Dominic Leblanc is expected to travel to Washington next week, but the timelines for negotiations remain unclear.
To find some insights on the negotiations, Prime Minister Mark Carney’s speech in New York this week highlighted Canada’s strategy. He called for a “new partnership” with the United States, while simultaneously positioning Canada’s goal to establish itself as “an energy superpower”.
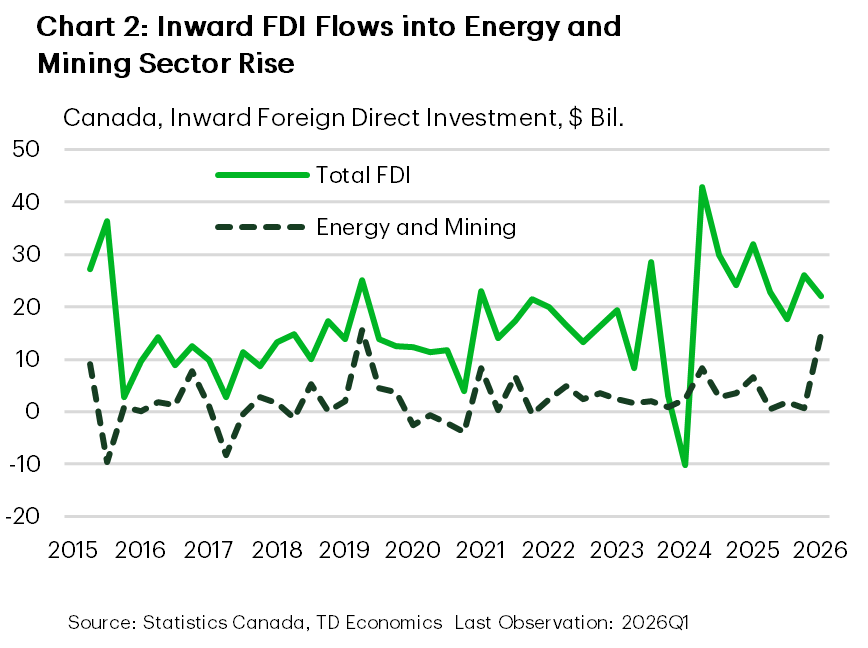
Recent foreign direct investment data suggest there might be something to the strategy. First quarter inflows were reported at $22 billion ($4 billion less than in Q4), and investments in the energy and mining sector were $14.7 billion in the quarter (Chart 2). While these data are volatile, they align with Canada’s strategy to leverage its resource base and attract long-term capital.
The Canadian economy continues to muddle along under a cloud of trade uncertainty. The hope is that in the coming months, clarity and stability on the trade relationship with the U.S. emerges. Increased economic certainty, together with the push to attract global capital to invest in Canada, can lay the foundation for productivity-powered economic growth.
U.S. – Makings of a Deal
It’s been three months since the U.S. and Israel launched the initial attack on Iran. Hopes for a longer-term peace resolution rose this week following President Trump’s comments that a peace deal had been “largely negotiated”. Oil prices fell sharply on the news, though renewed attacks from both sides by mid-week briefly faded the optimism. But by Thursday evening, news outlines were reporting that the two sides had reached an agreement on a 60-day memorandum of understanding to extend the ceasefire, pending President Trump’s approval. Oil prices traded 9% lower on the week and the WTI benchmark currently sits at $88 per barrel. Meanwhile, economic data out this week reinforced a more cautious but still resilient consumer amid renewed inflationary pressures. The S&P 500 edged 1.3% higher on the week, while the 10-Year Treasury yield drifted lower by 12 basis points and currently sits at 4.44%.
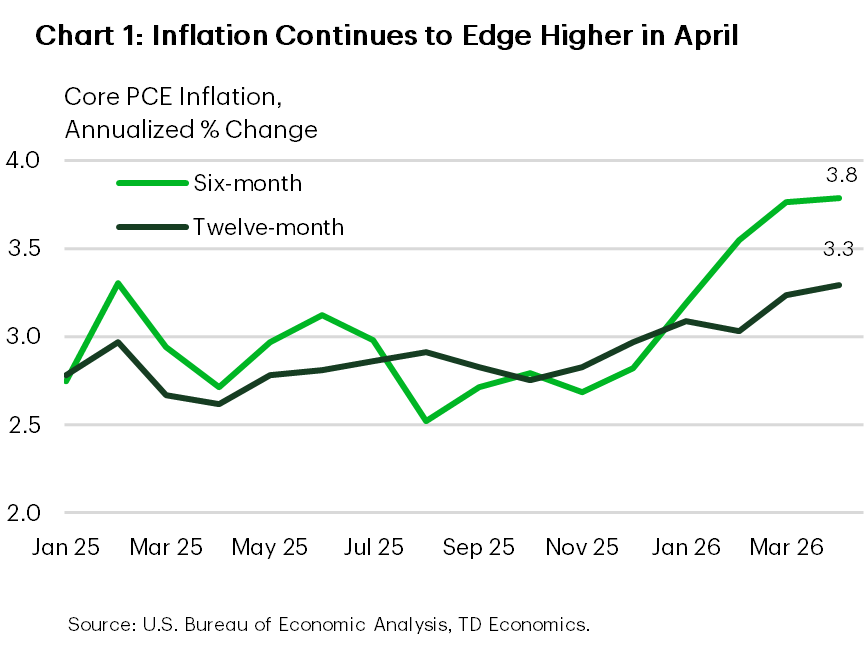
This week’s release of the April personal income & spending data offered a fresh dose of reality on the pain being inflicted on American households because of the energy shock. PCE inflation rose to a three-year high of 3.8% year-on-year and is likely to push north of 4% in May alongside a continued rise in gasoline prices. The picture didn’t look much better once the effects of food & energy were removed, with core PCE inflation edging up to 3.3%. Three-and-six-month measures are even hotter, each up 3.8% (Chart 1).
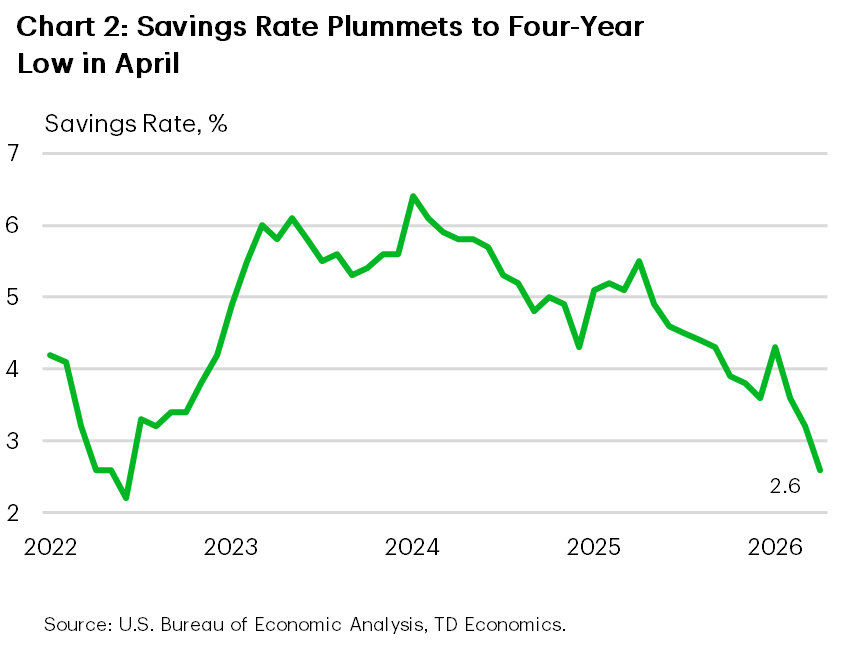
Despite the rise in inflation, the consumer has remained reasonably resilient. Nominal spending rose 0.5% m/m in April, following a stronger gain of 1% in March. After accounting for inflation, April’s gain looked less stellar, but still edged higher by 0.1% m/m. Hotter inflation is also working to erode consumer purchasing power, with real disposable income declining for a third consecutive month. This has left households increasingly reliant on savings to fuel spending. But with the savings rate having slipped to a four-year low, the buffer is looking increasingly thin.
According to a recent survey conducted by the Conference Board, households are reporting softer spending intentions in the months ahead. Fewer households are planning to purchase big-ticket items while two-thirds of consumers plan to reduce overall spending due to higher prices. While the survey metrics have been a less reliable predictor of actual spending post-pandemic, we can’t completely disregard the signal. The energy shock has further strained affordability for lower-and-middle income households, who have not benefited to the same degree from past year’s gains in home and equity prices.
And there’s an increasing risk that affordability pressures could worsen if the energy shock is sustained much longer. A growing chorus of Fed officials are sounding increasingly hawkish amid rising inflationary pressures. Board member Lisa Cook said this week that if disinflation doesn’t soon resume, she would be “prepared to raise rates”. Meanwhile, Fed President Kashkari reiterated that the inflation fight takes priority as the labor market now appears to be in decent shape. This suggests next week’s employment report will play second fiddle to the May CPI numbers due on June 10th. Fed futures are now 60% priced for a rate hike by year-end, but a hotter inflation report could pull forward expectations for a rate hike.
Economics Week Ahead
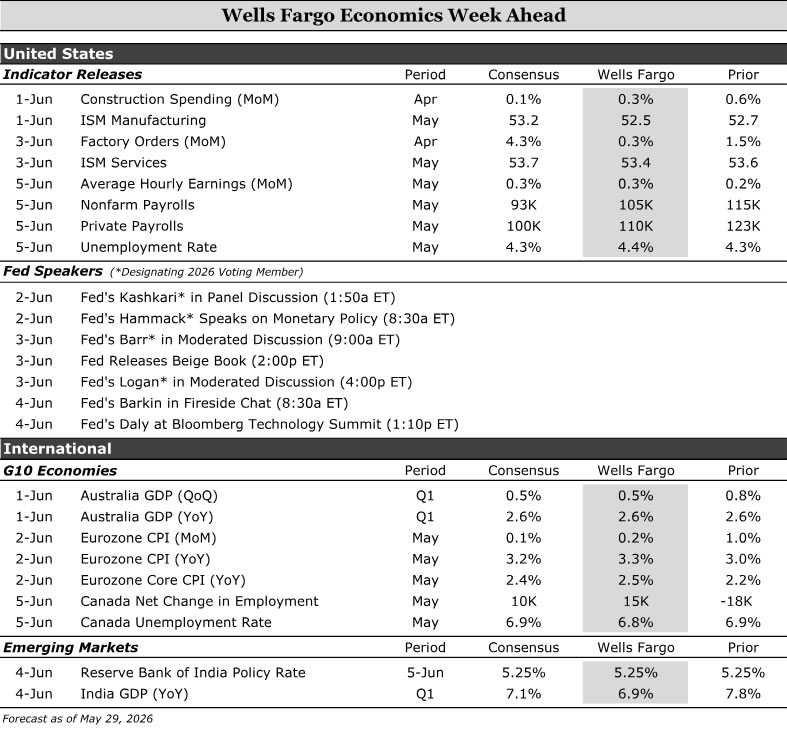
The focus next week is Friday’s U.S. employment report, where we look for May nonfarm payrolls to rise by 105K and the unemployment rate to edge up to 4.4%. Taken together, the report should leave the broader message unchanged: the labor market is no longer deteriorating but still is not meaningfully improving, either. Earlier in the week, the U.S. ISM surveys should point to expansion, with manufacturing holding near April's level at 52.5 and services easing to 53.4 from 53.6, though the prices paid components will matter most as a signal of broader inflationary pressure.
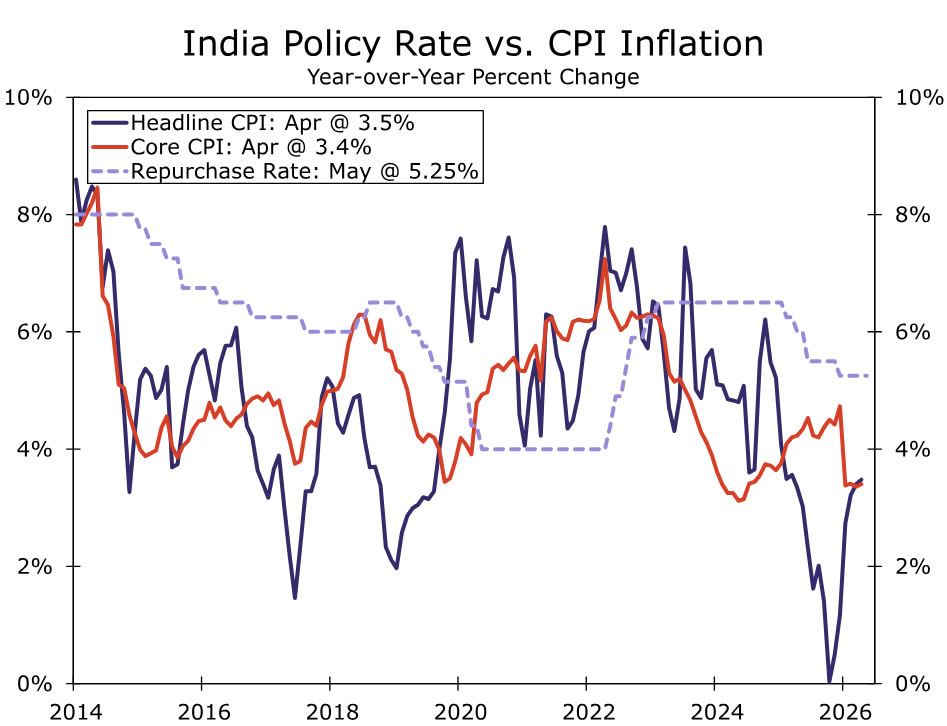
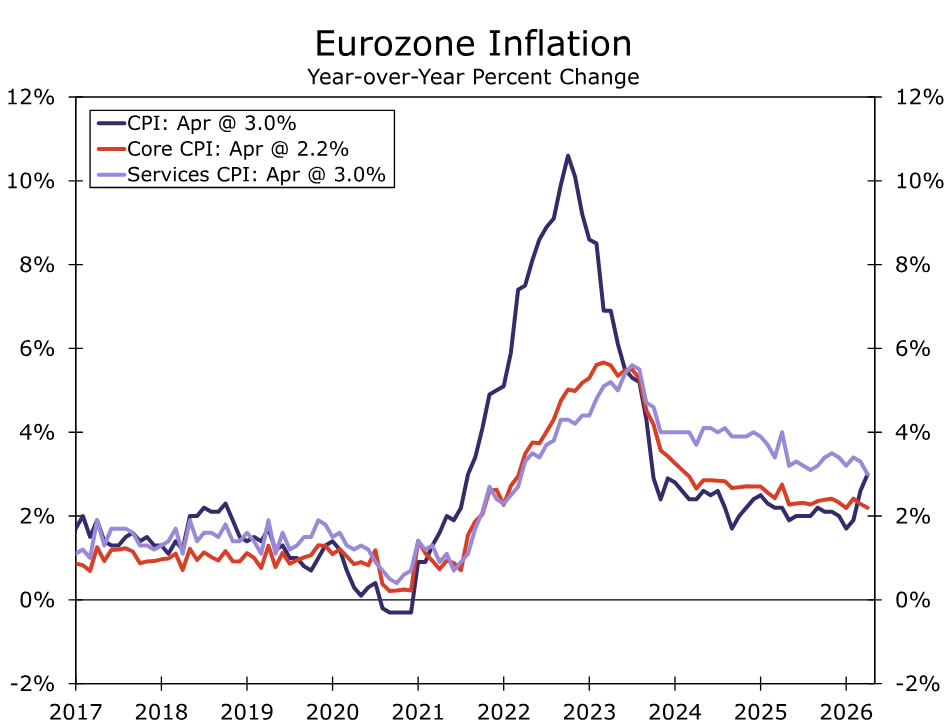
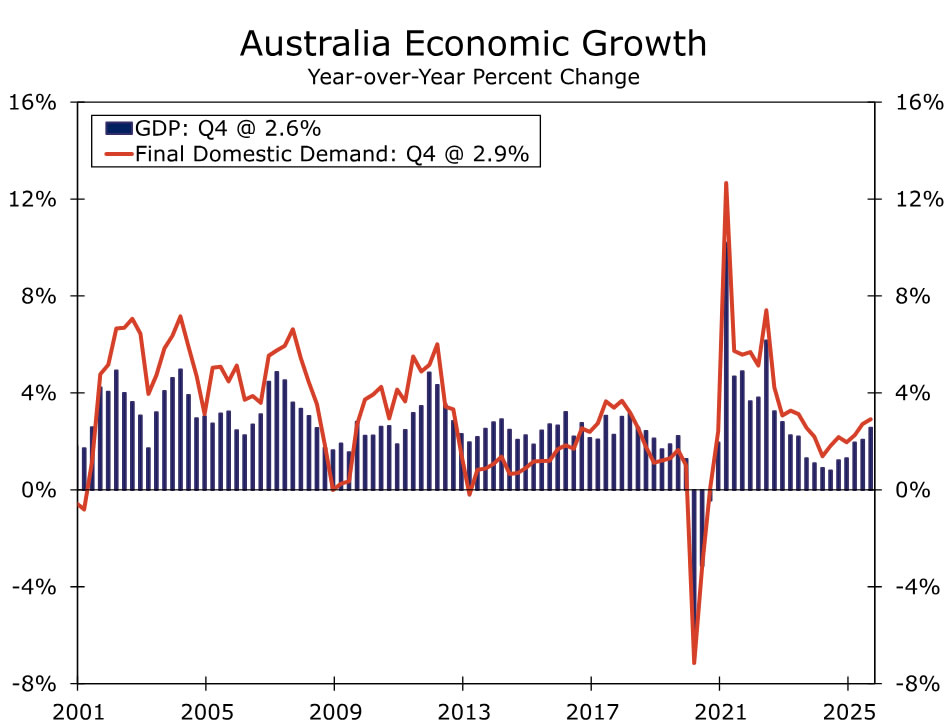
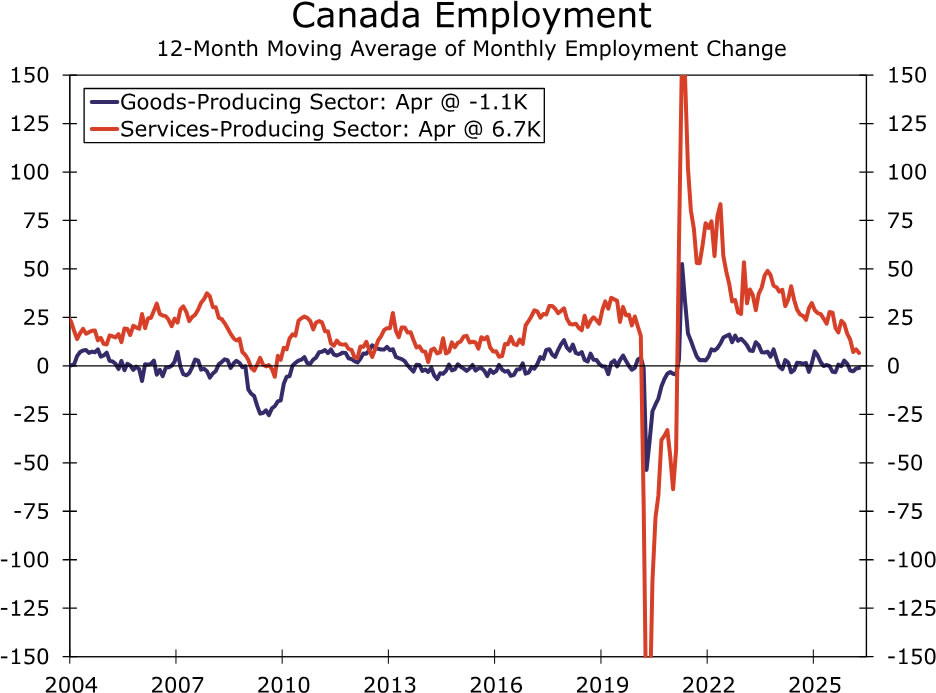
Outside the U.S., we expect Eurozone CPI to rise to 3.3% year-over-year in May from 3.0% last month and core CPI to increase to 2.5% from 2.2%, keeping pressure on the ECB ahead of its June meeting. In Australia, Q1 GDP is likely to remain at a more moderate 2.6% year-over-year rate, and in Canada, we expect employment to rise 15K and the unemployment rate to dip to 6.8%. In emerging markets, the Reserve Bank of India is likely to leave the repurchase rate unchanged at 5.25% next week, though we continue to expect two rate hikes this year.
United States:
- ISM Surveys (Monday & Wednesday), Employment (Friday)
G10 Economies:
- Eurozone CPI (Tuesday), Australia GDP (Wednesday), Canada Labor Force Survey (Friday)
Emerging Markets:
- Reserve Bank of India Policy Rate (Friday)
U.S. Week Ahead
ISM Surveys • Monday & Wednesday
We expect the ISM surveys to indicate continued expansion in May. Regional Fed manufacturing surveys and the Markit PMI both point to little change in underlying conditions, and we look for the ISM manufacturing index to hold near April levels at 52.5.
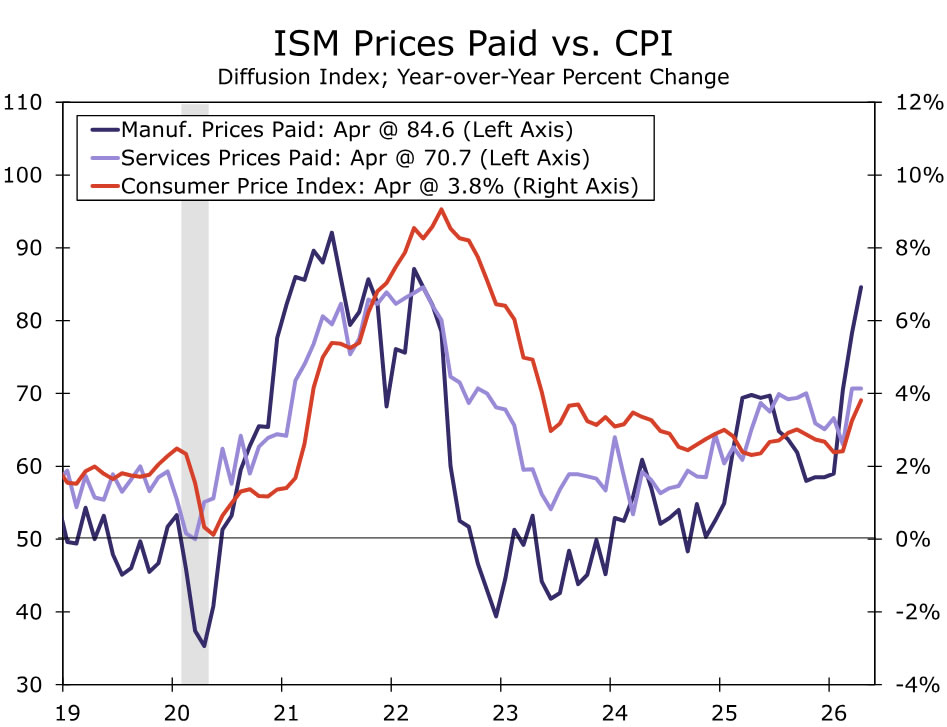
The prices paid component will get the most attention given the market's focus on assessing the inflationary spillovers from the ongoing conflict in Iran. Manufacturing input costs have moved sharply higher, but there is little evidence of a comparable pickup in services, where pricing pressures appear more contained.
Service-sector activity also looks resilient. We forecast the ISM services index edging down modestly to 53.4 from 53.6 in April. While uncertainty and cost pressures are building, the data continue to suggest demand is holding up rather than deteriorating materially.
Employment • Friday
The labor market remains stuck in a low fire, low hire equilibrium. Initial jobless claims remain low, and major layoff announcements have been largely limited to tech. Hiring, however, shows few signs of improvement. New job postings on Indeed and regional Fed employment PMIs have been moving sideways, while the Conference Board’s labor differential slipped in May. Together, these indicators suggest there has not been a re-acceleration in labor demand.
With demand little changed, we estimate nonfarm payrolls rose 105K in May. Hiring in cyclically sensitive industries has picked up a bit since late last year, but we expect to see some pockets of weakness following the bankruptcy of Spirit Airlines and additional layoffs hitting the information industry.
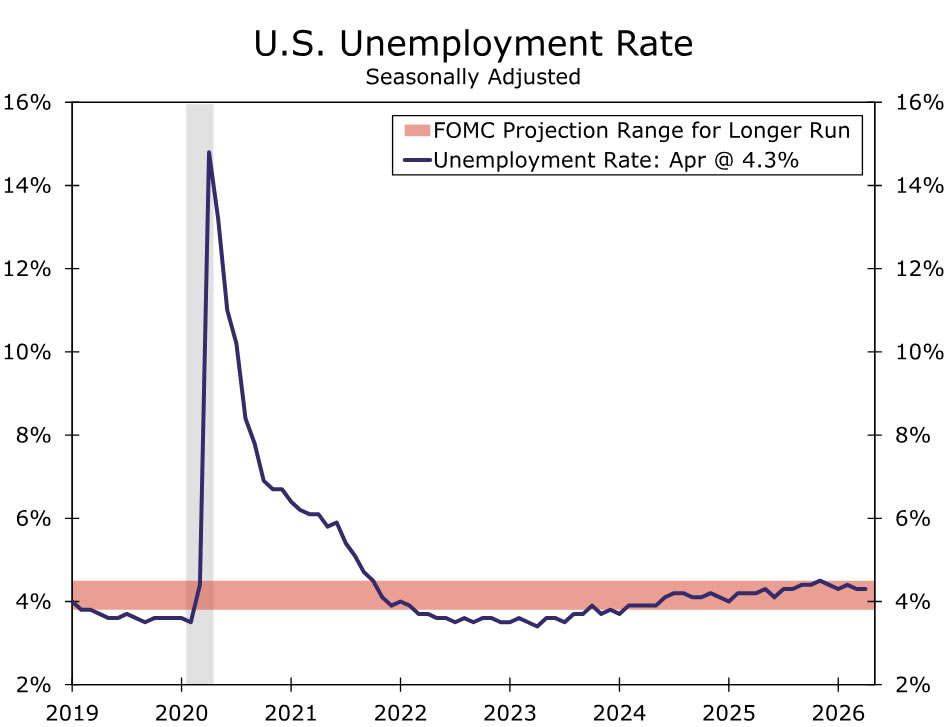
Tepid demand for new workers, including recent college grads, is likely to lead to the unemployment rate back up to 4.4%. While most of the drop-off in the participation rate over the past year can be attributed to demographics, the slide also reflects a swath of labor force exits. With the labor force participation rate falling every month this year, we would not be surprised to see a partial rebound in May that pushes the jobless rate higher. Even with an uptick though, the unemployment rate has been largely unchanged over the past year. The stability underscores a labor market that is no longer deteriorating, but also not improving.
G10 Week Ahead
Eurozone CPI • Tuesday
Euro area May CPI is likely to move up to 3.3% year-over-year change from 3.0% in April. On a monthly basis, we expect momentum to ease to 0.2% (from 1.0%) as energy prices stabilize after prior gains. The key question for markets and policymakers is whether price pressures are broadening, as inflation to date has remained concentrated in a narrow set of energy-intensive goods and services. PMI data point to renewed pressure on input costs, although this has yet to feed through to output prices. Focus will remain on services and non-energy industrial goods (NEIG) as indicators of broader pass-through. We look for core CPI to rise to 2.5% year-over-year from 2.2% in April.
Looking ahead to the ECB’s June meeting, the Governing Council will have the May inflation print alongside updated staff forecasts. We continue to see June as the likely starting point for rate hikes, with a follow-up move in Q3, most likely July. That said, a downside surprise in core or continued narrowness in price pressures could tilt the decision toward a hawkish hold in June, with a clear bias to move once broader pass-through becomes evident.
Australia GDP • Wednesday
Australia’s Q1 GDP release next week is likely to show a more moderate pace of growth after the stronger Q4 print. We expect GDP to rise 0.5% quarter-over-quarter and 2.6% year-over-year. While the previous quarter’s headline growth was strong, reaching its fastest annual pace in nearly three years, the underlying details were less convincing. Inventories played an outsized role, while net exports dragged as imports rose sharply.
Q1 indicators have been uneven. PMIs started the year on firmer footing, then softened through the quarter and ended in contraction. Monthly household spending also looked soft in January and February before rebounding sharply in March, though some of that strength may reflect front-loading linked to the Middle East conflict. Investment should provide some support after the stronger Q1 cape print (led by machinery and equipment, driven by a 196% quarter-over-quarter surge in information and telecommunications). However, that is unlikely to fully offset softer consumption and another likely drag from net exports (as shown in the surge of March's import bill).
In terms of monetary policy implications for the Reserve Bank of Australia, a materially softer GDP print would reinforce the drag from higher rates on household spending and confidence. Still, while April headline inflation cooled, underlying price pressures rose to 3.4% year-over-year and underscored continued pass-through risks. Against this backdrop, we continue to see room for one more 25 bps hike in August, taking the Cash Rate to 4.60%.
Canada Labor Force Survey • Friday
We expect the stabilization narrative in the labor market to persist despite April’s unexpected softening. Employment growth is projected to rise by 15k in May, with the unemployment rate declining to 6.8%. The April increase in unemployment was driven by a surge in participation alongside weak hiring rather than layoffs.
Looking ahead, labor demand should be supported by firmer consumer spending, improved business sentiment, and ongoing fiscal support. Elevated energy and commodity prices represent an inflationary tailwind for Canada, likely skewing job gains toward resource-linked sectors. Structurally, labor supply constraints remain intact, with an aging workforce and weaker immigration flows continuing to weigh on participation and push the unemployment rate lower over time.
A weak May print would challenge the stabilization narrative and, coupled with soft Q1 GDP, could push back expectations for a BoC rate hike beyond July, which remains our baseline.
EM Week Ahead
Reserve Bank of India Policy Rate • Friday
Reserve Bank of India (RBI) policymakers will meet next week, and we expect them to leave the Repurchase Rate on hold at 5.25%. We see a hold as likely because inflation is still within the RBI’s 2%-6% target range, helped in part by government subsidies, which gives policymakers some room to assess pass-through before tightening policy. That said, the inflation outlook has become more challenging. Higher energy and food prices are likely to push headline inflation higher in the coming months, especially if the Middle East conflict keeps energy prices elevated or El Niño conditions weigh on the southwest monsoon.
Recent high-frequency indicators suggest that strong momentum in economic activity has continued, and next week’s Q1 GDP print should provide a clearer read on the economy’s underlying strength. Still, the growth outlook has become more vulnerable as higher energy prices, rising shipping and insurance costs, and supply disruptions risk pressuring margins and weighing on downstream production. The rupee has also come under pressure from higher oil prices, short-term capital outflows, and a stronger dollar.
At its April meeting, the MPC maintained a neutral stance, which preserved flexibility to respond to incoming data. With inflation risks moving higher, growth risks shifting to the downside, and currency pressures building, we continue to see policy risks skewed toward tightening. We maintain our view for two rate hikes this year, one in Q3 and one in Q4, which would bring the Repurchase Rate to 5.75%.