Sample Category Title
USD/JPY Strengthening
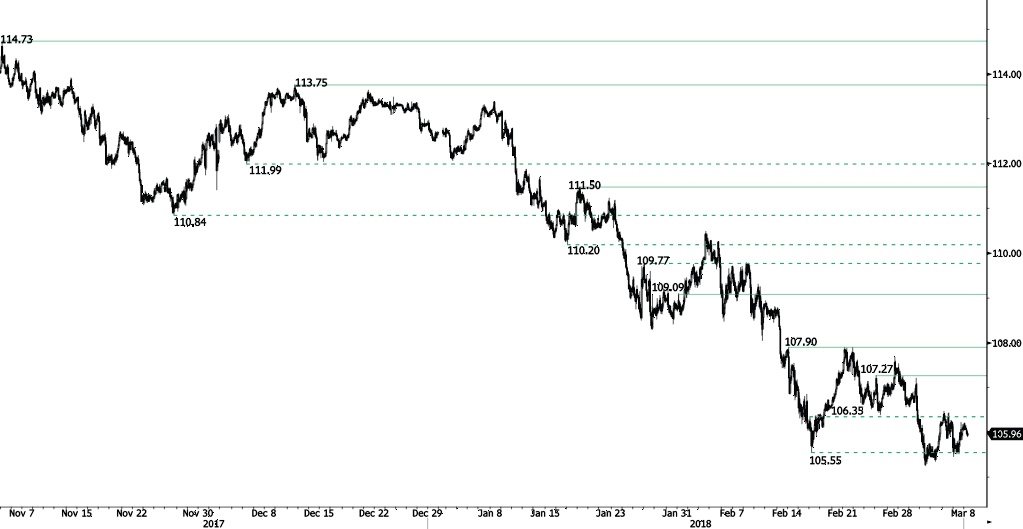
USD/JPY is bouncing up, approaching hourly resistance at 107.27 (25/02/2018 high) while hourly support at 104.97 (11/10/2016 high) gains distance. The bearish pattern started in January 2018 is maintained. The short-term technical structure suggests short-term increase.
We favor a long-term bearish bias. Support remains at 101.20 (09/11/2016 low). A gradual rise toward the major resistance at 125.86 (05/06/2015 high) seems unlikely. Expected to decline further support at 101.20 (09/11/2016 low). The pair trades largely below its 200 DMA.
GBP/USD Fails Reaching Resistance At 1.3945
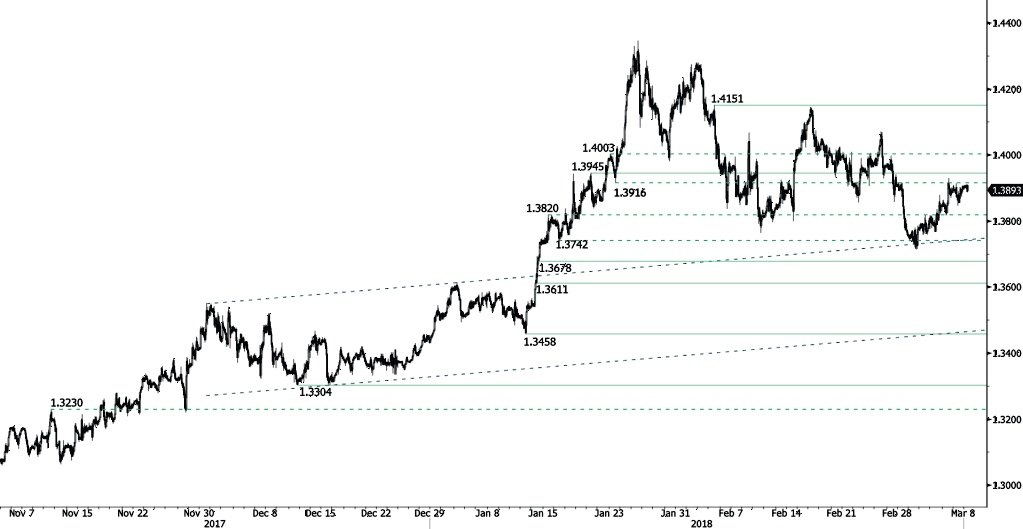
GBP/USD recovery phase is ended. The pair is weakening and heading for the 1.38 range. Hourly support lies at 1.3678 (12/01/2018 low) while hourly resistance at 1.3945 (19/01/2018 high) is distanced. The technical structure suggests short-term increase.
The long-term technical pattern is reversing. The Brexit vote had paved the way for further decline but the pair is moving to 2016 highs. Long-term support and resistance are given at 1.1841 (07/10/2017 low) and 1.5018 (24/06/2016 high).
EUR/USD Bearish Consolidation
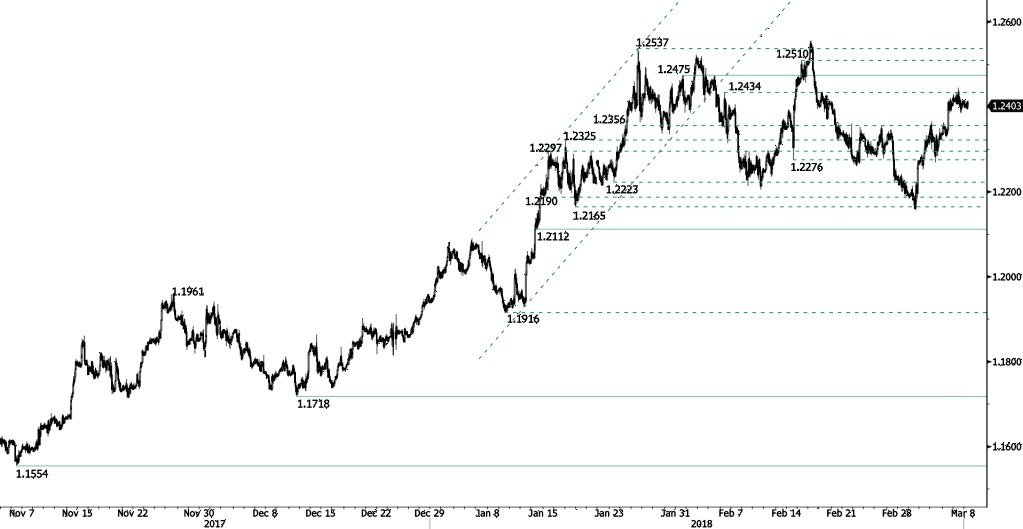
EUR/USD is stabilizing at the 1.2385 range after breaking hourly resistance at 1.2434 (26/02/2018), heading for further decline along 1.2350. Hourly support and resistance are given at 1.2112 (12/01/2018 low) and 1.2475 (31/01/2018 high). The technical structure suggests further downward moves.
In the longer term, the momentum is turning largely positive. We favor a continued bullish bias. Key resistance is holding at 1.2886 (15/10/2014 high) while strong support lies at 1.1554 (08/11/2017 low).
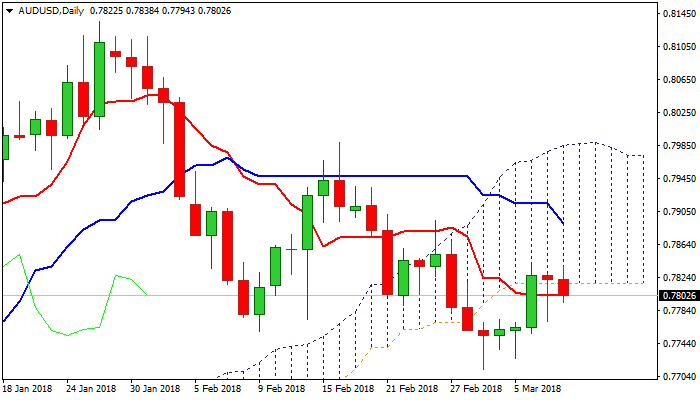
Technical Outlook: AUDUSD Returned Below Daily Cloud After Upside Attempts Were Repeatedly Capped By 20SMA
The Australian dollar fell back to 0.78 zone in early European session and erased overnight gains on upbeat Australian trade balance data. Trade surplus widened to A$1.05 billion in January, overshooting forecast for A$200 million surplus and against December's gap of A$ 1.14 billion. Strong data little helped the Aussie to extend recovery, which was repeatedly capped by sideways-moving 20SMA at 0.7836. Fresh weakness returned below the base of thick daily cloud (0.7817) weakening immediate structure, but was so far contained by 10SMA (0.7796), keeping intact key supports at 0.7784/71 (200/100SMA's). However, the downside remains at risk after Wednesday's Hanging Man which signaled reversal and requires strong bearish close today to confirm the pattern. The notion is supported by negative momentum studies and thick daily cloud which so far limited upside attempts and weighs heavily. On the other side, hopes for fresh attempts higher will remain in play while 200/100 SMA supports hold, with focus on US jobs data which could boost the Aussie on weaker than expected release. Also, signals that the US may exclude some countries from their tariff plan would be further support. Bullish scenario needs firm break into daily cloud and lift above 20SMA to signal fresh advance.
Res: 0.7817, 0.7836, 0.7879, 0.7893
Sup: 0.7796, 0.7784, 0.7771, 0.7756
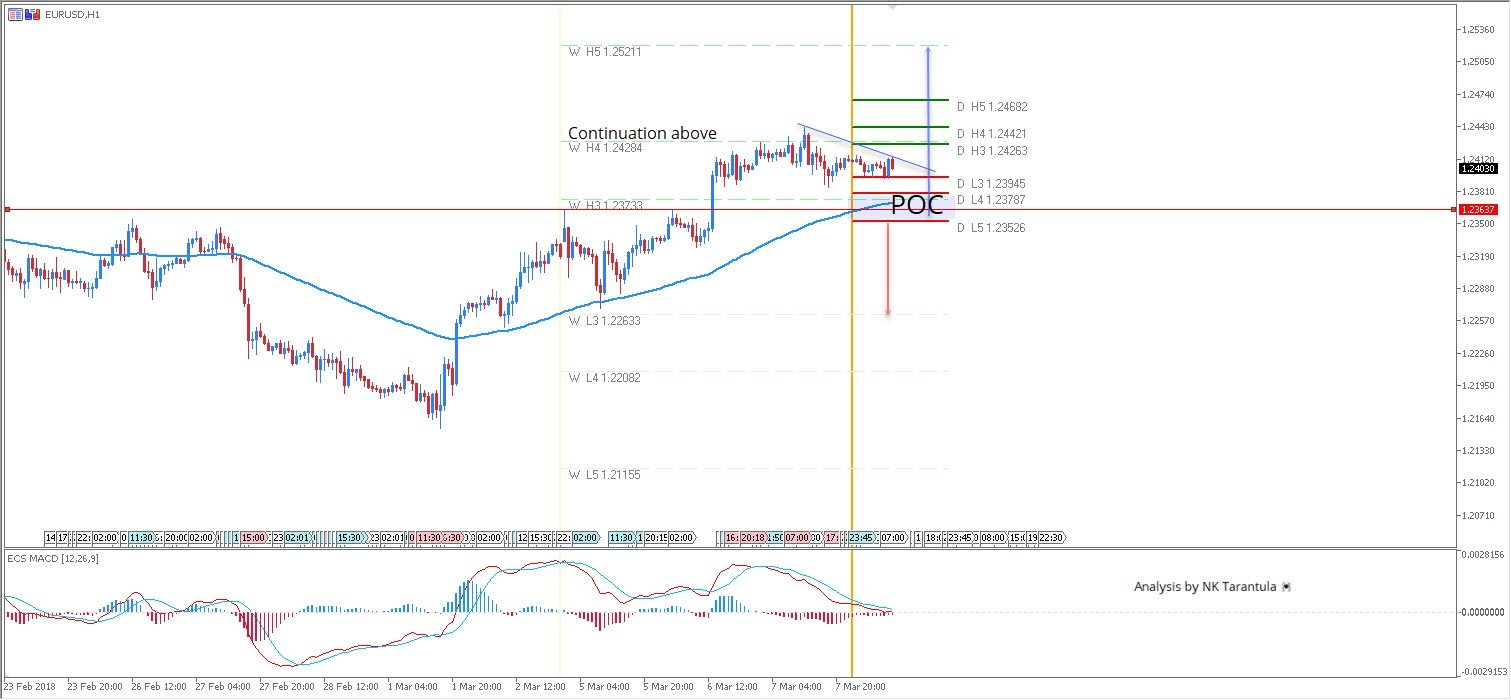
EUR/USD Is Waiting For ECB Decision Today
The EUR/USD most important event today is the ECB interest rate decision. The rate is expected to remain the same (0.00 % vs 0.00 %). We need to know that the price is usually priced in the market and it is the ECB Conference today that should bring a lot of movement and volatility. At this point, the price is congested within W H3 / W H4 camarilla pivots. 1.2352-78 is still an active POC zone, and bounces from the zone should target 1.2394, 1.2426. Breakout-Continuation could be formed above 1.2430 towards 1.2468 and 1.2521. Below 1.2350, 1.2300 and 1.2263 are targets. Watch for volatility and possible 2-way price movement that's usually the case with the ECB conferences.
W H3 -Weekly Camarilla Pivot (Weekly Interim Resistance)
W L3 - Weekly Camarilla Pivot (Weekly Interim Support)
W H3 - Weekly Camarilla Pivot (Weekly Interim Resistance)
W H4 - Weekly Camarilla Pivot (Strong Weekly Resistance)
D H4 - Daily Camarilla Pivot (Very Strong Daily Resistance)
D L3 – Daily Camarilla Pivot (Daily Support)
D L4 – Daily H4 Camarilla (Very Strong Daily Support)
POC - Point Of Confluence (The zone where we expect price to react aka entry zone)
EM Currencies Sank Amid Surge In Uncertainty
EM currencies sank amid surge in uncertainty
The emerging market complex has been caught in cross fire since yesterday after Donald Trump said Canada and Mexico would be excluded from the tariffs, provided that the three countries succeed in reaching a new NAFTA agreement, while other countries will still be subject to it. Therefore, it maintains the pressure on other commodity exporting countries, which casts a shadow on their growth outlook. Secondly, the continuous increase in US Treasury rates is adding pressure on higher-yielding currencies as it reduces the return of carry trades. As example, the 2-year interest rate differential between the US and Brazil currently stands at around 6%, compared to more than 16% in September 2015. The tightening that is underway in the US could only reduce the attractiveness of those currencies.
Yesterday, the Brazilian real fell 1% as USD/BRL rose to 3.2433, the Chilean pesos was off 0.43% with USD/CLP rising to 602.69. bThis morning, the South African rand fell 0.25% as USD/ZAR climbed to 11.8651. Given the rising uncertainty stemming from Trump trade war, we think that investors would cherry pick their EM investments and stick to currencies would be the least impacted by the new US tariffs, meaning countries that are doing the least business with the US. Indeed, what guarantee that President Trump will not use the same trick to target specific trade partners with which the US has a trade deficit?
DAX up 1.09% before today’s ECB monetary policy meeting
European stocks closed higher yesterday, as political tensions start rising in the US, now that Trump’s economic adviser Gary Cohn publicly confirmed his resignation with immediate effect, an event that does not augur well for US – EU trade agreements. Inflation in the EU remains sluggish (February Eurostat flash CPI Y/Y given at 1.20%) while the EUR starts strengthening against major currencies. EUR/USD and GBP/EUR are valued at 1.24 and 0.89 (YTD: +3.31% and +0.47%). Adding up all these factors with further political risks with regard to uncertainty as to the future coalition between Italian parties (out of which unconventional parties will have a decent legislative power), we see no reasons for the ECB to have a hawkish stance for now. Euro Zone benchmark interest rate is at -0.40% and is expected to remain so for the whole year while ECB’s asset purchasing program of EUR 30 billion is not expected to change for now.
German DAX was leading the way on European side, closing at 12’245 (+1.09%), supported by Real Estate (+2.79%), IT (2.21%), Health Care (+1.77%), Materials (+1.32%) and Financials (+1.14%). It seems that nothing stops German economy to expand since the maintenance of current political coalition with Merkel confirmed on Monday. The Euro Zone was heading in the same direction, as investors confidence remains (Euro Stoxx 50 +0.58%), though tariff war escalation with the US is taking larger proportions.
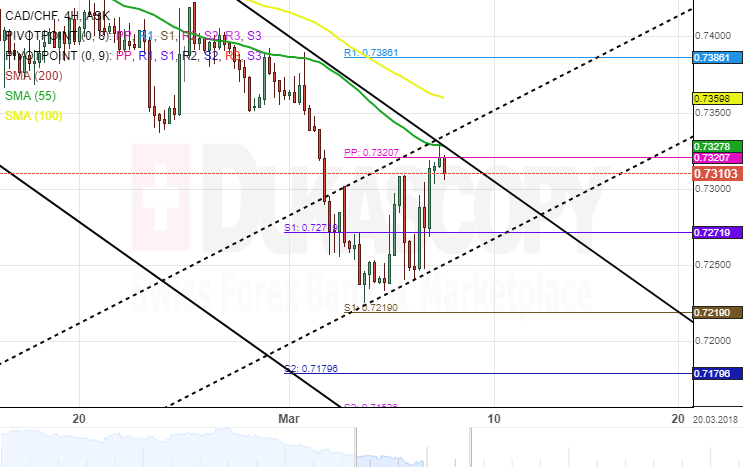
CAD/CHF 4H Chart: Meets Resistance
The Loonie has been strained in a channel down against the Swiss Franc. The currency pair tested the upper boundary of this pattern on January 8, being followed by a strong period of decline.
The CAD/CHF pair has moved closer to the border of a medium-scale triangle and could be set for a breakout. The rate has breached the weekly PP at 0.7320 and moved back south.
The overall market sentiment is bearish and it is likely to continue for the following week if the aforementioned breakout does not occur.
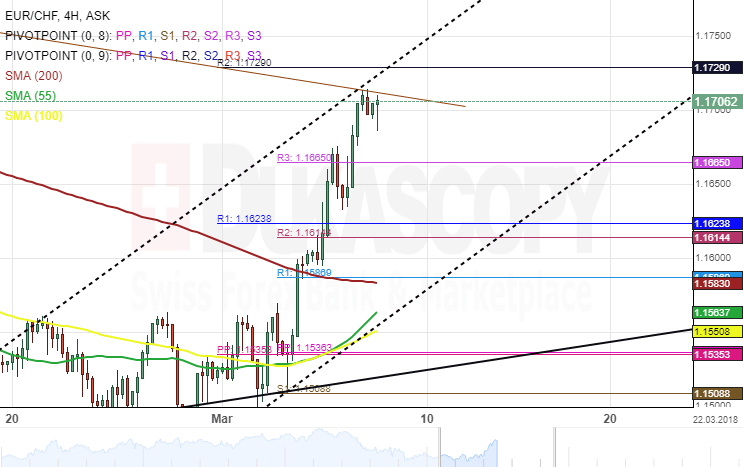
EUR/CHF 4H Chart: Trading In Narrow Channel
The common European currency has been guided by a nine-month ascending channel against the Swiss Franc. The exchange rate bounced off the bottom boundary of a dominant channel on June 23, 2017, and has since surged against the Franc.
A support cluster set by the weekly and monthly PPs near 1.1613 was proving enough support to push the price further north. However, the dotted line which shows the medium-term pattern is restricting the currency pair from making any further gain at the time of this analysis.
As for near future, the EUR/CHF pair is likely to make a temporary retracement south for a test of either the weekly R3 or the monthly R1
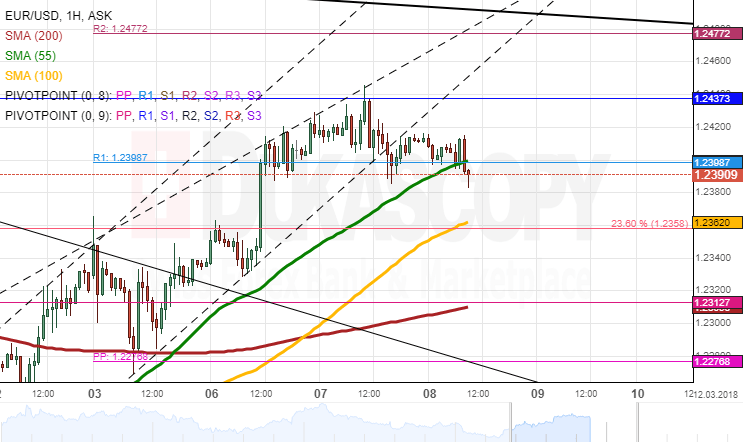
EURUSD Analysis: Tended North
EUR/USD was trading in a short-term ascending channel for several sessions. This strong upside momentum, however, allayed significantly on Wednesday when the Euro approached the resistance of the monthly PP. The pair has since been trading sideways for the second consecutive session.
As apparent on the chart, it has not yet managed to reach the upper boundary of a six-week channel down. Thus, it is likely that the current period of consolidation is followed by a surge up to the 1.2470 mark during the remaining part of this week.
The Euro could remain stranded between the 55-hour SMA and the monthly R1 for several hours until upward pressure prevails in the market. ECB fundamentals, however, might introduce some changes to this scenario mid-session.
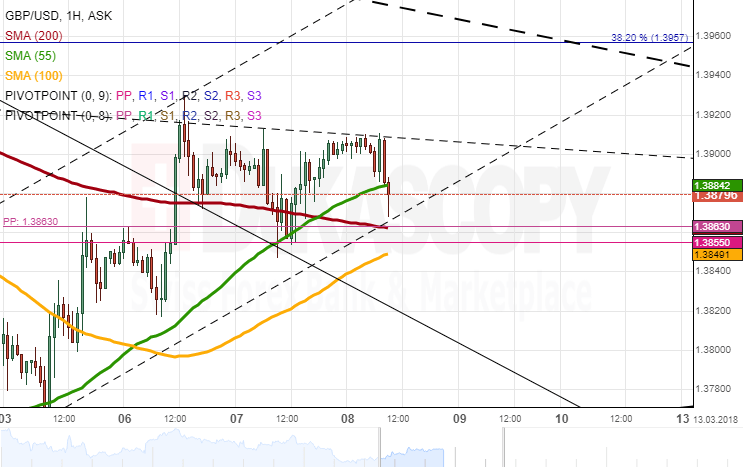
GBPUSD Analysis: Returns To 1.39
Despite some minor fluctuations during the previous 24 hours, the GBP/USD exchange rate returned at the same price level as on Wednesday morning slightly below the 1.39 mark. The first part of yesterday was dominated by bears which unsuccessfully tried to surpass a support cluster formed by the weekly and monthly PPs and the 55– and 200-hour SMAs circa 1.3860. Even though the general tendency still remains tended northwards, bulls have seemingly lost their strength during the last two sessions. This indicates that some downward pressure is likely to prevail soon. However, given the strength of the aforementioned support, the Pound might still push higher this week up to the trend-line and the 38.20% Fibo retracement circa 1.3950.