Sample Category Title
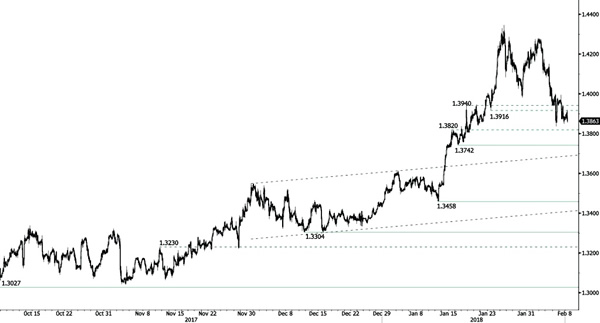
USD/CAD Strengthening
USD/CAD is now trading in the 1.26 range and outreached support at 1.2589 (01/01/2018). New resistance is now at 1.2796 (22/12/2017 high) while further resistance remains at 1.2917 (27/10/2017 high). The technical structure indicates that further short-term rise is expected.
In the longer term, the pair is trading between resistance point at 1.3805 (05/05/2017 high) and support at 1.2128 (18/06/2015 low). Strong resistance is given at 1.4690 (22/01/2016 high). The pair is likely to head lower. The pairs is trading below 200 DMA.
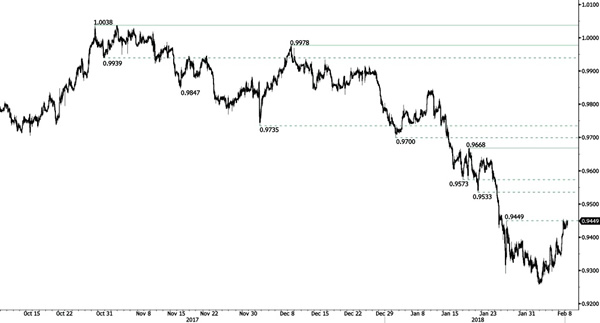
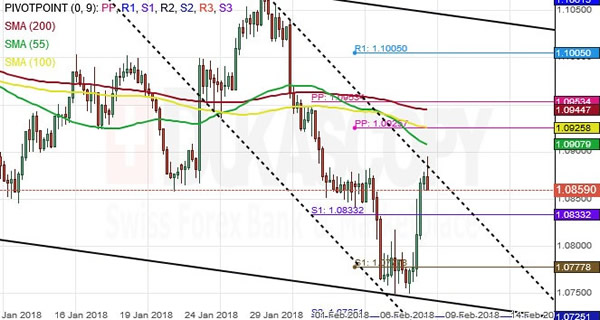
USD/CHF Upward Momentum
USD/CHF keeps strengthening. Hourly resistance at 0.9449 (25/01/2018) is now broken. Expected to show further short-term upside move.
In the long-term, the pair is still trading in range since 2011 despite some turmoil when the SNB unpegged the CHF. Support at 0.9259 (24/08/2015 low) is attainable. Key support remains at 0.9072 (07/05/2015 low) while resistance at 1.0344 (15/12/2016 high) is distanced. The technical structure favours a long term bullish bias since the unpeg in January 2015.
USD/JPY Upward Momentum
USD/JPY is increasing and remains in the 109 range, heading toward 110. Hourly resistance remains at 111.50 (18/01/2018 high). The technical structure suggests further short-term upside moves.
We favor a long-term bearish bias. Support is now given at 107.32 (08/09/2017 low). A gradual rise towards the major resistance at 125.86 (05/06/2015 high) seems unlikely. Expected to decline further support at 101.20 (09/11/2016 low).

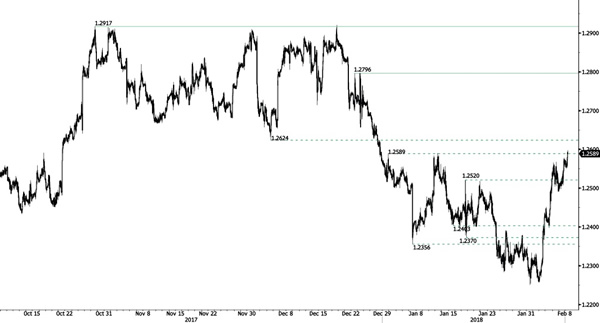
GBP/USD Riding Down
GBP/USD's bearish pressure pushed the pair at the range of 1.38. The technical structure suggests further potential downside move. Hourly support at 1.3916 (23/01/2018 low) is now broken.
The long-term technical pattern is reversing. The Brexit vote had paved the way for further decline but the pair is moving to 2016 highs. A long-term support given at 1.1841 (07/10/2017 low) and a strong resistance at 1.5018 (24/06/2016 high) are identified.
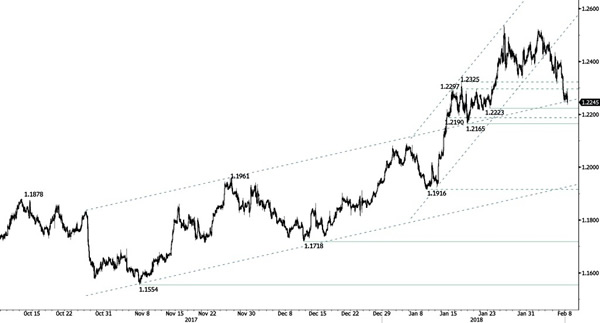
EUR/USD Heading Towards 1.2223
EUR/USD is trading lower, approaching support at 1,2223 (23/01/2018 low). The technical structure suggests further short-term downside moves.
In the longer term, the momentum is turning largely positive. We favor a continued bullish bias. Key resistance is holding at 1.2886 (15/10/2014 high) while strong support lies at 1.1554 (08/11/2017 low)
BoE To Signal Summer Rate Hike?
Super Thursday: BoE to raise its forecast
The UK economy is doing fine. According to the first estimates, the economy grew by 1.5%y/y in the last quarter (beating estimates of 1.4%), which indicates that the UK also benefited from the acceleration of the global economy, together with a little help from a weaker pound sterling. The labour market remained strong with the ILO unemployment rate stabilising at 4.3%. Finally, inflation remains on a solid footing with the core measure stabilising at 2.5%y/y in December.
Against such a backdrop, the Bank of England will have no choice but to revise to the upside its forecast for both economic growth and inflation. Investors have already started to adjust their tightening expectation. The market is not expecting an increase of borrowing rates as soon as May (51% chance of a rate hike according to probabilities extracted from overnight index swap).
However, according to the option market, investors are a bit nervous ahead of the BoE decision. Implied volatilities – for most maturities – have increased, while the 25-delta risk reversal measure moved further in negative territory. All this suggests that investors are also considering that the BoE could stay on the back foot by remaining extremely cautious in its communication.
GBP/USD is currently trading at around 1.3850, down 0.20% on the day. The first resistance area lies at around 1.4290 (high from last Friday), while a stronger one can be found at 1.4345 (high from January 25th). On the downside, a support stands at around 1.3655 (previous high from September 20th and lows from mid-January).
Indian economy confirms its recovery
Providing strong growth numbers following 2017 Annual GDP growth of 7.10%, 2017 December CPI and WPI Y/Y of 5.21% and 3.58% respectively, we see further potential for recovery in India. Following major growth impediments essentially caused by: declining exports (between November and December 2018: -18.20%), cancellation of 86% of money in circulation (impact affecting 2017 economic year), the July 2017-released Goods and Services Tax roll-out misunderstanding and the oil price hike in the middle of 2017. In order to counter these drawbacks on Indian growth, the Indian Government took the decision to make use of fiscal stimulus, reducing corporate taxes by 25% for companies with turnover of up to INR 2.50 billion (USD 39 million), applicable for more than 99% of Indian companies that issue surplus, which in turn will be stimulating job creation (unemployment rate stagnates at 8.80%, in line with 2002 numbers).
In this economic context, the Reserve Bank of India confirmed yesterday its willingness to maintain its Repo rate at 6%, unchanged since February 8th 2017, limiting further debt increase (Indian debt in % of GDP published at 50.10%) and trying to contain inflation in its 2%-6% band range.
Since recent RBI communications, Indian 10 years Government Bonds yields declined by -0.52% while the S&P BSE Sensex rose by 1.58%, pushing investor expectations higher for 2018. USD/INR is trading at 64.25 (-5.82% since January 2017), signaling positive economic signals for the Indian economy.
AUD/NZD 4H Chart: Re-Tested Upper Channel
The Australian Dollar continued to be trading in a down channel against the New Zealand Dollar after hitting the upper boundary of the dotted channel on January 29.
The currency exchange rate could continue moving south after the upper channel is re-tested .
During the following trading sessions, the movement is likely to continue downwards to find support at the monthly S2 at 1.0725. In addition, technical indicators favour a further decline for the AUD/NZD pair.
AUD/CAD 4H Chart: Pair Confined By Bearish Patterns
After touching the lower boundary of the dominant channel the Aussie has been gaining strength against the Canadian Dollar since early December.
A new junior channel has been drawn to monitor the current market movement. By the time of this analysis, the pair had breached the lower boundary of the dominant channel.
Everything being equal, bears are likely to continue their dominance against the currency exchange rate until it finds support cluster of the weekly and monthly PPs near the 0.9762 mark.
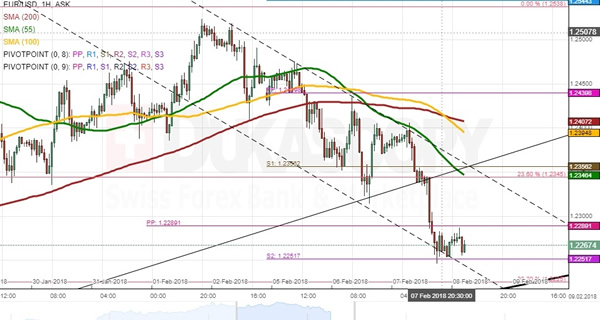
EURUSD Analysis: Falls Down To 1.2250
As previosuly expected, the 55-hour SMA at 1.24 was an unbreakable resistance for EUR/USD which allowed bears to resume dictating the market direction. The pair hindered slightly near the lower boundary of the two-month ascending channel and the 23.60% Fibo retracement located near 1.2345, but was nevertheless pushed down to the weekly S2 where it was trading on Thursday morning. Technical indicators are gradually recovering from their lows, thus pointing to a possible surge in this session. It is expected that the Euro tries to form a retracement from the breached channel circa 1.2350. This area, likewise reinforced by the 55-hour SMA, the 23.60% Fibo and the weekly S1, is likely to be the top for today. In case the weekly S2 is breached, losses should be limited at 1.2225.
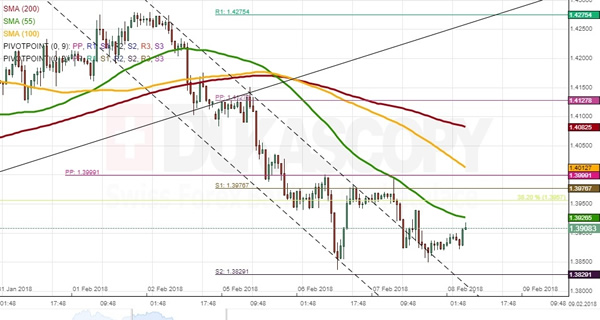
GBPUSD Analysis: Awaits BOE Data
GBP/USD was trading in a calm manner slightly below the monthly PP and the weekly S1 on Wednesday morning. However, the bearish pressure from the 55-hours SMA resulted in a brief southward movement down to the 1.3850 mark. It is likely that this moving average continues to guide the Sterling within the following trading hours until fundamentals from the Bank of England scheduled for 1200GMT introduce volatility in the market. The daily high should be the 1.4050 area, while other resistance levels along the way are also expected to hinder strong hourly surges. From the downside, the pair is supported by the weekly S2 at 1.3829. In case of strong downside risks, the Pound could try to test the 1.37 level, reinforced by the weekly S2 and the monthly S1.