Sample Category Title
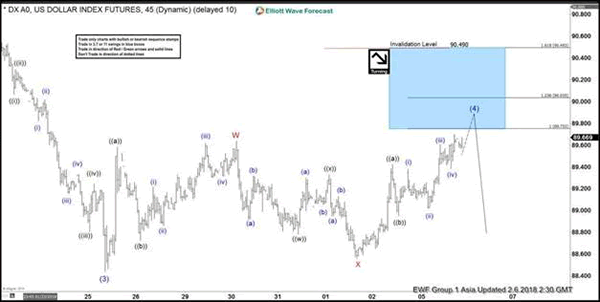
Elliott Wave View: DXY Ending Correction
DXY Short Term Elliott Wave view suggests that Intermediate wave (3) ended with the decline to 88.44. The Index is correcting in Intermediate wave (4) to as a double three Elliott Wave structurewhere Minor wave W ended at 89.64 and Minor wave X ended at 88.55. Near term focus is on 89.75 – 90.49 areea to end Minor wave Y of (4), then Index should resume the decline lower or pullback in 3 waves at least. We don’t like buying the Index and expect sellers to appear from the above area for a 3 waves pullback at least.
DXY 1 Hour Elliott Wave Chart
Market Morning Briefing: Dow (24345.75, -4.60%) Has Come Off Sharply Breaking Below Our Mentioned 24500 Level Yesterday
STOCKS
Globally stock indices are down and have entered into a sharp corrective more after the long 1-2 month rally. Corrective dip is likely to continue this week. All indices seem to be above crucial important supports which if breaks could push the indices further down in the medium term.
Dow (24345.75, -4.60%) has come off sharply breaking below our mentioned 24500 level yesterday. Immediate support is visible near 23500. That if holds, could keep the index range-bound for a few sessions; else a further fall towards 23350 or lower is possible. Need to see if 23500 holds just now.
Dax (12687.49, -0.76%) has broken below 12700 too and while the indices are down globally, Dax could head towards 12600 in the near term. A break below 12600, if seen could turn very bearish (towards 12200-12000) for the medium term.
Nikkei (21487.87, -5.26%) is down sharply as well and is ready to test support near 21000. Note that this is an immediate crucial support below current levels and in case the bears take the index below 21000, it could trigger a medium term bearishness towards much lower levels in the coming weeks.
Shanghai (3417.81, -2.00%) seems to be stuck in the 3500-3390 region as mentioned yesterday. But while the other indices are down globally, Shanghai too could possibly try o come down to test levels below 3390. Need to see if 3390 holds or breaks over the next couple of sessions.
Nifty (10666.55, -0.87%) and Sensex (34757.16, -0.88%) are down sharply much in line with our expectations and while the correction continues, the indices could be headed towards 10400-10380 and 34250-34000 respectively. Note that the SGX Nifty (10323, -3.48%) is down sharply and could well pull down the Indian stock indices on opening today morning.
COMMODITIES
Brent (66.97) and WTI (63.46) are both down as expected. The Crude prices could head lower in the coming sessions. Brent has support at 65 which if holds could take it higher again in the longer run, else the price could continue to dip towards 63-62 levels. WTI on the other hand could test 62 in the near term. View is bearish for the coming sessions.
Gold (1344.18) is stuck in the 1350-1320 region and is likely to remain so for another couple of sessions with a possible chance of testing 1360-1370 on the upside.
Copper (3.1765) is likely to bounce back from 3.17 to move again towards 3.25. Unless a break on either side of 3.17-3.25 region is seen, it would be difficult to project the further course of direction.
FOREX
Dollar Index (89.653) as per expectations, is seeing some strengthening towards 90. There might be some resistance provided by earlier support near 90 on 3 day candles.
Euro (1.2368) has dipped in line with our expectation of a near-term correction down to 1.2350. It could test 1.23 (earlier resistance on the weekly candles which might now provide support) in a week’s time.
Importantly, Dollar-Yen (108.66) has come down a bit, as the 21-day Moving Average Resistance on the daily line charts near 110.50 has held well. Could we be headed down towards 108 and 107? This is a BIG question. It could impact other markets also.
Euro Yen (134.46) has had a significant fall as the Euro weakened against the Dollar, while the Yen saw strengthening. There is important support on daily , 3 day and weekly candles near 134 which should hold in the near term.
Pound (1.3959) is very close to the 21 days moving average line on daily line charts after having dipped from resistance near 1.425-1.43 on the 3 day candles and the daily line chart last week. While it stays above this 21 days moving average line, it could again rise up to test 1.43.
Dollar Rupee (64.3950) has opened much higher than yesterday's close near 64.06 on back of renewed Dollar strength and weakness in Asian equity indices. It could test 64.5-64.6 today.
INTEREST RATES
Elevated global bond yields since the past few days have finally drawn investors away from equity towards debt. There is a huge equity sell off underway leading to a rise in bond prices and consequently a dip in yields
US 10 Year Yield (2.6776), US 30 year Yield (3.0027), US 5 year yield (2.4), US 2 year yield (1.9898) have all fallen quite dramatically from respective long term resistance levels. The 10 year might find some support near 2.62 and consolidate above that in the days to come. The 5 Year yield has immediate support near 2.4 on the medium term chart and might now respect this support. The 30 year has resistance near 3.10 on the medium term chart, and it might now look to stay below that level in the near term.
Japan 10 year yield (0.072) has fallen towards support near 0.07 on the short term charts and might consolidate around these levels now.
German 10 year yield (0.736) has also dipped and has strong support near 0.7 on the medium term chart which should hold for now.
RBA Left Policy Rate At 1.5%, More Upbeat Over Growth And Inflation Outlook
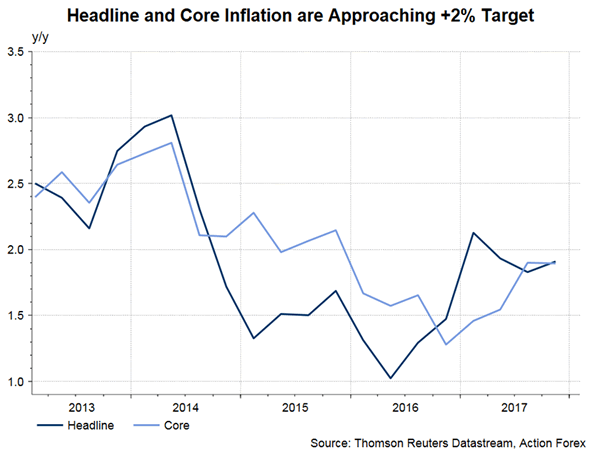
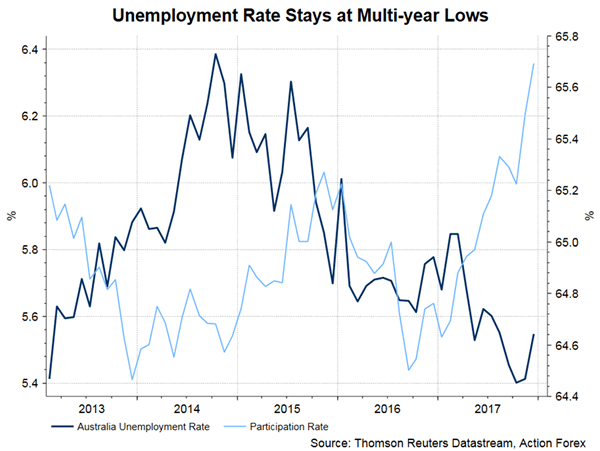
In its first meeting in 2018, RBA maintained the cash rate unchanged at 1.5%. The decision had been widely anticipated. As suggested in the accompanying statement, the central bank continued to see positive economic developments both globally and at home. Policymakers have turned slightly more upbeat over the domestic growth outlook, projecting GDP to expand 'a bit above 3% over the next couple of years'. Meanwhile, RBA revealed that the central forecast for CPI is 'a bit above 2% in 2018. This marks a more hawkish tone when compared with December’s language. While the job market has improved a lot, with the unemployment rate falling to the lowest level in 4.5 years, wage growth has remained lackluster. This has raised concerns over household expenditure.
Ahead of the quarterly Statement of Monetary Policy, RBA has upgraded its assessment over the growth and inflation outlook. it noted that the central forecast for the Australian economy is for 'GDP growth to pick up, to average a bit above +3% over the next couple of years', as supported by the data over the summer. It added that 'business conditions are positive and the outlook for non-mining business investment has improved'. The most worrisome area is 'household consumption' which has been hampered by slow growth in household incomes and elevated debt levels. In December, policymakers noted that GDP is expected to grow by 'around 3% over the next few years'. On inflation, policymakers retained the view of low inflation with 'both CPI and underlying inflation running a little below 2%. While seeing inflation stay low 'for some time, reflecting low growth in labour costs and strong competition in retailing', RBA expects 'a gradual pick-up' as helped by the strong economy. The central bank noted that the central forecast for CPI inflation is 'a bit above 2% in 2018'. At the December meeting, policymakers noted that inflation remained low and the central forecast was 'for inflation to pick up gradually as the economy strengthens'.
On the monetary policy outlook, RBA retained the view that 'the low level of interest rates is continuing to support the Australian economy'. It added at this meeting that 'further progress in reducing unemployment and having inflation return to target is expected, although this progress is likely to be gradual'. The market has priced in higher chance for a first rate hike in 2H18.
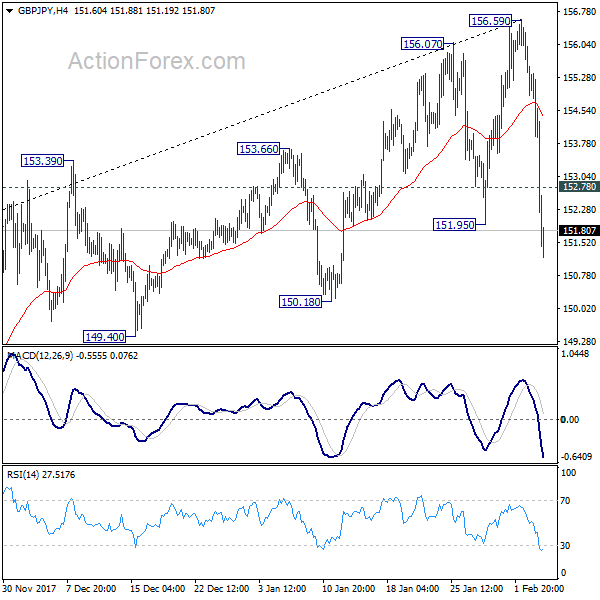
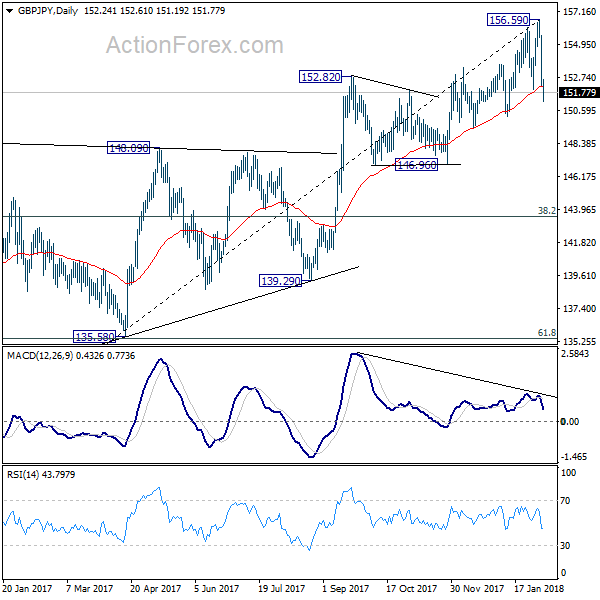
GBP/JPY Daily Outlook
Daily Pivots: (S1) 151.21; (P) 153.37; (R1) 154.47; More...
GBP/JPY's decline from 156.59 accelerates to as low as 151.19 so far. Brea of 151.95 support indicates short term topping. Intraday bias is back on the downside for 150.18 support first. Considering bearish divergence condition in daily MACD, break of 150.18 will suggest trend reversal and bring deeper fall through 146.96 support. On the upside, above 152.78 minor resistance will turn intraday bias neutral first.
In the bigger picture, as long as 146.96 key support holds, medium term outlook remains bullish. Rise from 122.36 is in favor to extend to 61.8% retracement of 195.86 to 122.36 at 167.78. However, break of 146.96 support will indicate trend reversal. In that case, deeper fall would be seen to 38.2% retracement of 122.36 to 156.59 at 143.51 and then 61.8% retracement at 135.43.
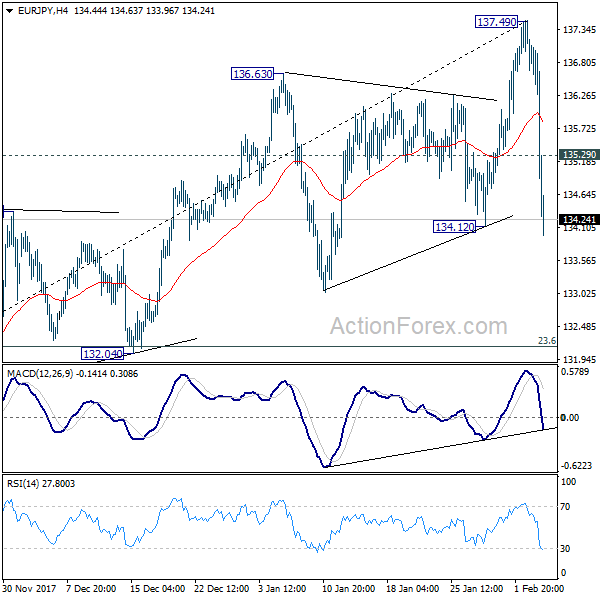
EUR/JPY Daily Outlook
Daily Pivots: (S1) 134.20; (P) 135.68; (R1) 136.45; More....
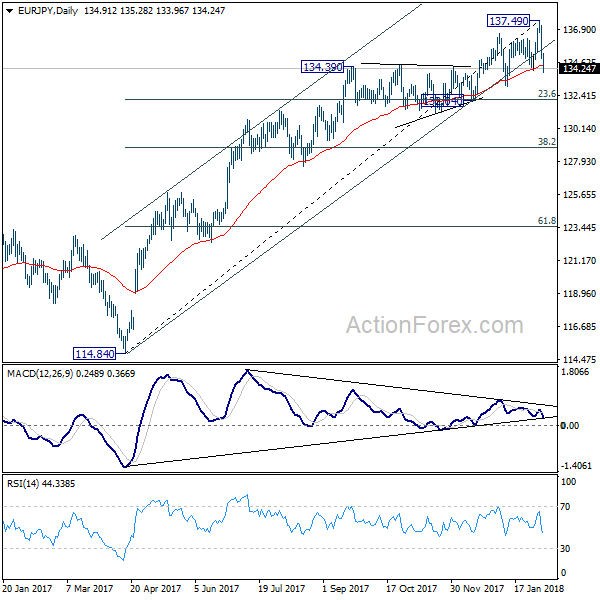
EUR/JPY's fall from 134.70 accelerates to as low as 133.96 so far. Breaching of 134.12 support suggests that a short term top is already in place. Considering bearish divergence condition in daily MACD, near term trend could have reversed too. Intraday bias is now on the downside for 132.04 cluster support first (23.6% retracement of 114.84 to 137.49 at 132.14). On the the upside, above 135.29 minor resistance will turn intraday bias neutral first.
In the bigger picture, medium term rise from 109.03 (2016 low) is seen as at the same degree as the down trend from 149.76 (2014 high) to 109.03 (2016 low). It should be targeting 141.04/149.76 resistance zone. On the downside, break of 132.04 support, however, will be an early sign of trend reversal and will bring deeper fall back to 124.08 key medium term support.
EUR/GBP Daily Outlook
Daily Pivots: (S1) 0.8821; (P) 0.8847; (R1) 0.8882; More...
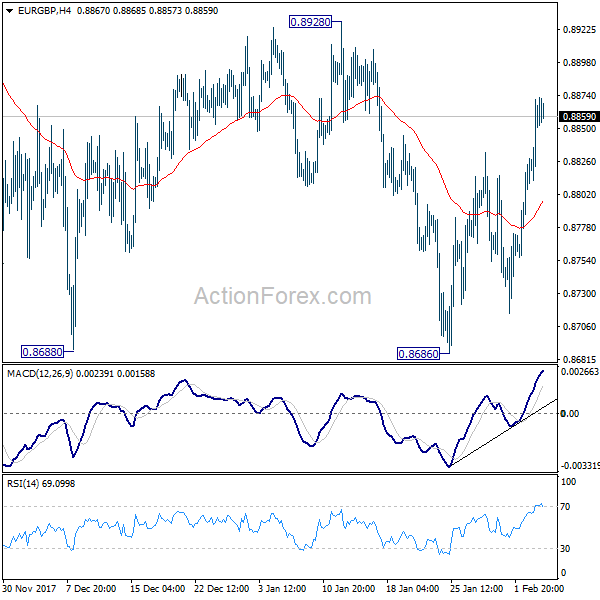
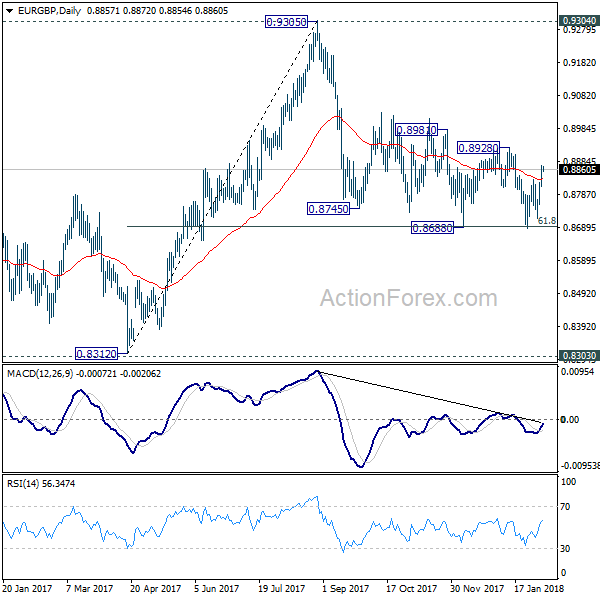
EUR/GBP's rebound from 0.8686 extends higher. But it's still bounded in inside 0.8686/8928. Intraday bias remains neutral first. And, near term outlook will remain mildly bearish as long as 0.8928 resistance holds. On the downside, firm break of 0.8686 will resume whole decline from 0.9305. As 61.8% retracement of 0.8312 to 0.9305 should then be taken out too. Deeper decline would be seen to retest 0.8303/8312 support zone. Nonetheless, on the upside, break of 0.8928 will indicate near term reversal and turn outlook bullish for 0.9304 resistance.
In the bigger picture, there are various ways to interpret price actions from 0.9304 high. But after all, firm break of 0.9304/5 is needed to confirm up trend resumption. Otherwise, range trading will continue with risk of deeper fall. And in that case, EUR/GBP could have a retest on 0.8303. But we'd expect strong support from 0.8116 cluster support (50% retracement of 0.6935 to 0.9304 at 0.8120) to contain downside.
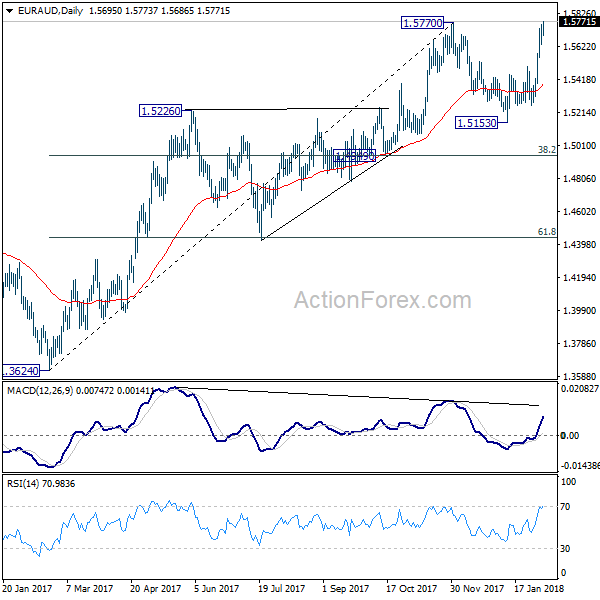
EUR/AUD Daily Outlook
Daily Pivots: (S1) 1.5635; (P) 1.5695; (R1) 1.5757; More....
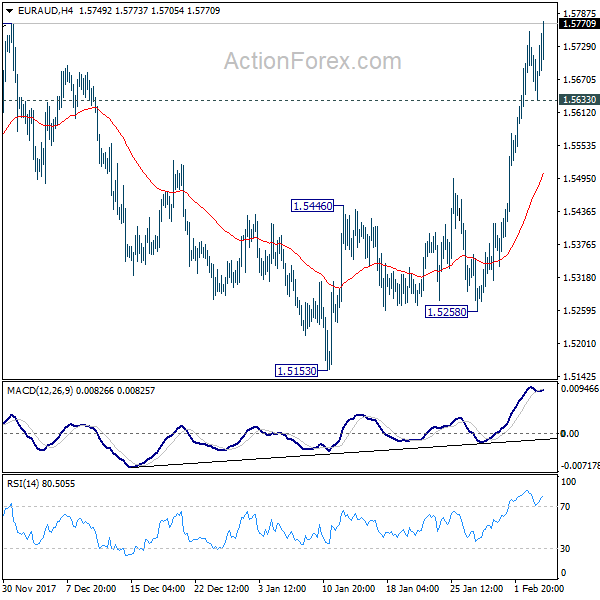
EUR/AUD's rally continues today and breach of 1.5770 resistance suggests that medium term rise from 1.3264 is resuming. Intraday bias remains on the upside. Sustained trading above 1.5770 will pave the way to 1.6587 key long term support. Nonetheless, below 1.5633 minor support will dampen this bullish case and turn intraday bias neutral first.
In the bigger picture, medium term rise from 1.3624 is not completed yet. Break of 1.5770 will extend the rise to retest 1.6587 (2015 high). However, considering bearish divergence condition in daily MACD, sustained break of 1.4949 cluster support (38.2% retracement of 1.3624 to 1.5770 at 1.4950) will indicate medium term reversal. And there is prospect of retesting 1.3624 low in that bearish case.
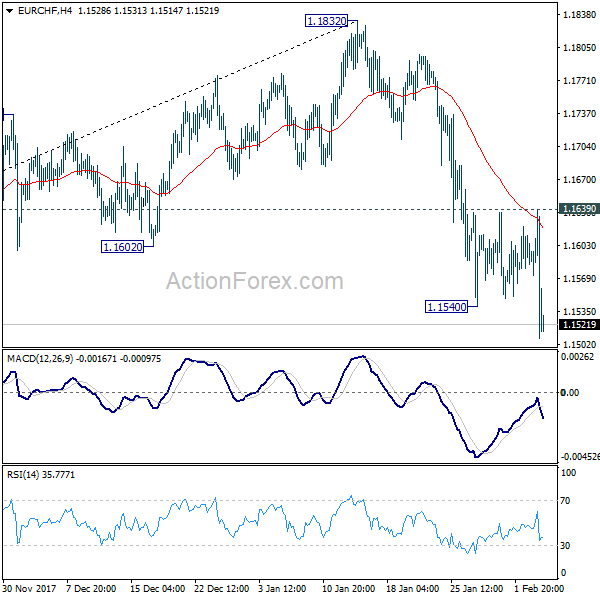
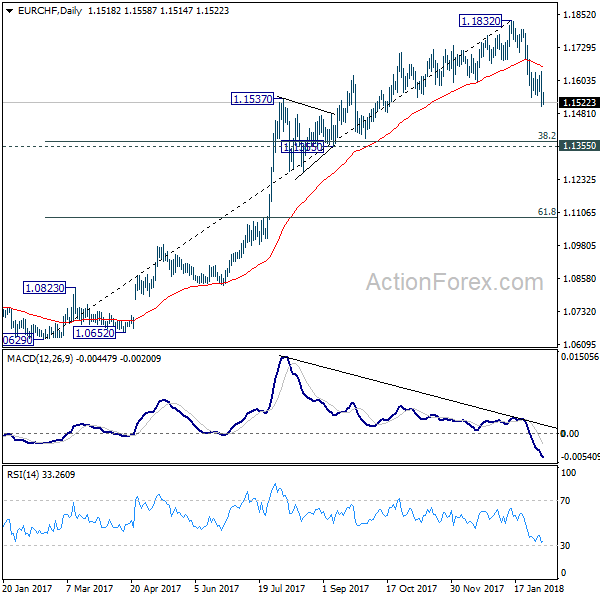
EUR/CHF Daily Outlook
Daily Pivots: (S1) 1.1472; (P) 1.1555; (R1) 1.1603; More...
EUR/CHF's fall from 1.1832 resumed and reaches as low as 1.1507 so far. Intraday bias is back on the downside. As noted before, the decline from 1.1832 is correcting medium term rise from 1.0629. Next target will be 1.1355 cluster support (38.2% retracement of 1.0629 to 1.1832 at 1.1372.) On the upside, break of 1.1639 resistance is needed to indicate short term bottoming. Otherwise, outlook will remain bearish in case of recovery.
In the bigger picture, a medium term top should be in place at 1.1832 on bearish divergence condition in daily MACD. But there is no indication of long term reversal yet. As long as 1.1198 resistance turned support holds, we'd still expect another rise through prior SNB imposed floor at 1.2000.
(RBA) Statement by Philip Lowe, Governor: Monetary Policy Decision
At its meeting today, the Board decided to leave the cash rate unchanged at 1.50 per cent.
There was a broad-based pick-up in the global economy in 2017. A number of advanced economies are growing at an above-trend rate and unemployment rates are low. Growth has also picked up in the Asian economies, partly supported by increased international trade. The Chinese economy continues to grow solidly, with the authorities paying increased attention to the risks in the financial sector and the sustainability of growth.
The pick-up in the global economy has contributed to a rise in oil and other commodity prices over recent months. Even so, Australia's terms of trade are expected to decline over the next couple of years, but remain at a relatively high level.
Globally, inflation remains low, although higher commodity prices and tight labour markets are likely to see inflation increase over the next couple of years. Long-term bond yields have risen but are still low. As conditions have improved in the global economy, a number of central banks have withdrawn some monetary stimulus. Financial conditions remain expansionary, with credit spreads narrow.
The Bank's central forecast for the Australian economy is for GDP growth to pick up, to average a bit above 3 per cent over the next couple of years. The data over the summer have been consistent with this outlook. Business conditions are positive and the outlook for non-mining business investment has improved. Increased public infrastructure investment is also supporting the economy. One continuing source of uncertainty is the outlook for household consumption. Household incomes are growing slowly and debt levels are high.
Employment grew strongly over 2017 and the unemployment rate declined. Employment has been rising in all states and has been accompanied by a significant rise in labour force participation. The various forward-looking indicators continue to point to solid growth in employment over the period ahead, with a further gradual reduction in the unemployment rate expected. Notwithstanding the improving labour market, wage growth remains low. This is likely to continue for a while yet, although the stronger economy should see some lift in wage growth over time. There are reports that some employers are finding it more difficult to hire workers with the necessary skills.
Inflation is low, with both CPI and underlying inflation running a little below 2 per cent. Inflation is likely to remain low for some time, reflecting low growth in labour costs and strong competition in retailing. A gradual pick-up in inflation is, however, expected as the economy strengthens. The central forecast is for CPI inflation to be a bit above 2 per cent in 2018.
On a trade-weighted basis, the Australian dollar remains within the range that it has been in over the past two years. An appreciating exchange rate would be expected to result in a slower pick-up in economic activity and inflation than currently forecast.
Nationwide measures of housing prices are little changed over the past six months, with prices having recorded falls in some areas. In the eastern capital cities, a considerable additional supply of apartments is scheduled to come on stream over the next couple of years. To address the medium-term risks associated with high and rising household indebtedness, APRA introduced a number of supervisory measures. Tighter credit standards have also been helpful in containing the build-up of risk in household balance sheets.
The low level of interest rates is continuing to support the Australian economy. Further progress in reducing unemployment and having inflation return to target is expected, although this progress is likely to be gradual. Taking account of the available information, the Board judged that holding the stance of monetary policy unchanged at this meeting would be consistent with sustainable growth in the economy and achieving the inflation target over time.
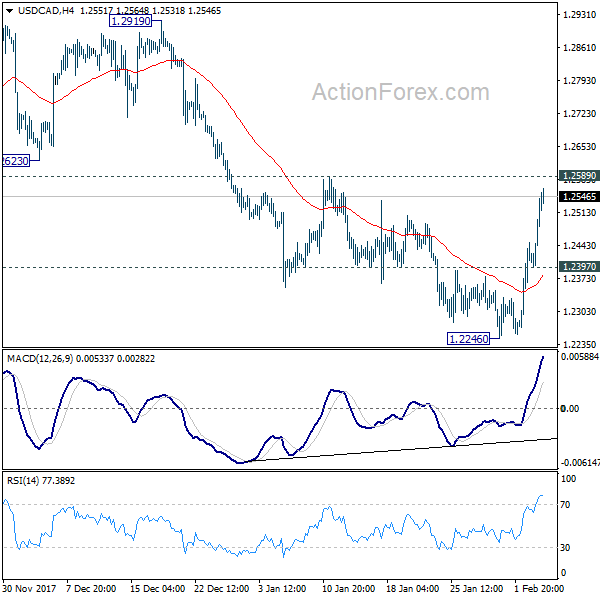
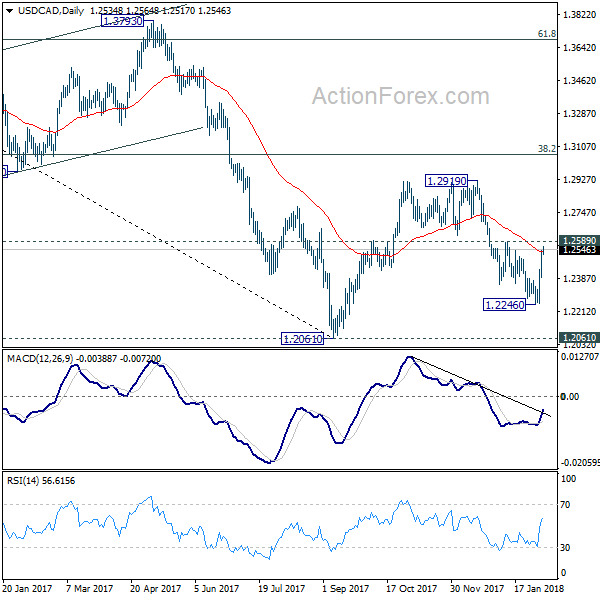
USD/CAD Daily Outlook
Daily Pivots: (S1) 1.2443; (P) 1.2492; (R1) 1.2588; More...
Intraday bias in USD/CAD remains on the upside at this point. Rebound from 1.2246 short term bottom should extend to 1.2589 resistance first. Firm break there will indicate that pull back from 1.2919 has completed and and would bring retest of this resistance. On the downside, below 1.2397 minor support will turn focus back to 1.2246 instead.
In the bigger picture, rebound from 1.2061 is likely completed completed at 1.2919, rejected by 55 week EMA and kept below 38.2% retracement of 1.4689 to 1.2061 at 1.3065. The development also suggests that long term fall from 1.4689 is not completed yet. Decisive break of 1.2061 low will target 61.8% retracement of 0.9406 to 1.4689 at 1.1424. This will now be the favored case as long as 1.2919 resistance holds.