
Sample Category Title
USD/CAD Weakening
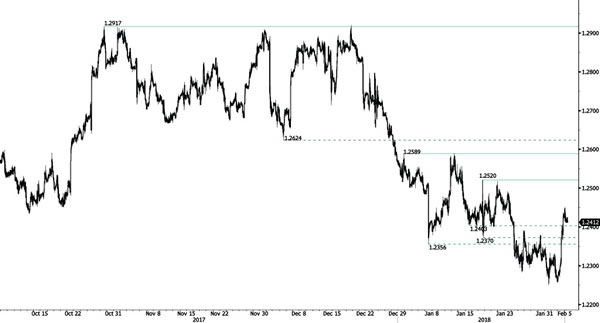
USD/CAD is trading lower. Hourly resistance is given at 1.2520 (17/01/2018 high) while further resistance given at 1.2589 (01/01/2018) is momentarily out of reach. The technical structure indicates that additional weakness is achievable.
In the longer term, the pair is trading between resistance point at 1.3805 (05/05/2017 high) and support at 1.2128 (18/06/2015 low). Strong resistance is given at 1.4690 (22/01/2016 high). The pair is likely to head lower. The pairs is trading below 200 DMA.
USD/CHF Downtrend Resumes
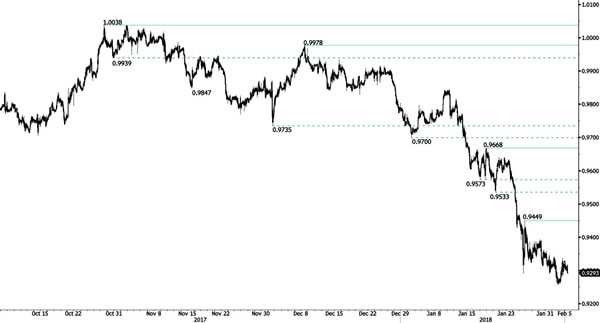
USD/CHF is trading lower following a recent rise up to 0.9336 (02/02/2018 high). The technical structure indicates that further weakness is likely. Hourly resistance is at 0.9449 (25/01/2018 high). Expected to show further short-term downside move.
In the long-term, the pair is still trading in range since 2011 despite some turmoil when the SNB unpegged the CHF. Key support remains at 0.9072 (07/05/2015 low) while resistance at 1.0344 (15/12/2016 high) is distanced. The technical structure favours a long term bullish bias since the unpeg in January 2015.
USD/JPY Pushing Towards 109.80
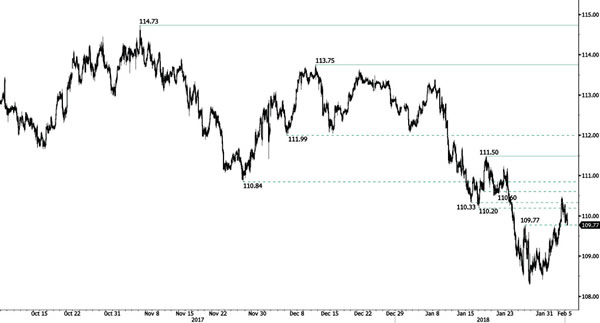
USD/JPY is rising following weakness and trades above 109.50. Hourly support remains at 111.50 (18/01/2018 high). The technical structure suggests further short-term upside move.
We favor a long-term bearish bias. Support is now given at 107.32 (08/09/2017 low). A gradual rise towards the major resistance at 125.86 (05/06/2015 high) seems unlikely. Expected to decline further support at 101.20 (09/11/2016 low).
GBP/USD Upward Oriented
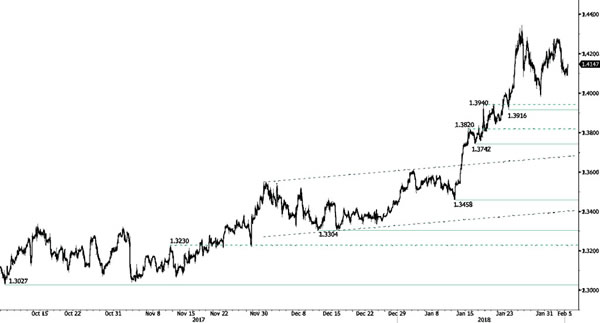
GBP/USD is trading lower but appears to head back towards 1.42. The technical structure indicates weakness. Hourly support is given at 1.3916 (23/01/2018 low).
The long-term technical pattern is reversing. The Brexit vote had paved the way for further decline but the pair is now moving up to 2016 highs. A long-term support given at 1.1841 (07/10/2017 low) and a strong resistance at 1.5018 (24/06/2016 high) are identified.
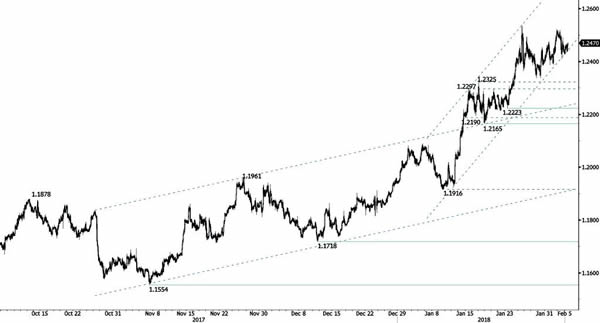
EUR/USD Bouncing
EUR/USD is recovering from its recent decrease. The pair is now retracing and lies well above 1.2325 (17/01/2018 high). Hourly support is given at 1.2223 (23/01/2018 low). The technical structure suggests further short-term upside moves.
In the longer term, the momentum is turning largely positive. We favor a continued bullish bias. Key resistance is holding at 1.2856 (15/10/2014 high) while strong support lies at 1.1554 (08/11/2017 low).
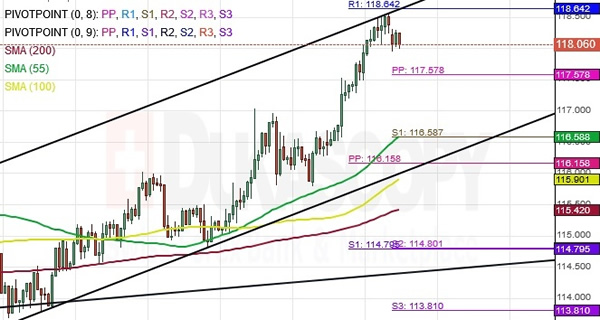
CHF/JPY 4H Chart: Meet Monthly Resistance
The Swiss Franc has been trading in an ascending channel against the Japanese Yen since early January.
During the past week, the pair has formed a new high at 118.50. However, the rally was stopped by the monthly resistance at the 118.64 mark to retrace for a brief period of time.
The pair is likely to continue trading north, Technical indicators are in favor for the Swiss Franc to continue its rally against the Yen during the following trading sessions
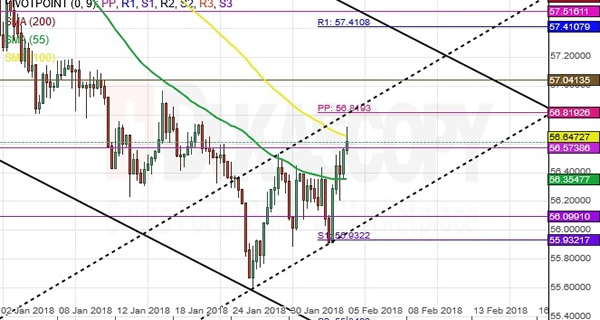
USD/RUB 4H Chart: Formed New Medium-Term Channel
The US Dollar has started to gain strength against the Russian Ruble after reaching an historical low level at 55.58.
The pair has formed a new medium-term channel, and the price is gradually moving north to test the upper boundary in combination with the monthly pivot point at the 56.64 mark.
In regards to the near future, analysts expect that the pair is likely to continue its rally until it breach the upper boundary of the medium-term channel. If and when its occurs, the pair might find resistance at the monthly R1 at 57.41.
Technical Outlook: SPOT GOLD – Limited Recovery Seen Ahead Of Fresh Weakness
Spot Gold is consolidating on Monday after Friday's sharp fall on upbeat US jobs data which boosted hopes for Fed's more aggressive approach to US monetary policy this year.
The yellow metal fell by 1.3% on Friday in the biggest one-day fall in nearly two months, generating bearish signal on completion of H&S pattern on daily chart as well as strong bearish weekly close.
Improved sentiment for the US dollar keeps gold price at the back foot, with limited recovery action seen ahead of fresh weakness.
Broken H&S neckline ($1340) and broken 10SMA ($1343) mark solid resistances which are expected to limit upside attempts and keep near-term bearish bias intact.
Bears could extend to $1316 (Fibo 38.2% of $1236/$1366, 12 Dec / 25 Jan rally) on break below Friday's low at $1327.
Conversely, immediate bears could be delayed if recovery rally clearly breaks above 10SMA, while lift above lower top at $1351 (01 Feb) is needed to neutralize bears and signal that corrective pullback from $1366 to $1327 might be over.
Res: 1340, 1343, 1351, 1357
Sup: 1327, 1324, 1320, 1316
Technical Outlook: AUDUSD Bounces, Boosted By Upbeat Chinese Data, But Limited Recovery Seen For Now
The Australian dollar bounces on Monday after pullback from 0.8135 peak which accelerated on Friday, found footstep at 0.7892 (Fibo 38.2% of 0.7500/0.8135, 11 Dec/26 Jan rally). Near-term sentiment was boosted by upbeat Chinese Caixin services PMI which was released overnight and hit the highest since May 2012. However, limited corrective action is expected as Friday's daily long red candle weighs along with strong bearish signal that developed on weekly chart after strong bearish weekly close which came after seven consecutive bullish weeks. Broken daily Kijun-sen marks initial barrier at 0.7960, followed by broken 20SMA/Fibo 38.2% of 0.8135/0.7892 pullback at 0.7984, with extended upticks expected to hold below psychological 0.80 barrier, before fresh push lower. Break below 0.7892 pivot could trigger fresh bearish extension towards 0.78 zone (09/10Jan trough). Conversely, stronger recovery through 0.80 barrier needs to regain broken 10SMA (0.8032) to neutralize bearish threats.
Res: 0.7960; 0.7984; 0.8000; 0.8032
Sup: 0.7892; 0.7847; 0.7817; 0.7800
Forex Technical Analysis: EUR/USD, USD/JPY, GBP/USD
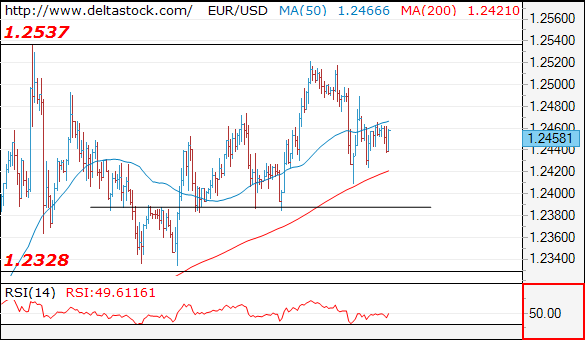
EUR/USD
Current level - 1.2458
The bias is bearish below 1.2480 minor resistance, for a break through 1.2390 support, towards 1.2330 area.
| Resistance | Support | ||
| intraday | intraweek | intraday | intraweek |
| 1.2480 | 1.2540 | 1.2390 | 1.2330 |
| 1.2540 | 1.2870 | 1.2330 | 1.2220 |
USD/JPY
Current level - 109.82
My outlook is positive above 109.70, for another rise towards 111.90 zone. Crucial on the downside is 109.20 low.
| Resistance | Support | ||
| intraday | intraweek | intraday | intraweek |
| 110.50 | 111.90 | 109.70 | 108.30 |
| 111.90 | 113.40 | 109.20 | 107.30 |

GBP/USD
Current level - 1.4118
A reversal has been confirmed at 1.4275 and my outlook remains bearish, for a break through 1.4090, towards 1.3910 area. Minor intraday resistance is projected at 1.4200.
| Resistance | Support | ||
| intraday | intraweek | intraday | intraweek |
| 1.42800 | 1.4340 | 1.4090 | 1.3910 |
| 1.4275 | 1.4730 | 1.3980 | 1.3730 |
