Sample Category Title
EUR/USD Consolidating Gains Above 1.2400, Dollar Advances Post NFP
Key Highlights
- The Euro seems to be struggling to move above 1.2500 against the US Dollar.
- There is a major bullish trend line forming with support at 1.2400 on the 4-hours chart of EUR/USD.
- The US nonfarm payrolls increased 200K in Jan 2018, more than the forecast of 180K.
- Today, the Euro Zone Services PMI for Jan 2018 will be released, which is forecasted to remain at 57.6.
EURUSD Technical Analysis
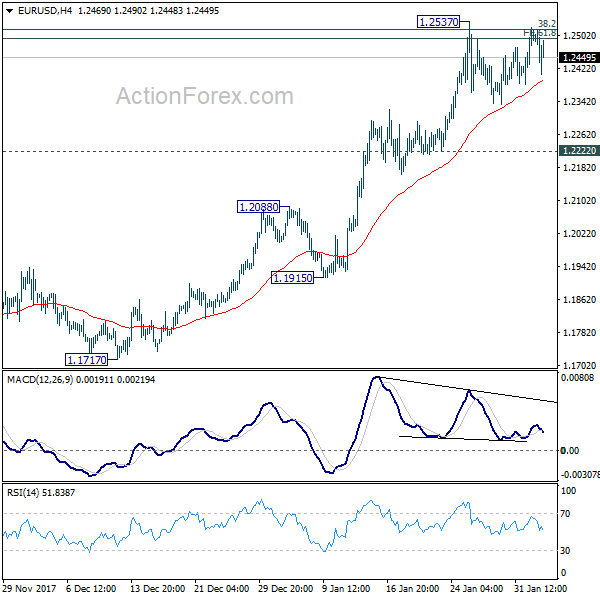
The Euro remained in a bullish trend this past week and settled above 1.2400 against the US Dollar. The EUR/USD pair is currently consolidating, with resistances on the upside at 1.2510 and 1.2520.
This past week, there was an upside break above 1.2400 in EUR/USD and the pair traded above 1.2500. A new year high was formed at 1.2520 from where a short-term correction was initiated. Recently, the pair broke the 50% Fib retracement level of the last wave from the 1.2336 low to 1.2520 high.
However, the current price action is positive as long as the pair is above 1.2400 and 1.2380. There is also a major bullish trend line forming with support at 1.2400 on the 4-hours chart.
An intermediate support is near the 61.8% Fib retracement level of the last wave from the 1.2336 low to 1.2520 high at 1.2406. On the upside, there is a connecting bearish trend line forming with resistance at 1.2510.
A break above the 1.2510 level and the 1.2520 high could open the doors for more gains. On the flip side, a daily close below 1.2400 may ignite an extended downside move in EUR/USD.
This past Friday, the US saw January’s nonfarm payrolls report by the US Department of Labor. The market was looking for an increase of 180K, more than the last 148K.
However, the actual result was better since the US NFP came in at 200K. Moreover, the last reading was revised up from 148K to 160K. The report stated:
Employment continued to trend up in construction, food services and drinking places, health care, and manufacturing. In January, the unemployment rate was 4.1 percent for the fourth consecutive month. The number of unemployed persons, at 6.7 million, changed little over the month.
Overall, the report was positive and helped the greenback. The USD/JPY pair climbed higher and closed the week above the 110.00 level. On the other hand, GBP/USD declined and corrected toward the 1.4080-1.4100 levels.
Market Morning Briefing: Euro-Yen Is Testing Resistance Near 137 On The Daily Candles
STOCKS
Almost all global stocks are in a corrective mode and have fallen sharply in the last few sessions. It would be important to watch price action near current levels to decide the further course of direction.
Dow (25520.96, -2.54%) has possibly seen the sharpest corrective fall last week since the rally that started from levels near 15500 in Feb’16. With this there could be some possibility of some more fall towards 25000-24500 levels before again resuming the uptrend. Near term looks bearish just now within the broad long term up trend. .
Dax (12785.16, -1.68%) is also trading lower and could test support near 12700 which my hold in the coming sessions and possibly initiate a bounce back towards 13000. A break below 12700 could turn bearish for the medium term forcing us to project levels near 12600-12400. Watch price action near current levels.
Nikkei (22728.83,-2.34%) opened with a gap down today and is almost trading near immediate support levels at 22700. A break below this levels, if seen and sustained only can indicate further bearishness indicating levels near 22600-22400 in the medium term. Else a bounce back towards 23000 or higher is possible. Watch price action near current levels.
Shanghai (3443.11, -0.55%) has already tested 3390 on the downside last week and may try to attempt a rise back towards 3510 in the near term. Else a sideways consolidation within 3390-3500 is possible in the near term.
Nifty (10760.60, -2.33%) and Sensex (35066.75, -2.34%) have initiated a sharp fall and could test immediate support near 10550 and 34000 respectively as visible on the 3-day candle charts. Thereafter, a short bounce is possible. Near term looks bearish.
COMMODITIES
Brent (67.75) and WTI (64.71) have come off again contrary to our expectation of a small rise. Brent is likely to move down in the near term towards 66-65 levels while WTI is holding above 64. There could be some scope of testing 64.00-63.75 in the near term.
Gold (1330.83) indeed moved up to test 1350 on the upside as expected, but faced sharp rejection from there. 1320 is an interim support just below current levels. If that holds, price may trade within 1350-1320 for sometime; else it could re-test lower levels of 1315-1310 in the medium term. For now our preference is a bounce from levels near 1320.
Copper (3.1840) is testing immediate support near 3.1750. A bounce from here could take it back to 3.25. The 3.25-3.1750 region may continue for a few more sessions followed by a break on either side of the range. For now, the price could remain range-bound.
FOREX
Support on weekly candles near 88.5 has held well for the Dollar Index (89.155) which is now seeing some strengthening. We could see the index ranging between 89 to 90 this week. It would be interesting to see if earlier support near 90 on the 3 day candles provides some resistance to the index in the near term. The Dollar might finally be responding to rising US yields, which are at new record highs (see Interest Rates below).
A near term correction towards 1.235 might be in store for the Euro (1.2461) in this week, post which earlier resistance near 1.23 on the weekly candles might provide some support
Dollar-Yen (109.93) finally seems to be responding to the rising yield spread between US and Japan bonds, as the Bank of Japan’s attempt to not let bond yields rise seems to be coming off. On the daily line chart, Dollar Yen has moved past the 13 days moving average line which was providing some resistance till now. It could now attempt to move towards 111 this week as the Dollar Index moves towards 90.
Euro-Yen (136.97) is testing resistance near 137 on the daily candles. It saw a high of 137.5 on Friday, which makes us believe that it might just attempt to move beyond this resistance to test resistance on the daily line chart and on the weekly candles near 138, post which it should dip.
Pound (1.4121) tested resistance near 1.425-1.43 on the 3 day candles and the daily line chart last week. It is now dipping. The 13 days and 21 days moving average lines on the daily line chart might provide the Pound some support in the next few sessions by keeping it above 1.40.
Dollar-Rupee (64.17) – Today is likely to be quiet, possibly tomorrow also. Look for rise past 64.20 if and while Support at 63.90-80 holds.
INTEREST RATES
US long term yields rose further on Friday as the NFP employment data and wage growth data both reflected higher employment and increasing wages. Record wage growth in 2017 is fuelling inflation expectations and the possibility of 3 (some say even 4) rate hikes by the Fed is extremely high.
US 10 Yr (2.86%), 30 Yr (3.1088%), 5 Yr (2.5934%) & 2 Yr (2.1494%) – As predicted on Friday, the shorter term yields haven’t seen a major rise (5 year has risen around 2 basis points while the 2 year yield has dropped around 2 basis points). Both are very near to respective long term resistances near 2.6% (might just extend upto 2.8%) and 2.2% respectively (these resistances are shown on long term charts in our January Treasury report – available on request). The 10 year and 30 year yields have however risen around 7-8 basis points each. We however expect some consolidation from these elevated levels soon as investors will start buying bonds in the search for yields, thereby increasing bond prices and decreasing yields.
Yield curve steepening is finally underway as the US 10 Yr-5Yr (0.27%) has gone much above 0.2% (seen as support on short term charts) and US 30 Yr – 10 Yr (0.2488%) has risen past 0.24% (seen as support on long term charts).
Japanese 10 Year Yield (0.085%) has successfully been brought down below 0.1% by the Bank of Japan and we can expect it to be kept below 0.09% in the near term.
German 10 Year yield (0.767 %) is testing resistance near 0.77% on the medium term chart and might see some dip as elevated yields attract investors away from falling stock markets.
EURUSD – Vulnerable Below The 1.2537 Zone
EURUSD - The pair closed higher the past week but while trades below its key resistance at 1.2537 there is risk of a correction lower. On the upside, resistance comes in at 1.2500 level with a cut through here opening the door for more upside towards the 1.2550 level. Further up, resistance lies at the 1.2600 level where a break will expose the 1.2650 level. Conversely, support lies at the 1.2400 level where a violation will aim at the 1.2350 level. A break of here will aim at the 1.2300 level. Below here will open the door for more weakness towards the 1.2250. All in all, EURUSD faces further pullback threats.
USDCHF – Halts Weakness, Targets Upside Pressure
USDCHF - With the pair halting its weakness the past week, it faces risk of a move higher in the new week. On the downside, support lies at the 0.9300 level. A turn below here will open the door for more weakness towards the 0.9250 level and then the 0.9200 level. On the upside, resistance resides at the 0.9350 level where a break will clear the way for more strength to occur towards the 0.9400 level. Further out, resistance comes in at the 0.9450 level. Above here if seen will turn attention to 0.9500. All in all, USDCHF faces further weakness medium term but with caution.
EUR/USD Weekly Outlook
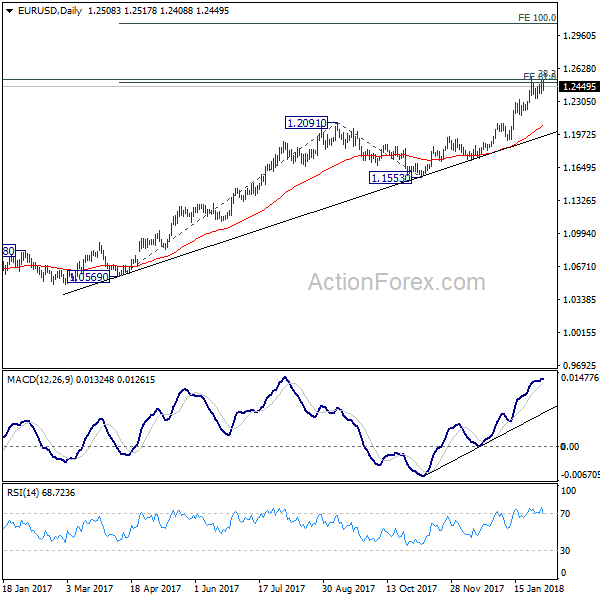
EUR/USD stayed in range below 1.2537 last week and outlook is unchanged. Initial bias remains neutral this week first. As long as 1.2222 support holds, further rise is in favor. Sustained break of 1.2494/2516 will target 100% projection of 1.0569 to 1.2091 from 1.1553 at 1.3075 next. However, break of 1.2222 will indicate rejection from 1.2494/2516, on bearish divergence condition in 4 hour MACD, and turn near term outlook bearish for 1.1915 support first.
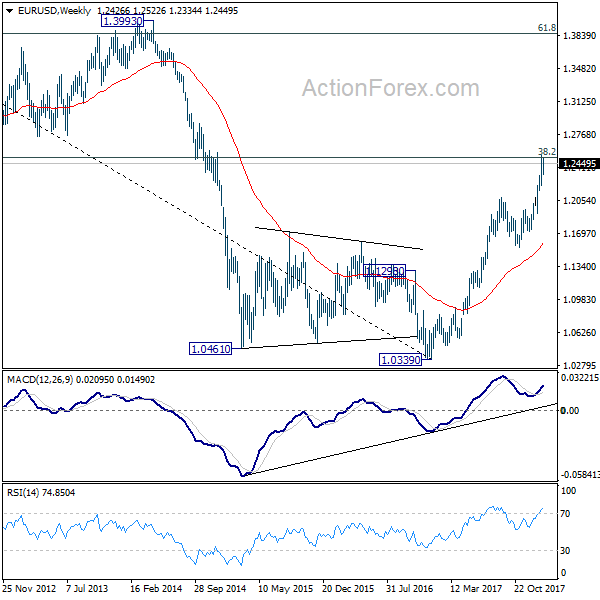
In the bigger picture, rise from 1.0339 medium term bottom is still seen as a corrective move for the moment. But key fibonacci level at 38.2% retracement of 1.6039 (2008 high) to 1.0339 (2017 low) at 1.2516 is looking vulnerable. Sustained break of 1.2516 will carry larger bullish implication and target 61.8% retracement of 1.6039 to 1.0339 at 1.3862. Nonetheless, rejection from 1.2516 will maintain long term bearish outlook and keep the case for retesting 1.0039 alive.
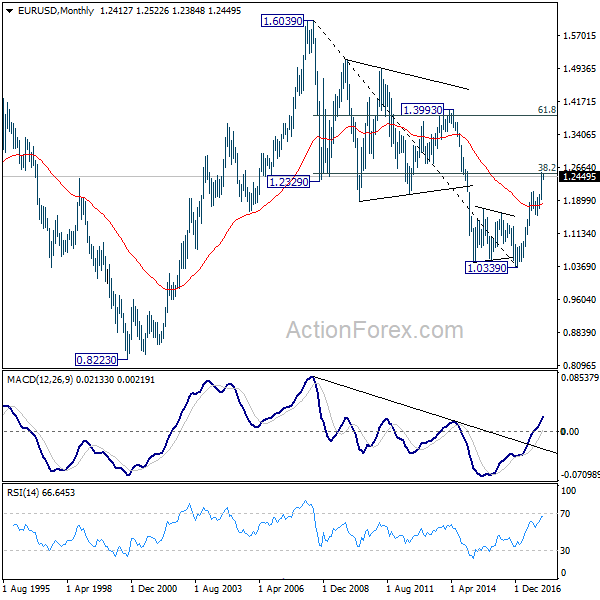
In the long term picture, 1.0339 is seen as an important bottom as the down trend from 1.6039 (2008 high) could have completed. It's still early to decide whether price action from 1.0339 is developing into a corrective or impulsive pattern. Reaction to 38.2% retracement of 1.6039 to 1.0339 at 1.2516 will give important clue to the underlying momentum.
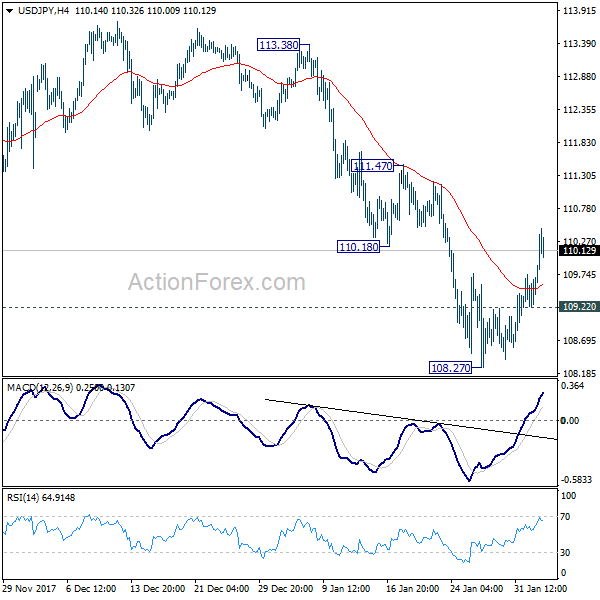
USD/JPY Weekly Outlook
USD/JPY's strong rebound to 110.47 last week indicates short term bottoming at 108.27. Initial bias remains on the upside this week for 111.47 resistance first. Sustained break there will also have 55 day EMA (now at 111.39) firmly taken out. In such case, further rise would be seen back to 113.38/114.73 resistance zone. On the downside, however, below 109.22 minor support will turn focus back to 108.27 instead.
In the bigger picture, current development argues that the corrective pattern from 118.65 is extending. There is risk of dropping further to 61.8% retracement of 98.97 to 118.65 at 106.48. But this level should provide strong support to contain downside and bring resumption of rise from 98.97. However, sustained break of 106.48 will now likely send USD/JPY through 98.97 to resume the corrective fall from 125.85 (2015 high).
In the long term picture, the rise from 75.56 (2011 low) long term bottom to 125.85 top is viewed as an impulsive move, no change in this view. Price actions from 125.85 are seen as a corrective move which could still extend. In case of deeper fall, downside should be contained by 61.8% retracement of 75.56 to 125.85 at 94.77. Up trend from 75.56 is expected to resume at a later stage for above 135.20/147.68 resistance zone.


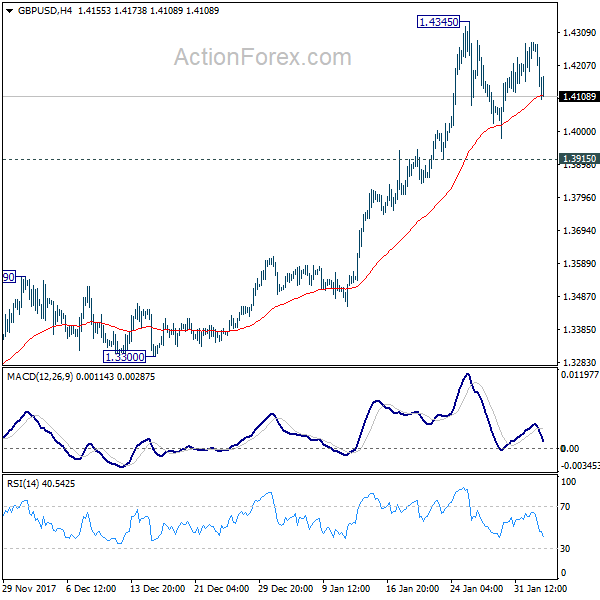
GBP/USD Weekly Outlook
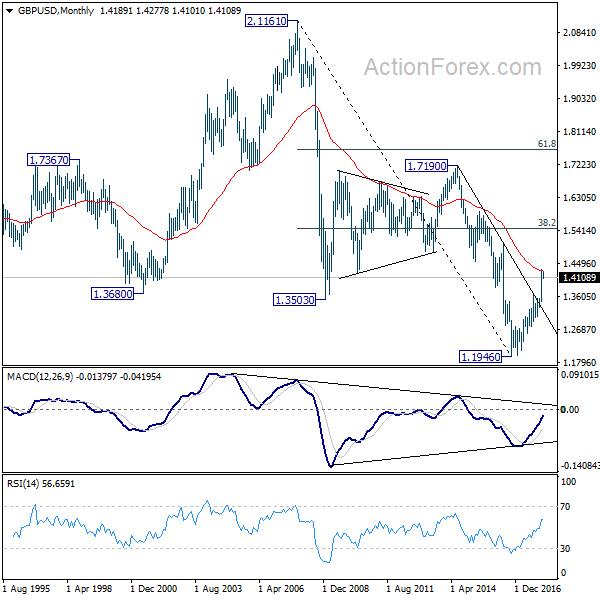
GBP/USD stayed in consolidation below 1.4345 last week and outlook is unchanged. Initial bias remains neutral this week first. In case of another fall, downside should be contained by 1.3915 support to bring rally resumption. On the upside, break of 1.4345 will resume medium term up trend to 100% projection of 1.2108 to 1.3651 from 1.3038 at 1.4581 next. However, break of 1.3915 will argue that, at least, deeper pull back in underway to 1.3651 resistance turned support.
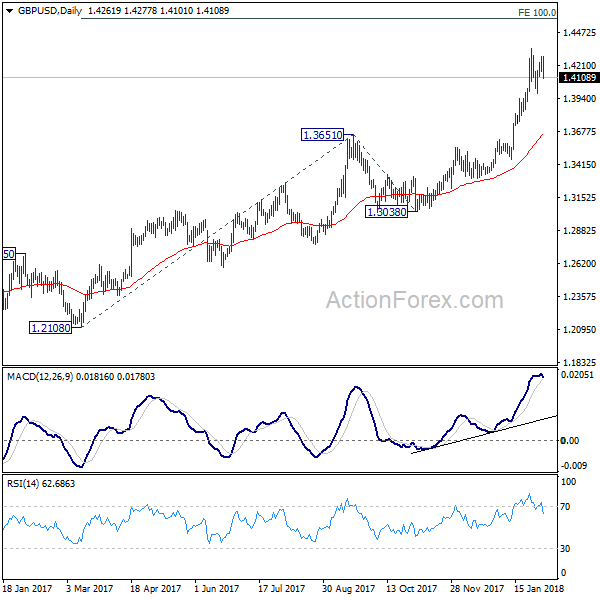
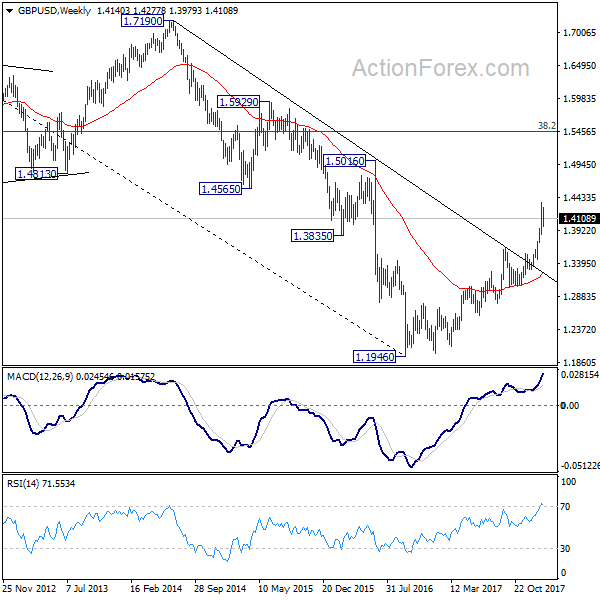
In the bigger picture, sustained break of 1.3835 key resistance level indicates that rebound from 1.1946 is at least correcting the long term down from from 2007 high at 2.1161. Further rise should now be seen back to 38.2% retracement of 2.1161 (2007 high) to 1.1946 (2016 low) at 1.5466. Medium term outlook will stay bullish as long as 1.3038 support holds, in case of pull back.
In the longer term picture, rise from 1.1946 should at least be correcting the whole long term down trend form 2.1161 and should target 38.2% retracement of 2.1161 (2007 high) to 1.1946 (2016 low) at 1.5466. It too early to tell if it's developing into a long term up trend. We'll monitor the upside momentum and reaction to 1.5466 to decide later.
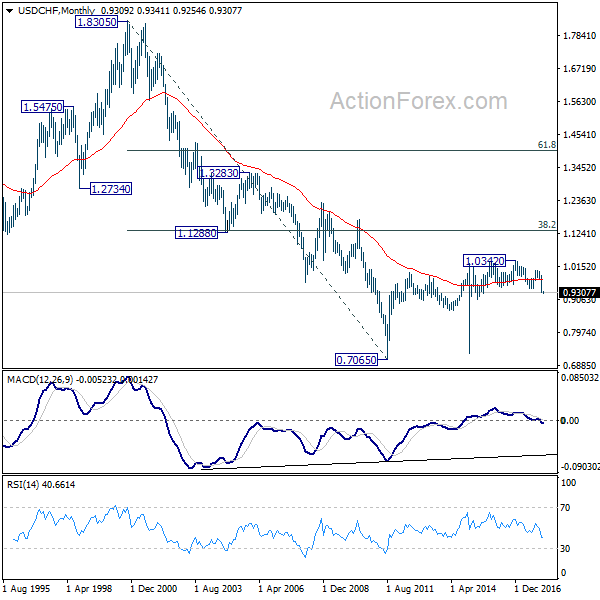
USD/CHF Weekly Outlook
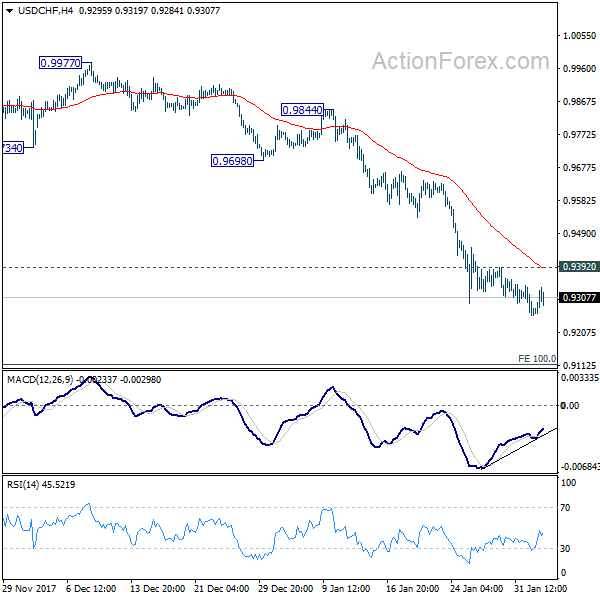
USD/CHF's decline extended to 0.9254 last week. Downside momentum is diminishing as seen in 4 hour MACD. But as long as 0.9392 resistance holds, deeper fall is expected. Current fall from 1.0037 would target next fibonacci projection level at 0.9115. On the upside, break of 0.9392 minor resistance, however, will indicate short term bottoming and bring stronger rebound.
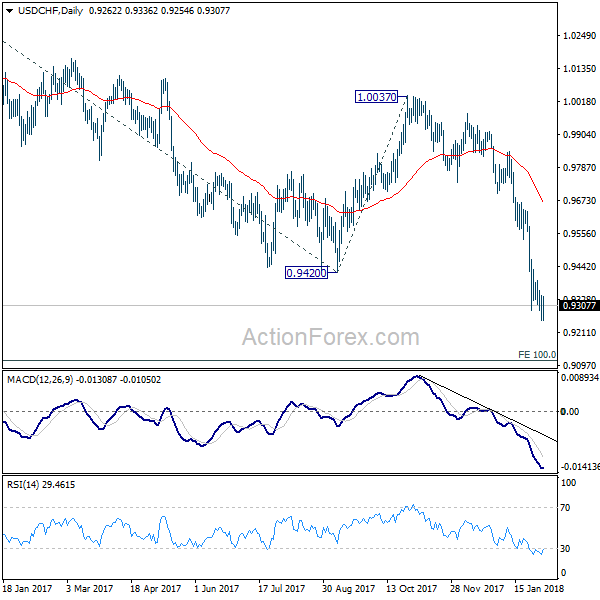
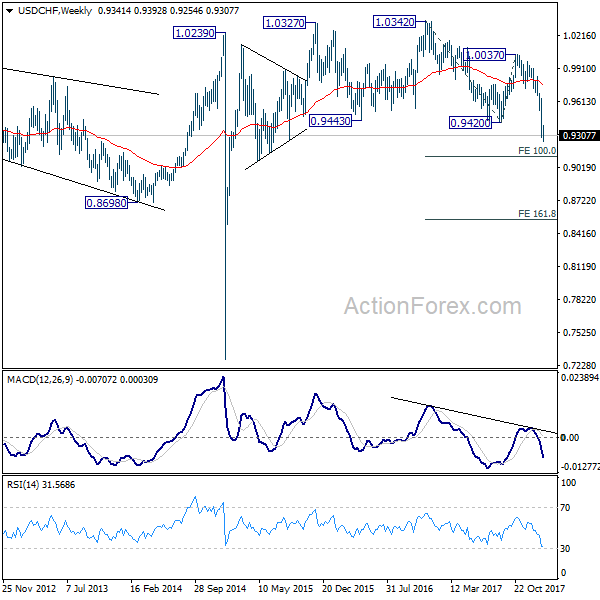
In the bigger picture, the strong break of 0.9420 support suggests that fall from 1.0342 is developing into a medium term down trend. Deeper fall should be seen to 100% projection of 1.0342 to 0.9420 from 1.0037 at 0.9115. Break will target 161.8% projection at 0.8545. In any case, break of 0.9640 resistance is needed to be the first sign of medium term bottoming. Otherwise, outlook will stay bearish even in case of strong rebound.
In the long term picture, the strong break of 0.9420 support and downside acceleration turns the long term outlook rather bearish. Corrective rebound from 0.7065 (2011 low) could have already completed at 1.0342. 0.8698 support will be a key level to watch. Sustained break there could bring retest of 0.7065.
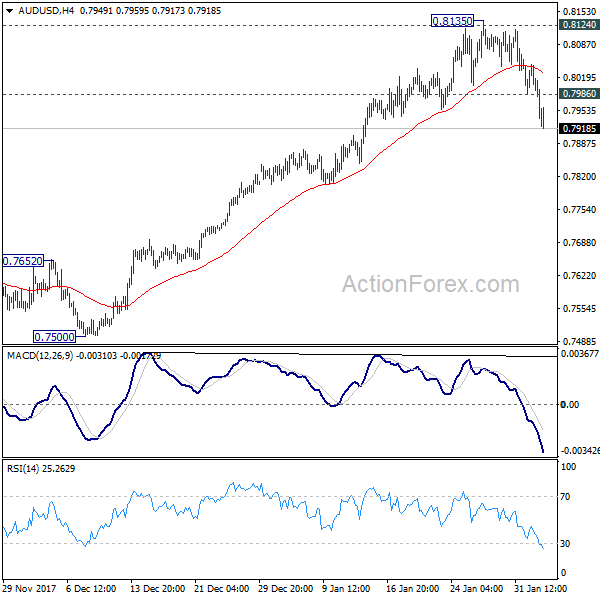
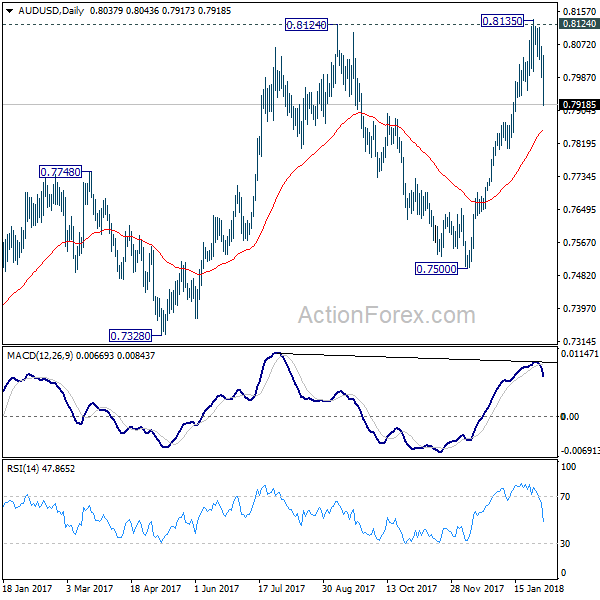
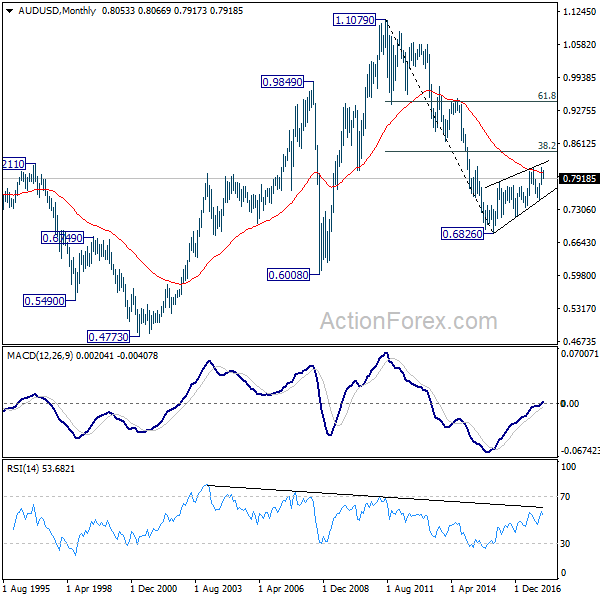
AUD/USD Weekly Outlook
AUD/USD's sharp decline last week confirmed short term topping at 0.8135, after being rejected by 0.8124 resistance. Initial bias remains on the downside this week for 55 day EMA (now at 0.7851). Sustained break there will argue that rise from 0.7500 has already finished and will bring deeper fall to retest this support level. On the upside, above 0.7986 minor resistance will turn intraday bias neutral first. But recovery will likely be limited below 0.8135 resistance at first attempt.
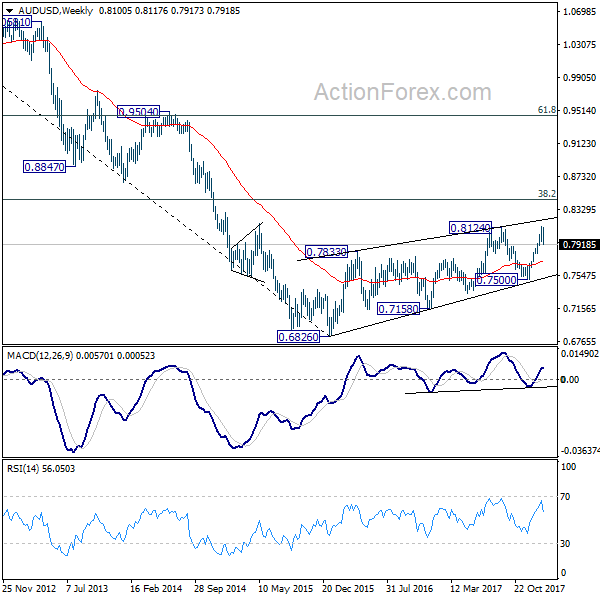
In the bigger picture, medium term rebound from 0.6826 is seen as a corrective move. It might still extend higher but we'd expect strong resistance from 38.2% retracement of 1.1079 to 0.6826 at 0.8451 to limit upside to bring long term down trend resumption. On the downside, break of 0.7500 support will now be an important signal that such corrective rebound is completed.
In the longer term picture, 0.6826 is seen as a long term bottom. Rise from there could either reverse the down trend from 1.1079, or just develop into a corrective pattern. At this point, we're favoring the latter. And, as long as 38.2% retracement of 1.1079 to 0.6826 at 0.8451 holds, we'd anticipate another decline through 0.6826 at a later stage. But strong support should be seen between 0.4773 (2001 low) and 0.6008 (2008 low).
USD/CAD Weekly Outlook
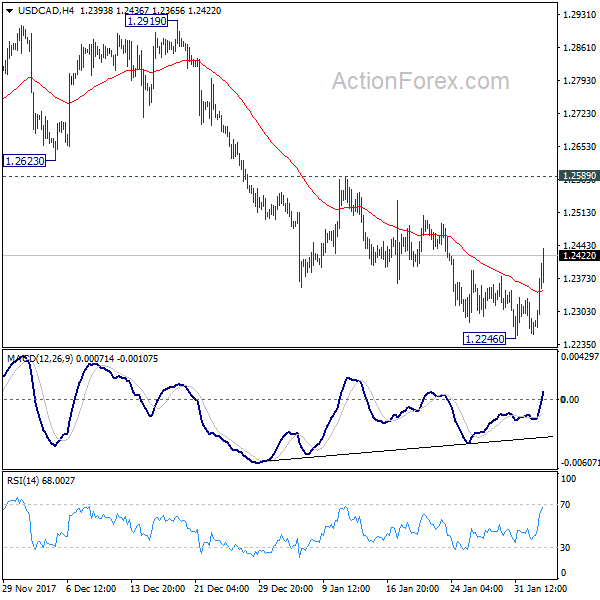
Despite dipping to 1.2246 last week, subsequent rebound suggests that a short term bottom is formed, on bullish convergence condition in 4 hour MACD. Initial bias is back on the upside this week for 1.2589 resistance first. Break there will indicate that pull back from 1.2919 has completed and and would bring retest of this resistance. On the downside, below 1.2246 will resume the fall from 1.2919 to retest 1.2061 key support.
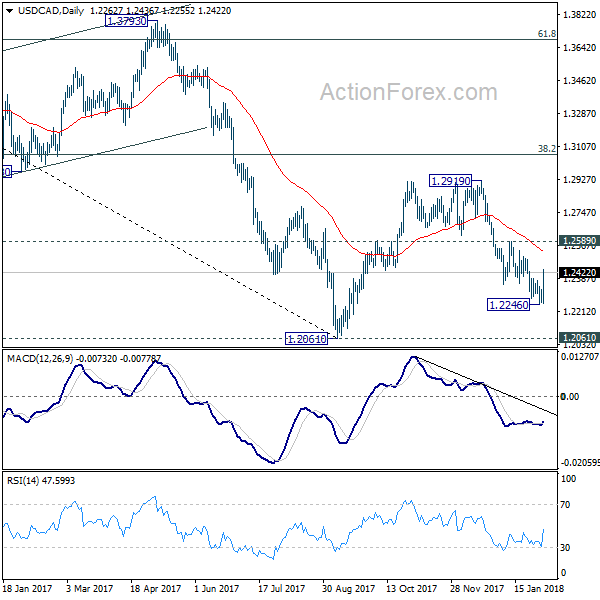
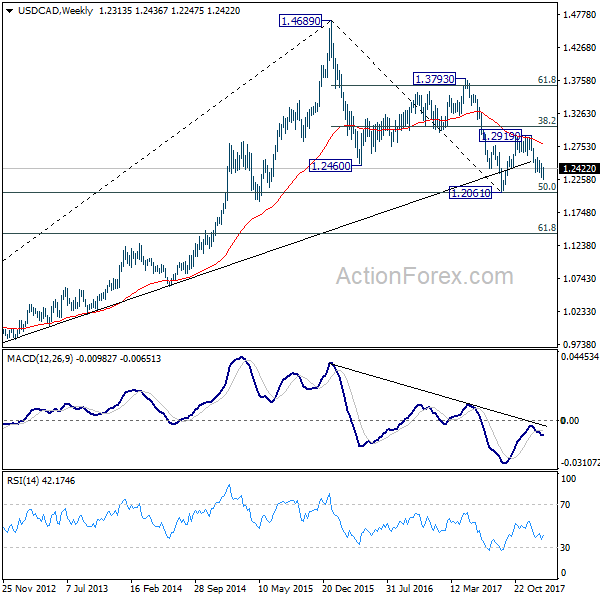
In the bigger picture, rebound from 1.2061 is likely completed completed at 1.2919, rejected by 55 week EMA and kept below 38.2% retracement of 1.4689 to 1.2061 at 1.3065. The development also suggests that long term fall from 1.4689 is not completed yet. Decisive break of 1.2061 low will target 61.8% retracement of 0.9406 to 1.4689 at 1.1424. This will now be the favored case as long as 1.2919 resistance holds.
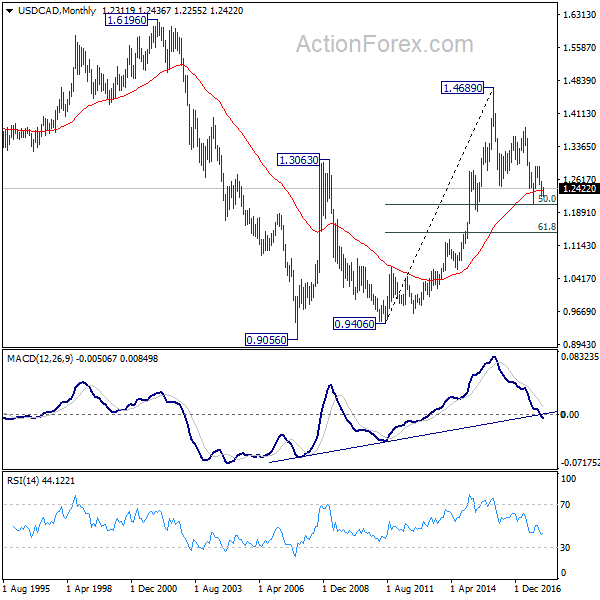
In the longer term picture, 50% retracement of 0.9406 (2011 low) to 1.4689 (2015 high) at 1.2048 remains a key support level to watch. As long as this level holds, we'll treat fall from 1.4689 as a correction and expect another rally through this level. However, sustained break of 1.2048 will turn favors to the case that rise from 0.9056 (2007 low) is a three wave corrective move that's completed at 1.4689. And retest of 0.9056/9406 support zone could be seen in medium to long term.