Sample Category Title
GBPUSD Dips on Strong US Jobs Report; Break Below 10SMA Needed for Fresh Bearish Signal
Cable fell around 100 pips in immediate reaction on strong US jobs report which sent the greenback higher across the board.
US Non-Farm Payrolls report showed that the US economy added 200K jobs in January, beating forecast for 184K increase, with previous month's figure being revised higher to 166K from initial 148K release.
Average hourly earnings came in line with expectations at 0.3% m/m, but annualized figure showed an increase to 2.9% vs forecasted 2.6%, hitting the highest level since June 2009. US unemployment was unchanged in January at 4.1%.
Strong numbers from labor sector came as additional support to US dollar which was inflated by hawkish tone from the Fed, following its policy meeting earlier this week. Rising hopes for Fed rate hike in March were further boosted by today's jobs report and this could accelerate recovery of greenback.
Today's post-data dip tested solid support at 1.4133 provided by rising 10SMA, where fresh bears found temporary footstep.
Firm break below 10SMA is needed for fresh bearish signal to extend weakness from double rejection at 1.4177 and turn near-term focus lower.
However, bears face long way towards key 1.40 support zone, break of which would confirm reversal.
Today's close in red is needed to confirm negative outlook which is forming in near-term action.
Res: 1.4207; 1.4232; 1.4277; 1.4300
Sup: 1.4133; 1.4093; 1.4050; 1.4000

U.S. January Payroll Employment Jumps 200k
Highlights:
- Payroll employment rose 200k in January up from an upwardly revised 160k gain in December.
- The January unemployment rate held steady at December's rate of 4.1%.
- The annual increase in wages rose to 2.9% in January from an upwardly revised 2.7% in December.
Our Take:
Indications of solid hiring by businesses provide reason to expect that overall GDP growth will likely remain above-potential near term which could push the economy even further beyond capacity. Core consumer price inflation has generally persisted below the Fed's 2% objective for most of 2017. However, with indications that wage inflation is increasing in January at the fastest rate since June 2009, core consumer price inflation is expected to rise closer to this objective rate through 2018. The Fed opted to leave the fed funds unchanged at the current range of 1.25% to 1.50% at last month's FOMC meeting though this followed a hike in December. The lack of a hike last month was more indicative of the Fed keeping the pace of tightening gradual in the face of below-target inflation rather than that of policy going on hold. With wage inflation starting to move up, we expect that the central bank will resume tightening at the next FOMC meeting in March. We expect the Fed to continue to tighten policy gradually going forward with 25 basis point hikes expected every quarter through the end of 2019. Such is premised on core consumer price inflation continuing to converge on the Fed's 2% objective. Inflation rising beyond target will result in even greater tightening while inflation remaining under-target could see a slowing, and potential suspension, of Fed tightening.
GBPJPY Hits New 19-Month High; Bearish Correction is Possible
GBPJPY surged sharply higher this week and during today's trading session it reached a fresh 19-month high of 156.60. Prices have broken above the 156.00 handle for the first time since June 2016. The bullish picture in the short-term chart is further supported by the technical indicators.
From the technical point of view, the Relative Strength Index (RSI) is flattening in the positive territory and is approaching the overbought area. Also, the MACD oscillator is holding in the bullish area with weaker momentum than before. However, in the 4-hour chart, the 20-simple moving average posted a bullish crossover with the 40-SMA, indicating further gains.
If price action remains positive, there is scope to test the 160.00 strong psychological level taken from the peak in June 2016, while the price is currently trading slightly lower.
If the price creates a bearish correction, then the focus could shift to the downside towards the 23.6% Fibonacci retracement level around 154.30 of the up-leg from 147.00 to 156.60. If this level is breached, it could increase downside pressure until the 38.2% Fibonacci mark at 152.90.
The U.S. Economy Kicks off 2018 with Another Healthy Job Gain
U.S. payrolls rose by 200k in January, meeting survey expectations for 190k. Gains were largely in the private-sector hiring (+196k). The unemployment rate remained unchanged at 4.1%.
All eyes were on wage growth in this report, and it didn't disappoint. Average hourly earnings rose a relatively strong 0.3% in January and accelerated to 2.9% year-over-year. That marks the fastest pace of wage gains since 2009.
Payrolls gains were broad based. In the lead were construction (+36k), food services (+31k), health care (+21k) and manufacturing (+15k). Both goods-producing employment (+57k) and services employment (+139k) saw healthy growth.
The combined revisions to November and December, saw payrolls growth 24k lower than previous estimates. But job growth has still averaged 192k over the past three months, a very healthy pace.
January's household survey incorporated updated population estimates. While the population, labor force, employment and unemployment were all revised up, the unemployment rate, and participation rate were unaffected.
The one negative in the report was a decline (-0.6%) in hours worked in January. This is not positive for economic growth, but we suspect it may have been affected by the brief government shutdown and/or the heavy winter storms that hit the Northeast early in the month.
Key Implications
There appears to be no stopping the U.S. labor market. With both jobs and wages beating expectations, there is little to criticize in this report. A better-than-expected print this morning has added to the pressure on the bond market, pushing the U.S. 10-year yield above the 2.8% mark.
As the labor market tightens, new jobs will increasingly be filled by workers (re-)entering the labor force. The labor force participation rate for core age workers (25-54 yrs) has made notable gains since 2015, but there is room for further improvement. Indeed, our economic forecast relies on further improvements in labor force participation in order to sustain job growth. Still, as this slack is absorbed, we expect monthly payrolls gains will slow over the course of 2018.
Stronger wage growth will help to draw workers back to the workforce. Indeed, January's wage gain is just what the Fed is looking for, and helps to cement the case for a rate hike in March. That also puts the balance of risks toward more rate hikes over the course of the year.
Dollar Uplifted by Solid US Jobs Report
The Dollar flickered back to life on Friday afternoon, with prices sprinting towards 89.20 as investors cheered January's solid US jobs data.
The US economy created 200,000 new jobs in January, while the unemployment rate remained steady at 4.1%. Yearly wage growth dished out an upside surprise by rising 2.9% (an eight-and-a-half-year high), throwing the Dollar a much-needed lifeline. Repeated signs that wage growth is building momentum are likely to support rising inflation expectations, which could boost speculation of higher US interest rates this year. The Dollar clearly needed support this week, and January's impressive US jobs data has come to the rescue.
From a technical standpoint, the Dollar Index is still pressured on the daily charts. Prices remain at risk of depreciating back below 89.00, if bulls are unable to break above the 89.60 level. Sustained weakness below 89.00 may invite decline back towards 88.50. Alternatively, breakout above 89.60 could pave the way towards 90.00.
By the Numbers: U.S January NFP Fallout
- Non-farm payrolls: +200k vs. +148k prev.
- Private payrolls: +196k vs. prev. +146k)
- Manufacturing payrolls: +15k vs. prev. +25k
- Unemployment rate: +4.1% vs. prev. +4.1%
- Average hourly earnings: +0.34% m/m, +2.9% y/y vs. prev. +0.4% m/m, +2.7% y/y
- Workweek hours: 34.3 vs. prev. 34.5 – -0.2
- U.S 10-year yield: +2.83%
U.S employers added +200,000 jobs in January (employers added an average of +181k a month in 2017).
Construction, manufacturing and restaurants had strong job growth, while Government payrolls grew by +4k last month.
Strong back-month revisions for average hourly earning and headline job prints – Dec payrolls revised to +160k and Nov revised to +216k
Average hourly earnings rose +0.34% from Dec following an upwardly revised +0.4% gain. Year-over-year, it was +2.9% compared with projections for a +2.6% increase. December's gain was revised upward to +2.7%.
USD (€1.2455, £1.4165, ¥110.33, C$1.2361) is better bid across the board, while the 10-year yield has backed up to +2.834% as wage growth is starting to accelerate.
EUR/USD Mid-Day Outlook
Daily Pivots: (S1) 1.2418; (P) 1.2470 (R1) 1.2556; More....
EUR/USD failed to take out 1.2537 resistance and drops notably in early US session. But for the moment, intraday bias remains neutral. As long as 1.2222 support holds, near term outlook remains bullish. On the upside, sustained break of 1.2494/2516 resistance zone will extend recent rally to 100% projection of 1.0569 to 1.2091 from 1.1553 at 1.3075 next. However, break of 1.2222 will indicate rejection from 1.2494/2516, on bearish divergence condition in 4 hour MACD, and turn near term outlook bearish for 1.1915 support first.
In the bigger picture, rise from 1.0339 medium term bottom is still seen as a corrective move for the moment. But key fibonacci level at 38.2% retracement of 1.6039 (2008 high) to 1.0339 (2017 low) at 1.2516 is looking vulnerable. Sustained break of 1.2516 will carry larger bullish implication and target 61.8% retracement of 1.6039 to 1.0339 at 1.3862. Nonetheless, rejection from 1.2516 will maintain long term bearish outlook and keep the case for retesting 1.0039 alive.


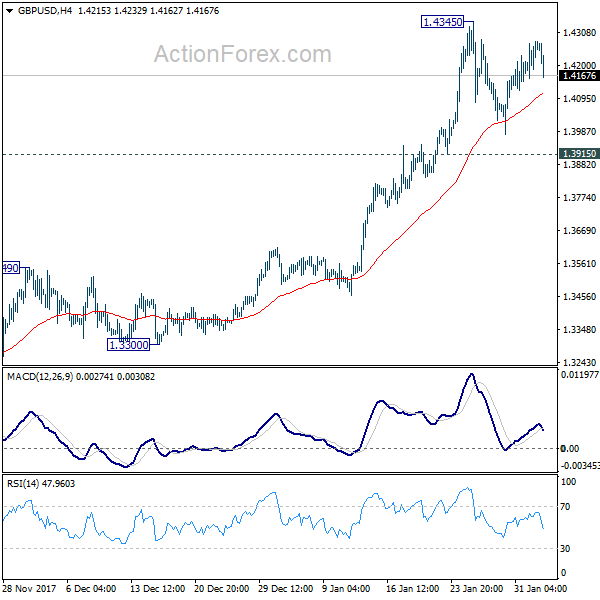
GBP/USD Mid-Day Outlook
Daily Pivots: (S1) 1.4188; (P) 1.4233; (R1) 1.4307; More.....
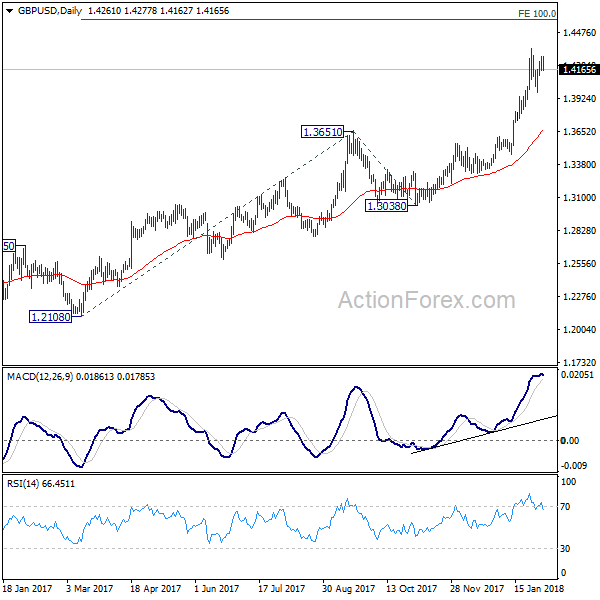
GBP/USD weakens in early US session but stays in range below 1.4345. Intraday bias remains neutral as consolidations from 1.4345 might extend. Still, in case of another fall, downside should be contained by 1.3915 support to bring rally resumption. On the upside, break of 1.4345 will resume medium term up trend to 100% projection of 1.2108 to 1.3651 from 1.3038 at 1.4581 next. However, break of 1.3915 will argue that, at least, deeper pull back in underway to 1.3651 resistance turned support.
In the bigger picture, sustained break of 1.3835 key resistance level indicates that rebound from 1.1946 is at least correcting the long term down from from 2007 high at 2.1161. Further rise should now be seen back to 38.2% retracement of 2.1161 (2007 high) to 1.1946 (2016 low) at 1.5466. Medium term outlook will stay bullish as long as 1.3038 support holds, in case of pull back.
USD/CHF Mid-Day Outlook
Daily Pivots: (S1) 0.9232; (P) 0.9287; (R1) 0.9317; More...
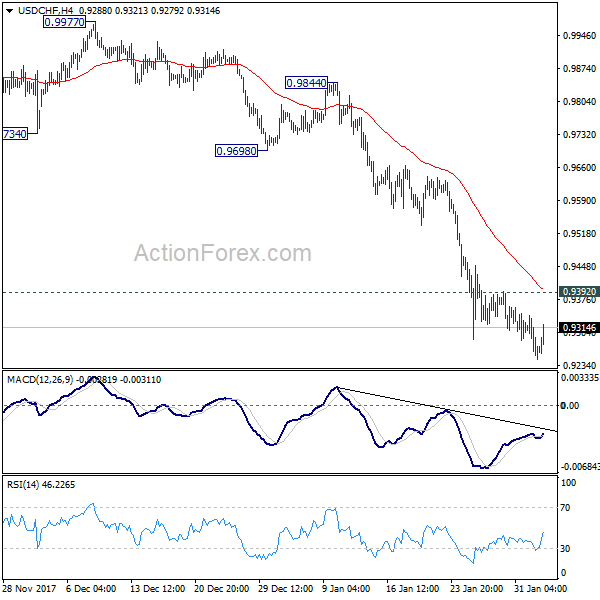
USD/CHF recovers in early US session but stays below 0.9392 minor resistance. Intraday bias remains on the downside and deeper fall is still mildly favored. Current decline from 1.0037 should extend to next key fibonacci level at 0.9115. On the upside, break of 0.9392 minor resistance, however, will indicate short term bottoming and bring stronger rebound.
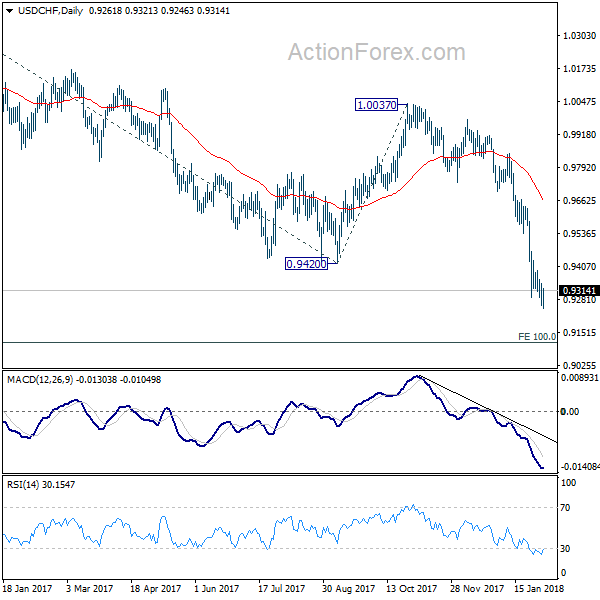
In the bigger picture, the strong break of 0.9420 support suggests that fall from 1.0342 is developing into a medium term down trend. Deeper fall should be seen to 100% projection of 1.0342 to 0.9420 from 1.0037 at 0.9115. Break will target 161.8% projection at 08545. In any case, break of 0.9640 resistance is needed to be the first sign of medium term bottoming. Otherwise, outlook will stay bearish even in case of strong rebound.
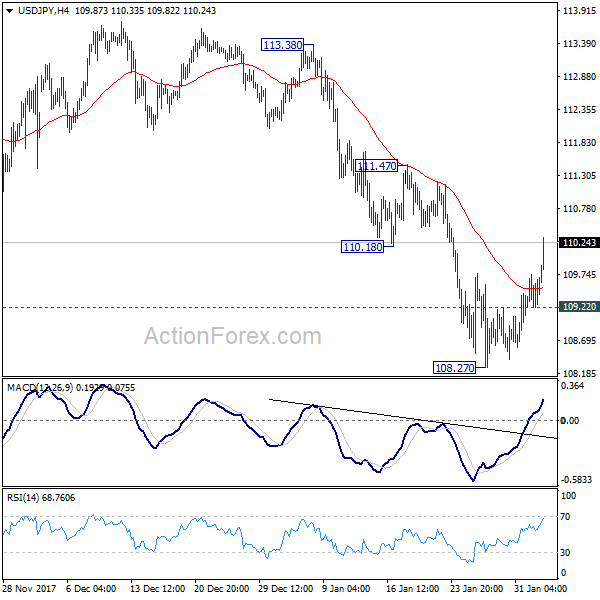
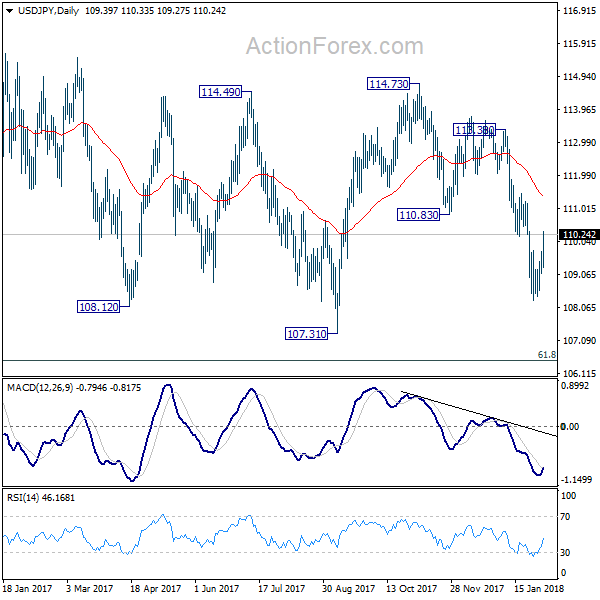
USD/JPY Mid-Day Outlook
Daily Pivots: (S1) 109.07; (P) 109.41; (R1) 109.73; More...
USD/JPY's rebound from 108.27 extends higher today. Break of 110.18 support turned resistance is taken as the first sign of near term reversal. Intraday bias is turned back to the upside for 111.47 resistance first. Sustained break there will also have 55 day EMA (now at 11.39) firmly taken out. In such case, further rise would be seen back to 113.38/114.73 resistance zone. On the downside, however, below 109.22 minor support will turn focus back to 108.27 instead.
In the bigger picture, current development argues that the corrective pattern from 118.65 is extending. There is risk of dropping further to 61.8% retracement of 98.97 to 118.65 at 106.48. But this level should provide strong support to contain downside and bring resumption of rise from 98.97. However, sustained break of 106.48 will now likely send USD/JPY through 98.97 to resume the corrective fall from 125.85 (2015 high).