Sample Category Title
GBP/JPY Weekly Outlook
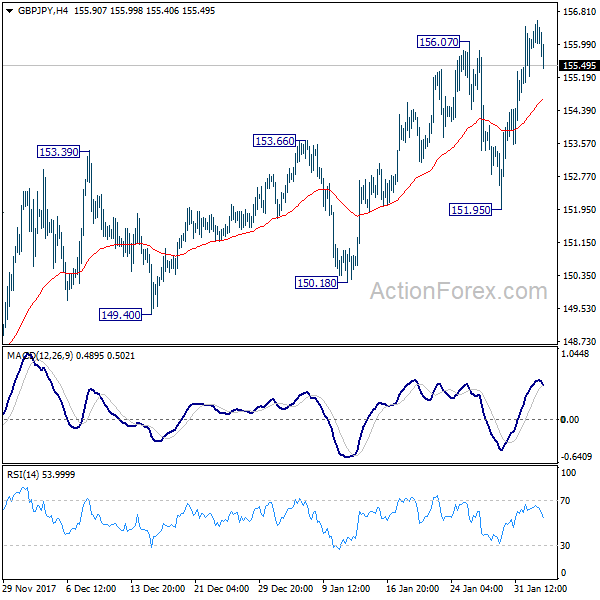
GBP/JPY was well supported by rising 55 day EMA. And recent rise resumed last week by hitting as high as 156.59. Near term outlook will remain bullish as long as 151.95 support holds. Next target will be 100% projection of 139.29 to 152.82 from 146.96 at 160.49.
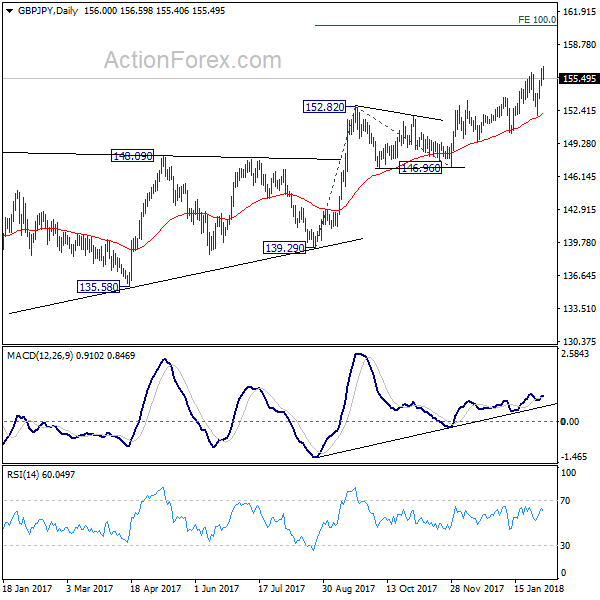
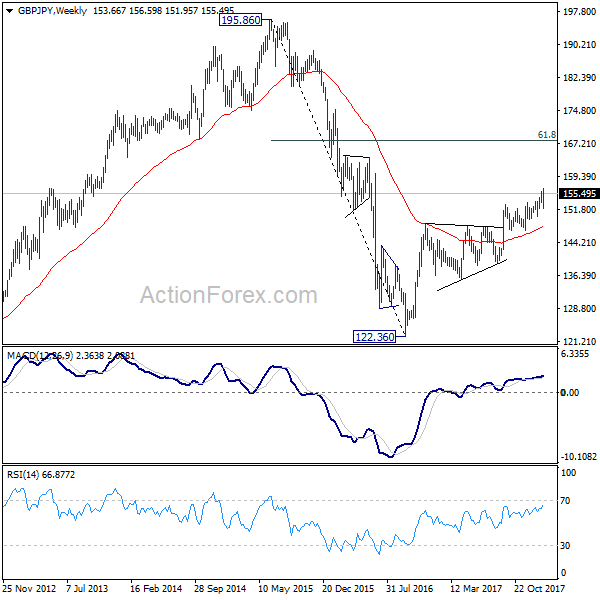
In the bigger picture, as long as 146.96 key support holds, medium term outlook remains bullish. Rise from 122.36 is in favor to extend to 61.8% retracement of 195.86 to 122.36 at 167.78. However, break of 146.96 support will indicate trend reversal. And there would be prospect of retesting 122.36 in that case.
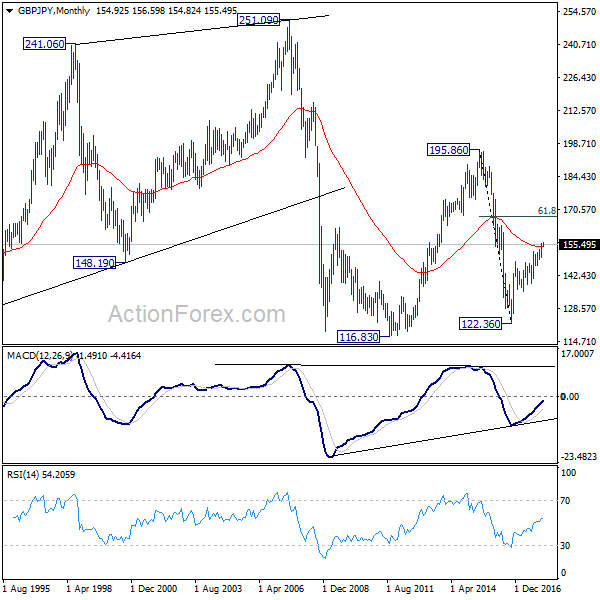
In the longer term picture, down trend from 195.86 (2015 high) has already completed at 122.36. Focus is now on 55 month EMA (now at 154.75). Firm break there will suggest that rise from 122.36 is developing into a long term move that target 195.86 again. And, price actions from 116.83 (2011 low) is indeed a sideway pattern that could last more than a decade.
EUR/JPY Weekly Outlook
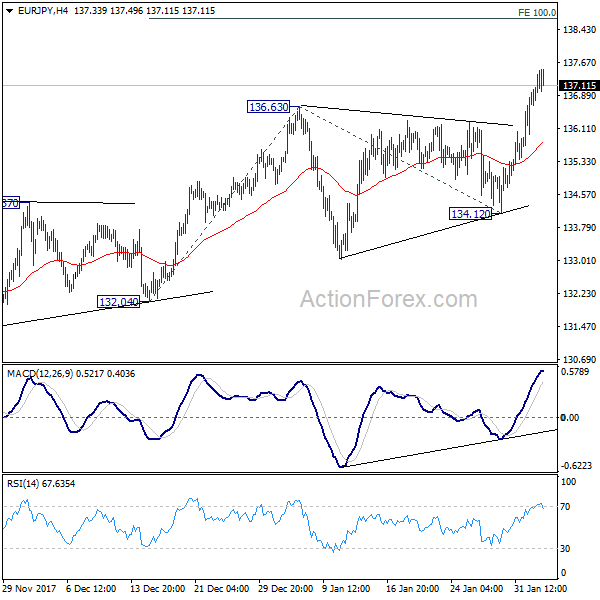
EUR/JPY surged to as high as 137.49 last week. Break of 136.63 indicates up trend resumption. Initial bias stays on the upside this week for 100% projection of 132.04 to 136.63 from 134.12 at 138.71 first. On the downside, break of 134.12 support is needed to indicate near term reversal. Otherwise, outlook will remain bullish in case of retreat.
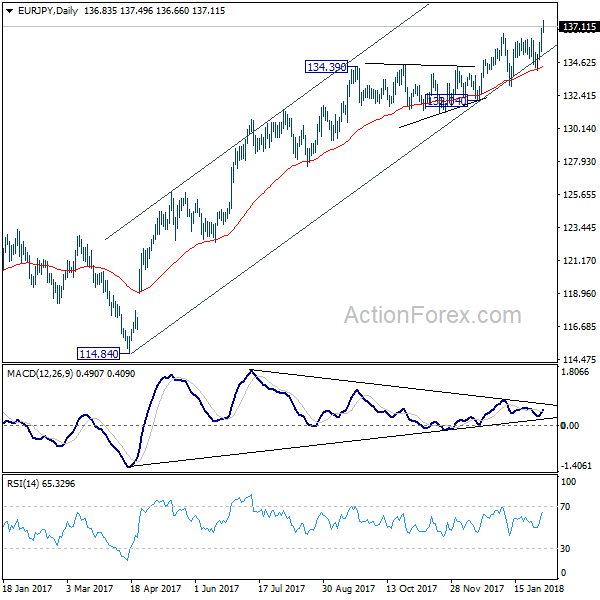
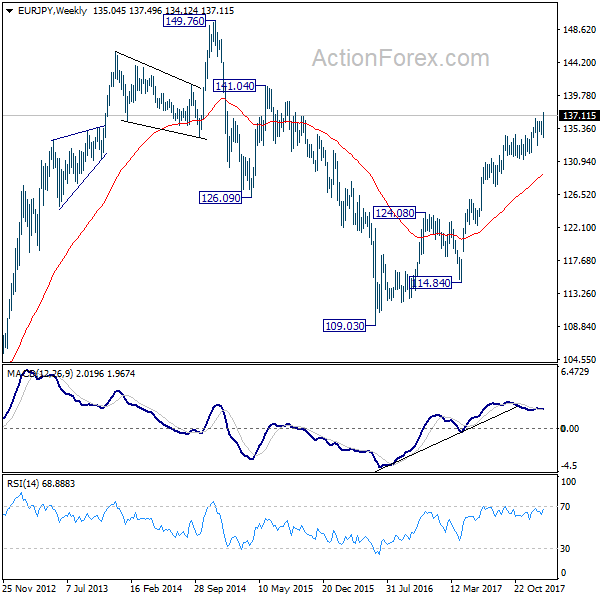
In the bigger picture, medium term rise from 109.03 (2016 low) is seen as at the same degree as the down trend from 149.76 (2014 high) to 109.03 (2016 low). It should be targeting 141.04/149.76 resistance zone. On the downside, break of 132.04 support is needed to indicate medium term reversal. Otherwise, outlook will stay bullish in case of deep pull back.
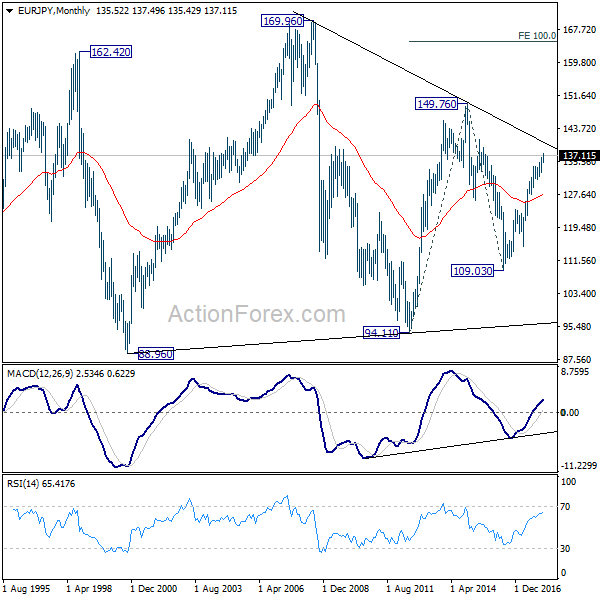
In the long term picture, at this point, there is no clear indication that rise from 109.03 is resuming that from 94.11 (2012 low). Hence, we'd be cautious on topping below 149.76 to extend range trading. Nonetheless, firm break of 149.76 will indicates strong underlying buying. In such case, EUR/JPY will target 100% projection of 94.11 to 149.76 from 109.03 at 164.68.
EUR/GBP Weekly Outlook
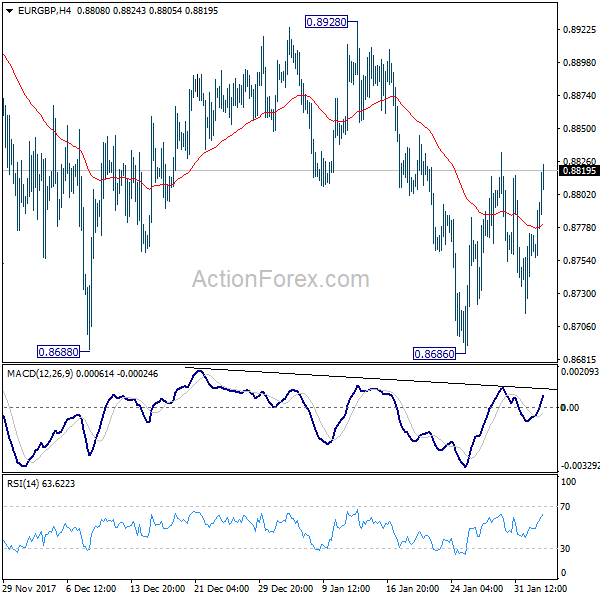
EUR/GBP stayed in range of 0.8686/8928 last week and outlook is unchanged. Initial bias stays neutral this week first. And, near term outlook will remain mildly bearish as long as 0.8928 resistance holds. On the downside, firm break of 0.8686 will resume whole decline from 0.9305. As 61.8% retracement of 0.8312 to 0.9305 should then be taken out too. Deeper decline would be seen to retest 0.8303/8312 support zone. Nonetheless, on the upside, break of 0.8928 will indicate near term reversal and turn outlook bullish for 0.9304 resistance.
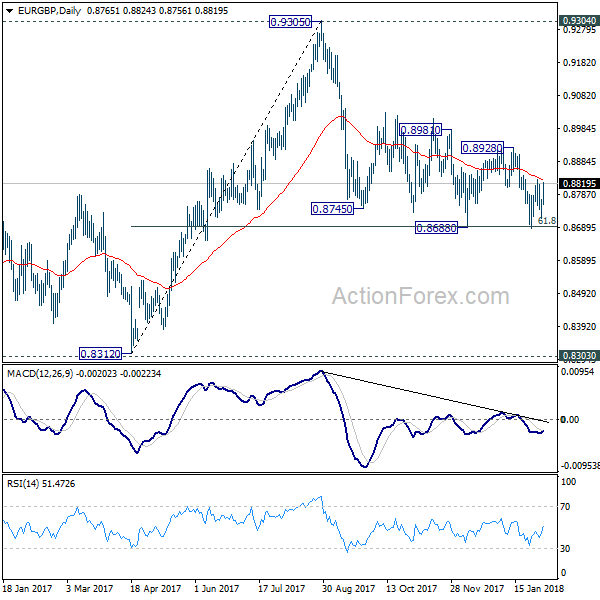
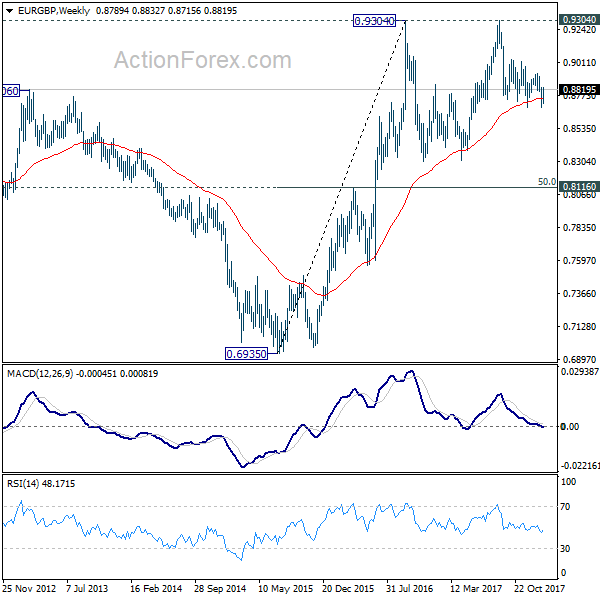
In the bigger picture, there are various ways to interpret price actions from 0.9304 high. But after all, firm break of 0.9304/5 is needed to confirm up trend resumption. Otherwise, range trading will continue with risk of deeper fall. And in that case, EUR/GBP could have a retest on 0.8303. But we'd expect strong support from 0.8116 cluster support (50% retracement of 0.6935 to 0.9304 at 0.8120) to contain downside.
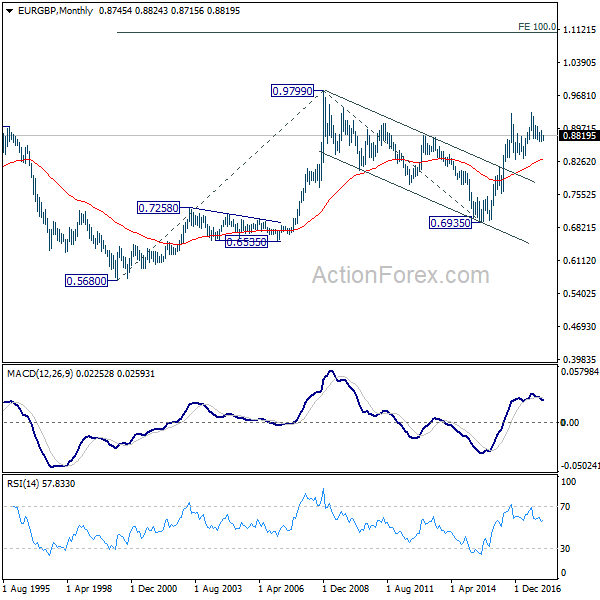
In the long term picture, we're holding on to the view that rise from 0.6935 (2015 low) is resuming the up trend from 0.5680 (2000 low). Hence, after the consolidation from 0.9304 completes, we'd expect another medium term up trend through 0.9799 to 100% projection of 0.5680 to 0.9799 from 0.6935 at 1.1054.
EUR/AUD Weekly Outlook
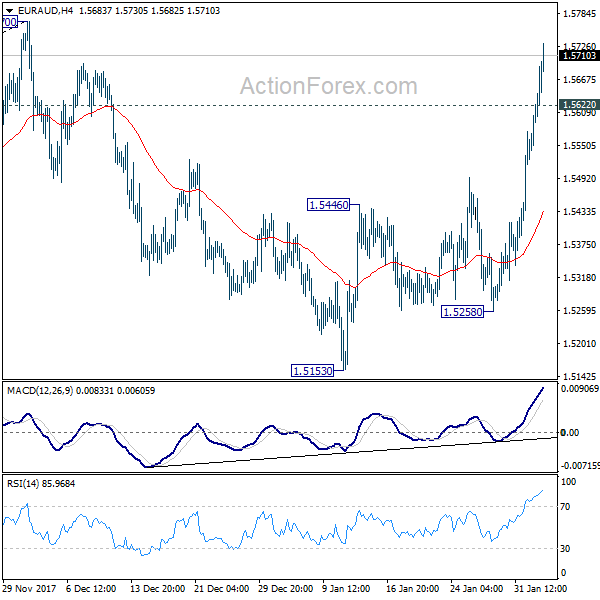
EUR/AUD surged to as high as 1.5703 last week as rebound from 1.5153 extended. Based on strong upside momentum, the cross might be resuming medium term rise from 1.3264. Initial bias stays on the upside this week for 1.5770 resistance first. Decisive break there will confirm this bullish case and target 1.6587 key long term resistance. On the downside, below 1.5622 minor support will dampen this bullish case and turn intraday bias neutral first.
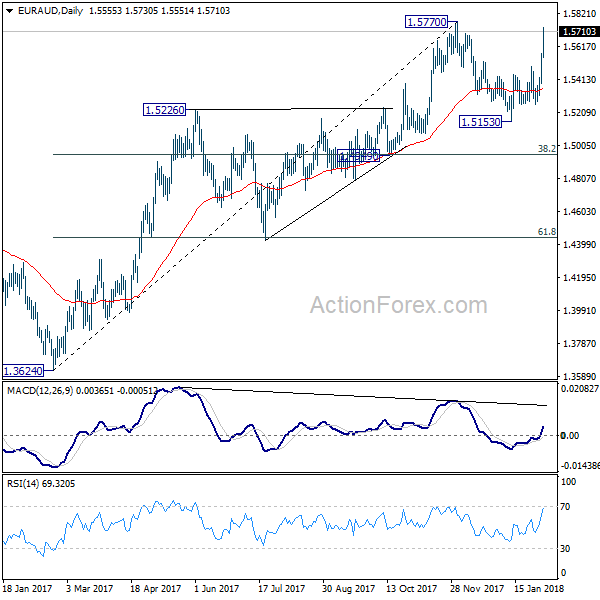
In the bigger picture, medium term rise from 1.3624 is not completed yet. Break of 1.5770 will extend the rise to retest 1.6587 (2015 high). However, considering bearish divergence condition in daily MACD, sustained break of 1.4949 cluster support (38.2% retracement of 1.3624 to 1.5770 at 1.4950) will indicate medium term reversal. And there is prospect of retesting 1.3624 low in that bearish case.
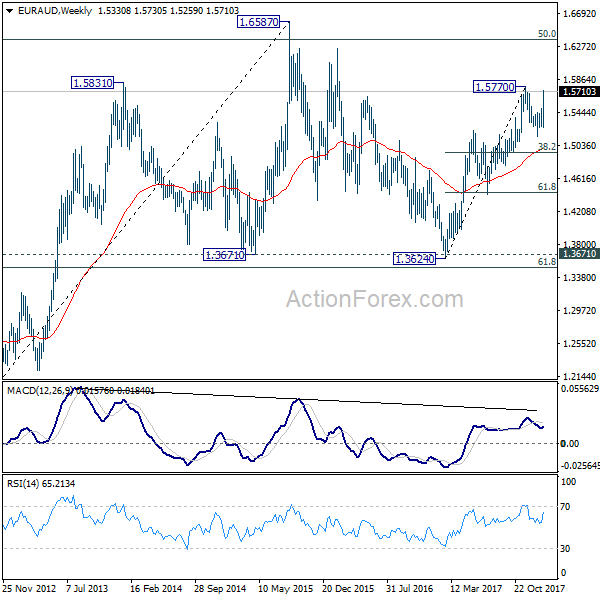
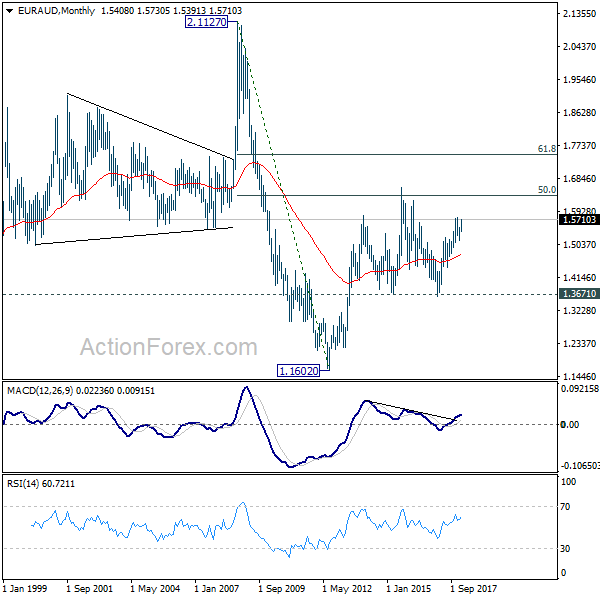
In the longer term picture, the rise from 1.1602 long term bottom (2012 low) isn't over yet. We'll keep monitoring the development but there is prospect of extending the rise to 61.8% retracement of 2.1127 to 1.1602 at 1.7488 and above. However, sustained trading below 1.3671 should indicate long term reversal and target 1.1602 long term bottom again.
EUR/CHF Weekly Outlook
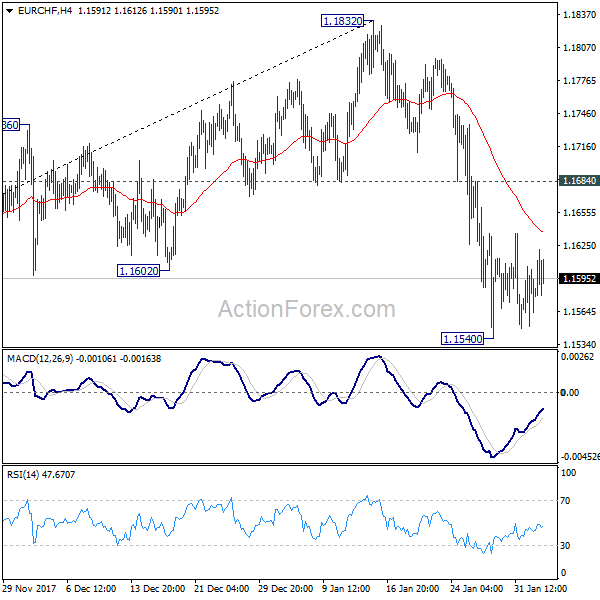
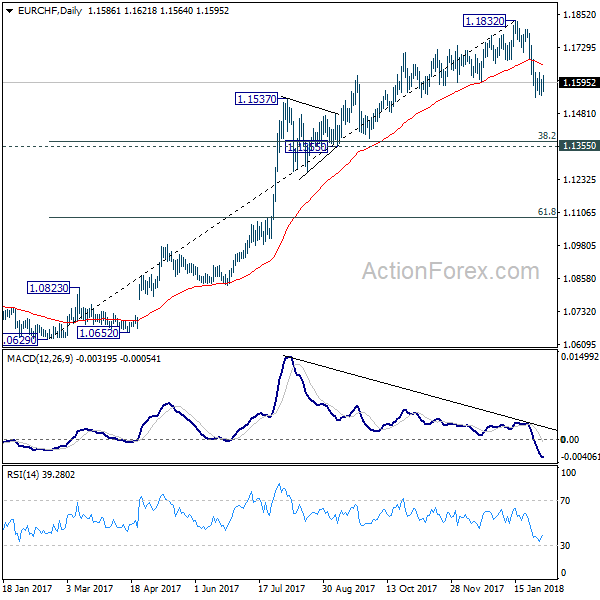
EUR/CHF dipped to 1.1540 last week but formed a temporary low there and recovered. Initial bias stays neutral this week for more consolidations. Upside is expected to limited be limited by 1.1684 resistance to bring fall resumption. As noted before, the decline from 1.1832 is correcting medium term rise from 1.0629. Below 1.1540 will target 1.1355 cluster support (38.2% retracement of 1.0629 to 1.1832 at 1.1372.)
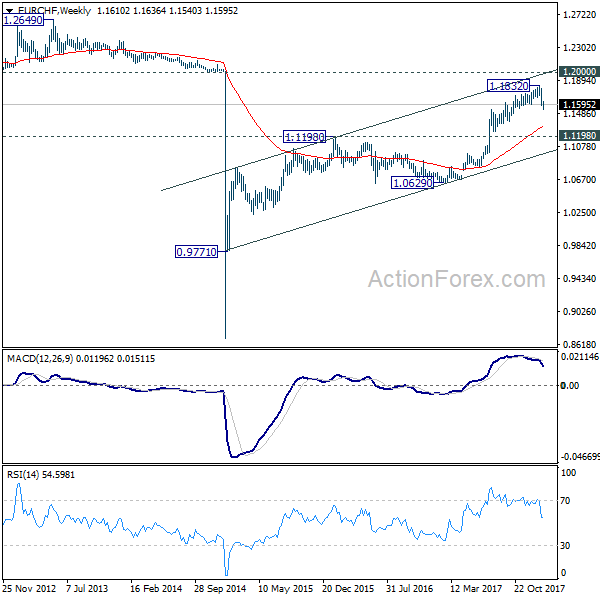
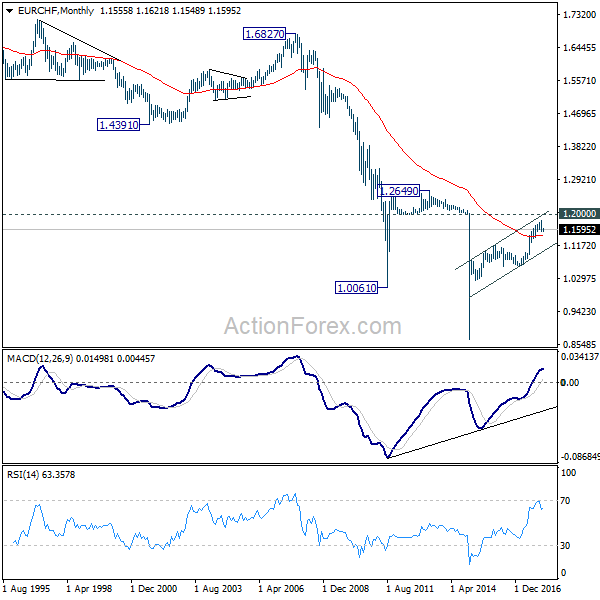
In the bigger picture, a medium term top should be in place at 1.1832 on bearish divergence condition in daily MACD. But there is no indication of long term reversal yet. As long as 1.1198 resistance turned support holds, we'd still expect another rise through prior SNB imposed floor at 1.2000.
Swiss Franc Shone as Global Stocks Markets Entered into Correction Phase
Steep selloff in the global stock markets ended up as the biggest news last week. Some attributed the surge in global yields and stock market declines to the solid non-farm payroll report from US. The headline 200k growth confirmed underlying healthiness in the US job market. And more importantly 0.3% mom rise in average hourly earnings in January, following 0.4% mom rise in December, indicates pickup in momentum in wage growth. The case for Fed to hike three times this year looks more likely than ever. And subject to development, Fed could indeed hike the fourth time in December.
However, we'd like to point out that the NFP report could have triggered acceleration in the moves in stocks and treasury yields. But the move has started much earlier. We've pointed out on Jan 31 already (even though just briefly) that DOW started the long overdue correction, heading back towards 25000 handle. TNX broke 2.621 key medium term resistance two weeks ago and we've mentioned that it's picking up momentum on Jan 30. Looking at the charts of FTSE, DAX and SSE below, we can see that that selloffs didn't start on Friday.
For the moment, the most satisfactory explanation is that investors are finally starting to prepare the end of the era of cheap money globally. As mentioned above, Fed would hike three or even four times this year. There have been repeated calls from ECB officials to announce a clear deadline for asset purchases. Some analysts are starting to predict BoE to pull ahead another rate hike to as soon as May, subject to a Brexit transition deal. BoC has already hiked in January and it's tightening path, though cautious, is not completed. Are we there yet? Probably. But, as suggested below, technically, 3-3.2% region in US 10 year yield could be the real defining point.
In the currency markets, Swiss Franc ended as the strongest major currency again. We pointed out last week it was very much a surprise to see the Franc that strong, given that DAX just hit a record high. At that time, we didn't buy into the idea of risk aversion. But now, it turned out that the Franc could have given us a early warning of risk aversion. But then, the weakness in Yen is puzzling. Euro ended as the second strongest one, followed by Dollar. Aussie suffered most, ended as the weakest one, followed by Yen, and the Loonie.
TNX hit 4 year high, targeting 3.306
US 10 year yield jumped sharply to close at 2.854 last week, at the highest level in 4 years. 61.8% projection of 1.336 to 2.621 from 2.034 at 2.827 is already met. TNX should now target 3.036 key resistance next (2013 high). Decisive break there will target 100% projection at 3.318 next.
Note that TNX will then also face multi-decade channel resistance (now at around 3.2). That will be the defining moment on whether we have finally left behind the low interest rate and loose monetary policy era.
DOW in medium term correction, targeting 24708/50
DOW's -666 pts decline on Friday confirms topping at 26616.71. As the index has just met 261.8% projection of 20379.55 to 22179.11 from 21731.12, 26616.72 should be a medium term top. Fall from there is correcting the rise from 21731.12 and should target 24708.42 cluster support (38.2% retracement of 21731.12 to 26616.71 at 24750.41). As there is no clear sign of long term reversal yet, we'd expect strong support from 24708.42/24750.41 to contain downside.
The long term up trend from 15450.56 is seen as part of the move from 6469.95 (2009 low). Therefore, we'd expect another rise at later stage to 161.8% projection of 10404.09 to 18351.36 from 15450.56 at 28308.59.
FTSE also likely in medium term correction...
Looking at the global markets, FTSE's sharp decline last week also raised the chance of medium term topping at 7792.56, on bearish divergence condition in weekly MACD. Deeper fall is in favor in near term to 55 week EMA (now at 7361.35). Sustained break there will confirm this bearish case. Fall from 77.9256 should then be correcting the whole up trend from 5499.50. And in that case, FTSE should drop through long term channel support to 38.2% retracement of 5499.50 to 6916.61 at least.
...so is DAX
DAX's bearish development is slightly clearer. Immediate focus this week will be on 12745.15 key support level. Break there should confirm medium term topping at 13596.89, on bearish divergence condition in weekly MACD. In that case, fall from 13596.89 should correct whole rise from 9214.09 and target 11868.84 cluster support, 38.2% retracement of 9214.09 to 13596.89 at 11922.66.
Chinese stocks risk medium term reversal too
The Chinese Shanghai composite also suffered steep selling last week, but it managed to pare back some losses and closed higher on Friday. Nevertheless, it should be noted that the SSE index is very close to key long term fibonacci level at 38.2% retracement of 5178.19 to 2638.30 at 3608.53. Rise from 2638.30 is clearly corrective looking. Risk of reversal is high and a break of 55 week EMA (now at 3289.44) might start another medium term up trend back towards 2638.30 low.
Position trading strategy
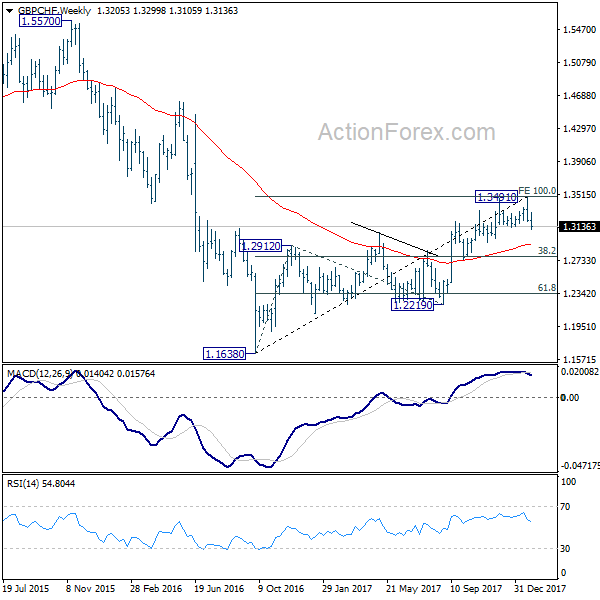
Our AUD/CAD long was stopped out last week, mainly because Aussie was dragged down by AUD/USD's rejection from 0.8124. We'd now look at opportunities to buy Swiss Franc this week, against European majors, on catching up with other pairs. Judging from the resilience of EUR/GBP above 0.8688 support, we'd give GBP/CHF priority.
This our current preferred interpretation of price actions in GBP/CHF. A short term top is at least formed at 1.3491 on bearish divergence condition in daily MACD. 1.3491 is very close to 100% projection of 1.1638 to 1.2912 from 1.2219 at 1.3493. And, considering the price actions from 1.1638 (2016 low), the rise from there could be a corrective move completed three waves at 1.3961. That is, first wave ended at 1.2912, second as a triangle ended at 1.2219, third at 1.3491. We'll sell GBP/CHF on break of last week's low at 1.3105, with stop at 1.3300. 38.2% retracement of 1.1638 to 1.3491 at 1.2783 is the first target. But we're actually looking at 61.8% retracement at 1.2346 and below.
AUD/USD Weekly Outlook
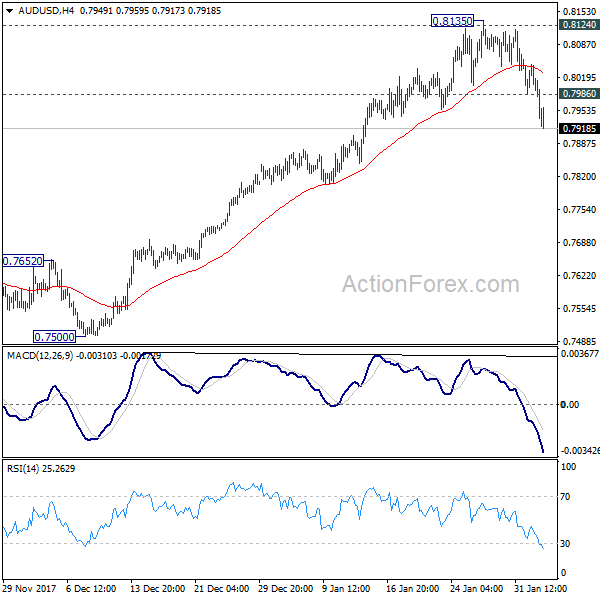
AUD/USD's sharp decline last week confirmed short term topping at 0.8135, after being rejected by 0.8124 resistance. Initial bias remains on the downside this week for 55 day EMA (now at 0.7851). Sustained break there will argue that rise from 0.7500 has already finished and will bring deeper fall to retest this support level. On the upside, above 0.7986 minor resistance will turn intraday bias neutral first. But recovery will likely be limited below 0.8135 resistance at first attempt.
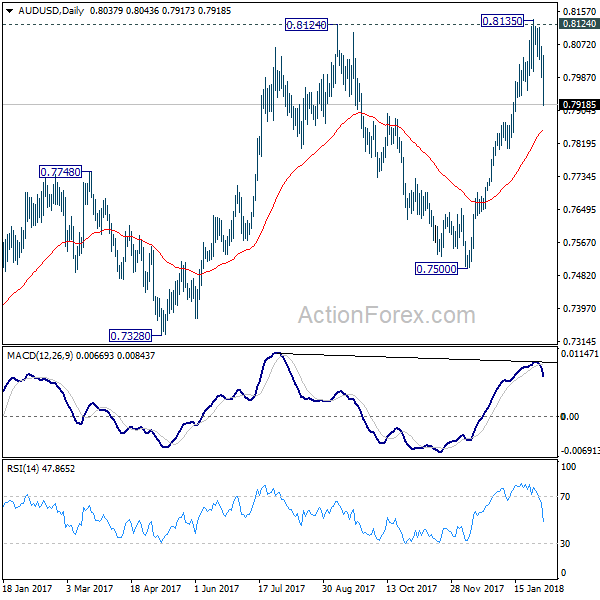
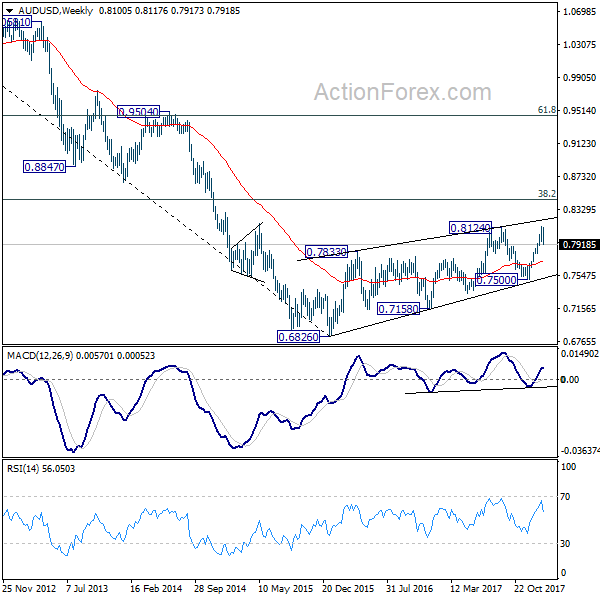
In the bigger picture, medium term rebound from 0.6826 is seen as a corrective move. It might still extend higher but we'd expect strong resistance from 38.2% retracement of 1.1079 to 0.6826 at 0.8451 to limit upside to bring long term down trend resumption. On the downside, break of 0.7500 support will now be an important signal that such corrective rebound is completed.
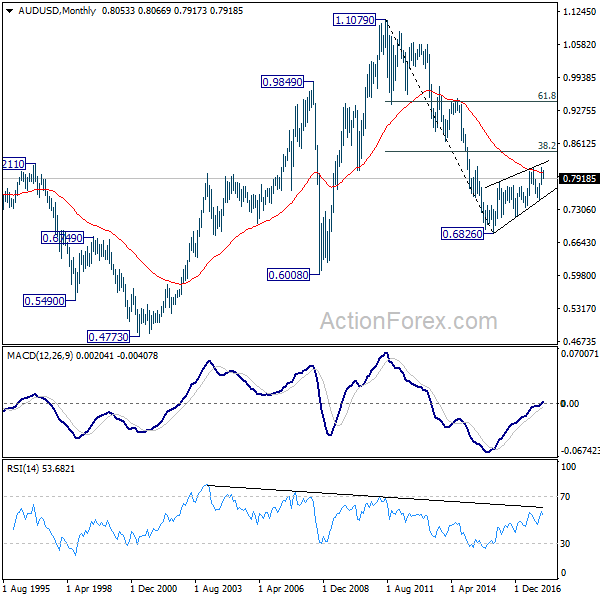
In the longer term picture, 0.6826 is seen as a long term bottom. Rise from there could either reverse the down trend from 1.1079, or just develop into a corrective pattern. At this point, we're favoring the latter. And, as long as 38.2% retracement of 1.1079 to 0.6826 at 0.8451 holds, we'd anticipate another decline through 0.6826 at a later stage. But strong support should be seen between 0.4773 (2001 low) and 0.6008 (2008 low).