Sample Category Title
GBP/JPY Daily Outlook
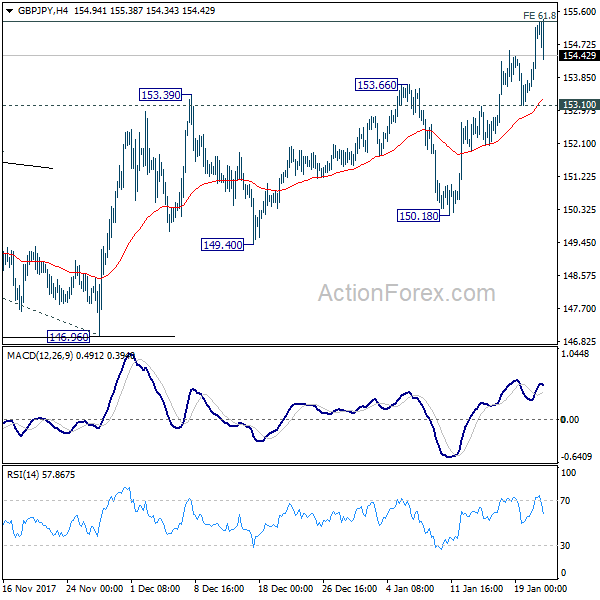
Daily Pivots: (S1) 153.98; (P) 154.61; (R1) 155.79; More...
GBP/JPY's rally extended and met mentioned target of 61.8% projection of 139.29 to 152.82 from 146.96 at 155.32. Intraday bias will remain on the upside as long as 153.10 minor support holds. Break of 155.32 will target 100% projection at 160.49. Though, break of 153.10 will indicate short term topping and bring pull back to 150.18 support.
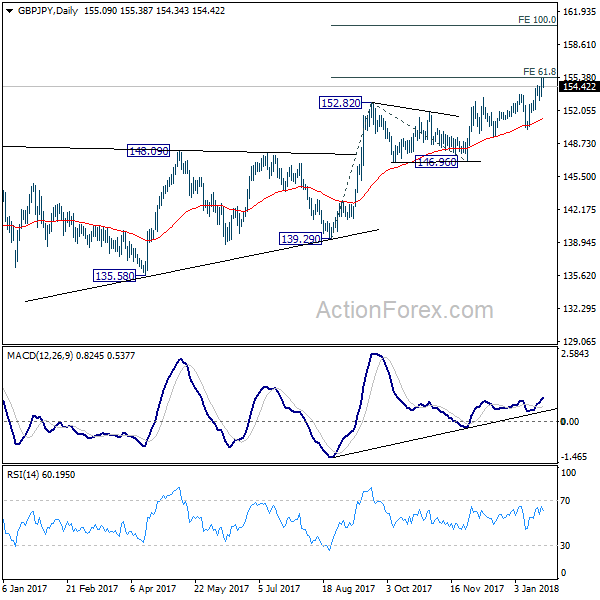
In the bigger picture, as long as 146.96 key support holds, medium term outlook remains bullish. Rise from 122.36 is in favor to extend to 61.8% retracement of 195.86 to 122.36 at 167.78. However, break of 146.96 support will indicate trend reversal. And there would be prospect of retesting 122.36 in that case.
NZDUSD Intraday Analysis
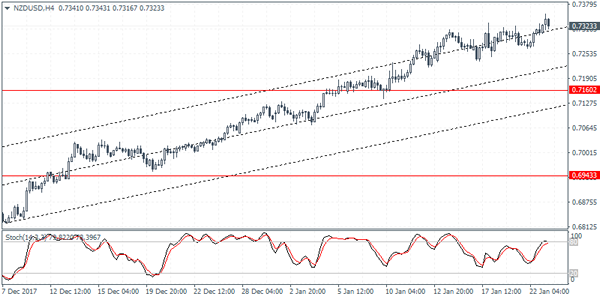
NZDUSD (0.7323): The New Zealand dollar edged higher on Tuesday as price posted an intraday high of 0.7354. However, the Kiwi was seen giving up the gains rather quickly. A bearish close on the day off the intraday highs could signal an eventual decline in the coming few sessions. Support at 0.7160 remains in focus for the Kiwi dollar as we expect prices to correct back to this support level. On the 4-hour chart, the Stochastics oscillator continues to point to easing momentum which could signal a potential correction.
USDJPY Intraday Analysis
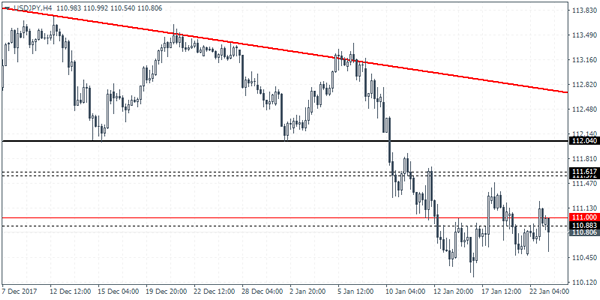
USDJPY (110.80): The USDJPY continues to consolidate near the 110.70 level of support marking a seventh day of prices trading flat near this level. The BoJ's meeting did not offer much for the markets which is expected to keep the currency pair subdued. Currently, we expect that the resistance level near 111.00 - 110.88 will hold any gains in the short term. This exposes USDJPY to downside risks. Price action could be seen falling to the previous lows near 110.40 region with further declines likely on a downside break out below this level.
EUR/JPY Daily Outlook
Daily Pivots: (S1) 135.53; (P) 135.83; (R1) 136.33; More....
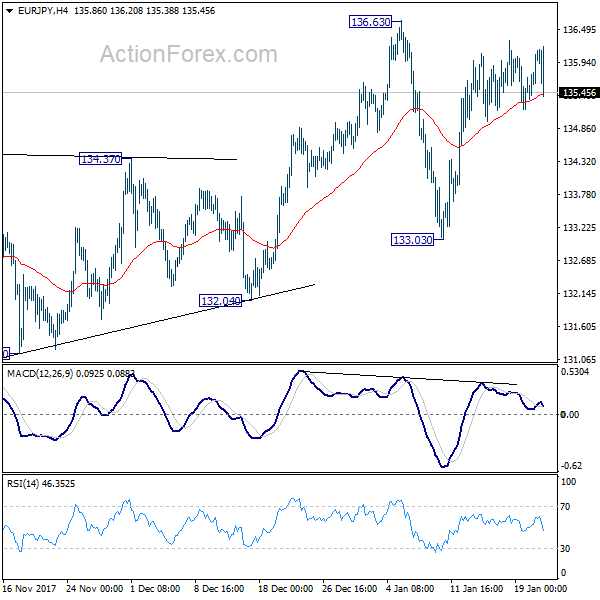
Intraday bias in EUR/JPY remains neutral at this point. More consolidation would be seen in range of 133.03/136.63. But after all, outlook stays bullish with 133.03 support intact. Break of 136.63 will resume medium term up trend. However, on the downside, break of 133.03 will have 55 day EMA and medium term channel support firmly taken out. Also, considering bearish divergence condition in daily MACD too, that will suggest medium term reversal. Deeper fall should then be seen to 132.04 support for confirmation.
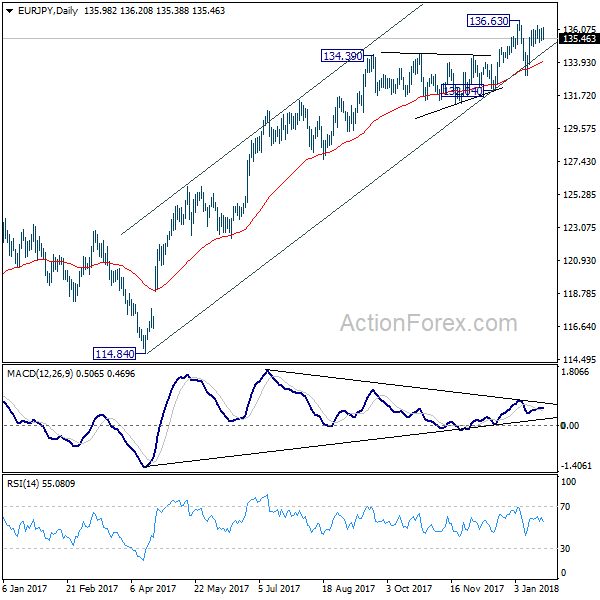
In the bigger picture, medium term rise from 109.03 (2016 low) is seen as at the same degree as the down trend from 149.76 (2014 high) to 109.03 (2016 low). It should be targeting 141.04/149.76 resistance zone. On the downside, break of 132.04 support is needed to indicate medium term reversal. Otherwise, outlook will stay bullish in case of deep pull back.
EURUSD Intraday Analysis
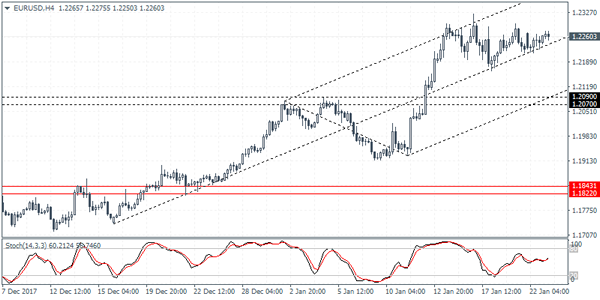
EURUSD (1.2260): The EURUSD fell to an intraday session low of 1.2213 before the currency pair pulled back but closed bearish. Price action remains consolidating near the highs above 1.2200 and this range could be expected into this Thursday's ECB monetary policy meeting. On the 4-hour chart, price action is seen gradually finding support across the median line. However, as long as price action fails to make a higher high, the bias remains to the downside. Watch for support at 1.2183 which could be tested in the short term. A break down below this support could signal a decline to 1.2090 - 1.2070 where the next main support level resides.
EUR/GBP Daily Outlook
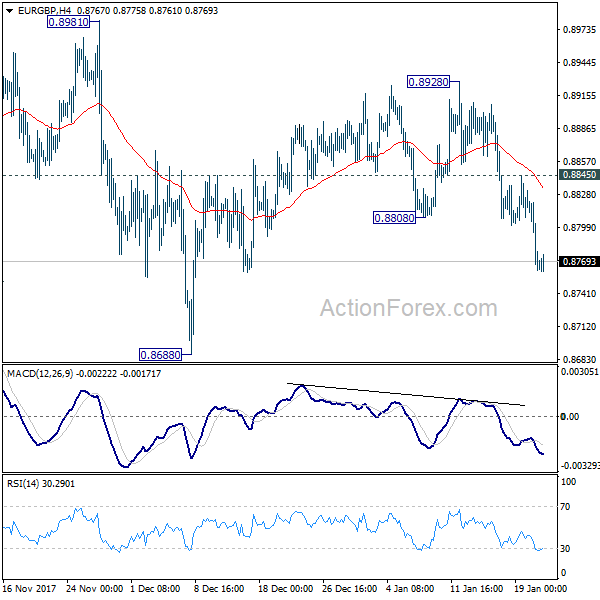
Daily Pivots: (S1) 0.8740; (P) 0.8786; (R1) 0.8810; More...
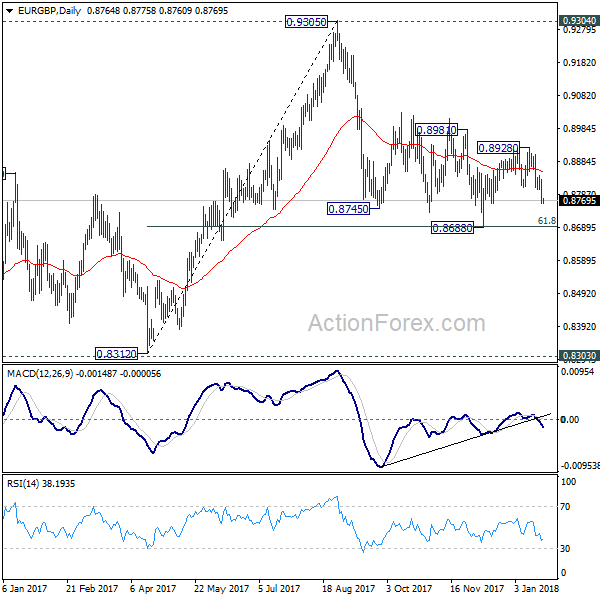
Intraday bias in EUR/GBP remains on the downside as fall from 0.8928 is in progress. Retest of 0.8688 should be seen first. Firm break there would resume whole fall from 0.9305 to retest 0.8303/12 key support zone. On the upside, above 0.8845 minor resistance will turn intraday bias neutral first. But outlook will remain bearish as long as 0.8928 resistance holds, even in case of recovery.
In the bigger picture, there are various ways to interpret price actions from 0.9304 high. But after all, firm break of 0.9304/5 is needed to confirm up trend resumption. Otherwise, range trading will continue with risk of deeper fall. And in that case, EUR/GBP could have a retest on 0.8303. But we'd expect strong support from 0.8116 cluster support (50% retracement of 0.6935 to 0.9304 at 0.8120) to contain downside.
Bank Of Japan Leaves Monetary Policy Unchanged
The Bank of Japan's monetary policy meeting held earlier today saw the central bank leaving interest rates and its QQE purchases unchanged. The Japanese yen was seen strengthening on the back of the BoJ's meeting. Governor Kuroda is expected to hold a press conference in a few hours.
The U.S. dollar was seen giving up its gains despite the Congress approving measures to fund the government for a period of three weeks. This comes after a brief three-day shut down. The economic calendar was sparse yesterday leaving most of the trading to the broader political developments from Washington.
Looking ahead, the UK's public sector net borrowing data is expected to be released today followed by the ZEW economic sentiments from Germany and the Eurozone. Later in the day, the Richmond manufacturing index data will be released.
EUR/AUD Daily Outlook
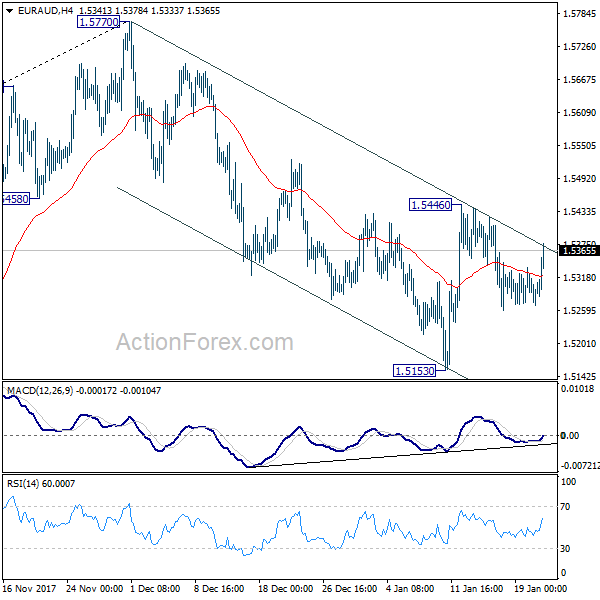
Daily Pivots: (S1) 1.5263; (P) 1.5298; (R1) 1.5326; More....
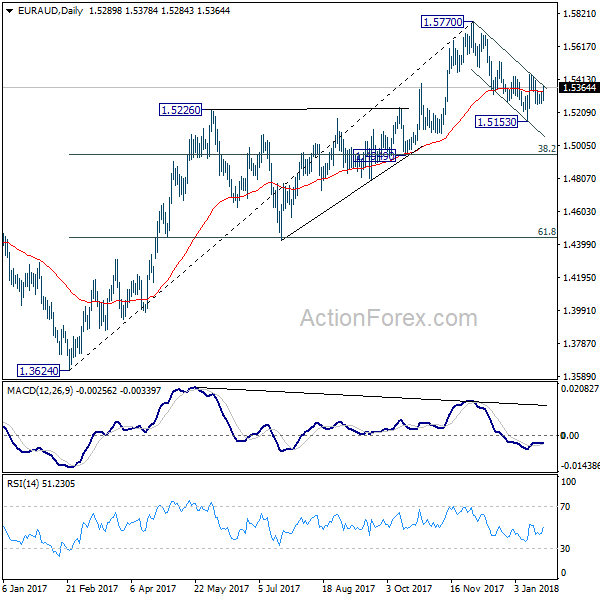
Intraday bias in EUR/AUD remains neutral at this point. On the upside, break of 1.5446 resistance will revive the case that correction from 1.5770 has completed at 1.5153. In that case, intraday bias will be turned back to the upside for retesting 1.5770 first. However, break of 1.5153 will resume the fall from 1.5770 to 1.4949 cluster support (38.2% retracement of 1.3624 to 1.5770 at 1.4950).
In the bigger picture, price actions from 1.5770 so far suggests that it's corrective in nature. That is, medium term rise from 1.3624 is not completed yet. Break of 1.5770 will extend the rise to retest 1.6587 (2015 high). However, considering bearish divergence condition in daily MACD, sustained break of 1.4949 cluster support (38.2% retracement of 1.3624 to 1.5770 at 1.4950) will indicate medium term reversal. And there is prospect of retesting 1.3624 low in that bearish case.
EUR/CHF Daily Outlook
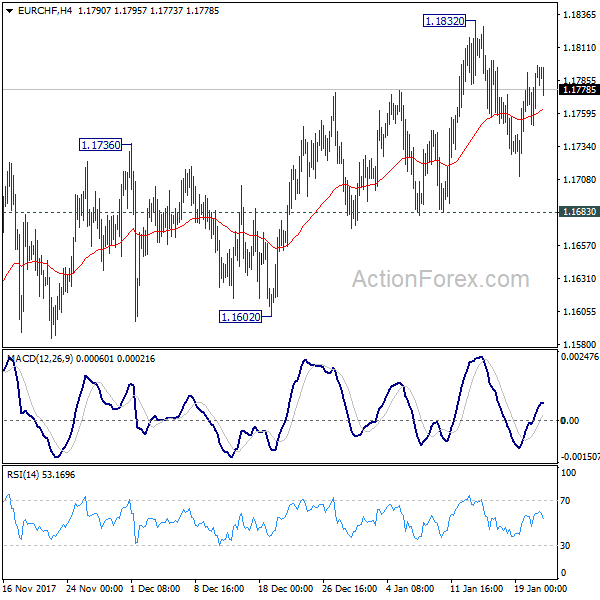
Daily Pivots: (S1) 1.1764; (P) 1.1780; (R1) 1.1810; More...
EUR/CHF is still bounded in consolidative trading below 1.1832 and intraday bias remains neutral. As long as 1.1683 support holds, near term outlook stays bullish for further rally. Again, considering relatively weak upside momentum, in case of another rise, we'd expect strong resistance below 1.2 handle to bring medium term reversal. Break of 1.1683 support will be a early sign of reversal and turn focus to 1.1602 support.
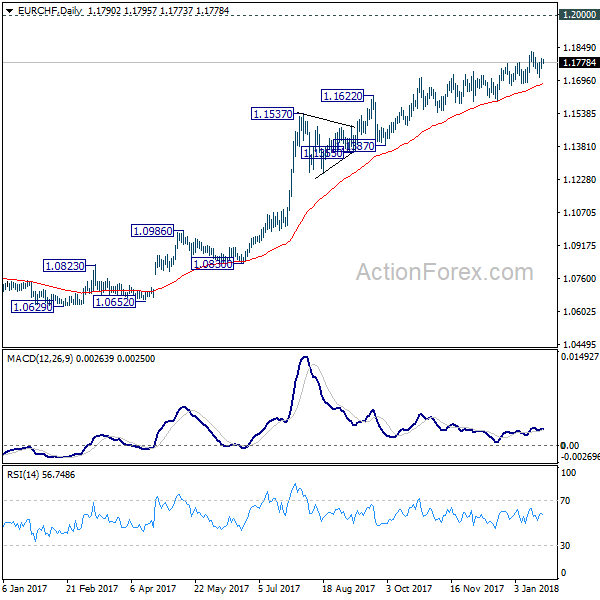
In the bigger picture, while a medium term top could be around the corner, there is no change in the larger outlook. That is, long term rise from SNB spike low back in 2015 is still in progress and would extend. As long as 1.1198 resistance turned support holds, we'll hold on to this bullish view and expect further rise to prior SNB imposed floor at 1.2000 and above. Though, we'll reassess the outlook if 1.1198 is firmly taken out.
GBPUSD Hits Fresh 19-Month High Of 1.40 Handle
GBPUSD surged to a fresh 19-month high during today’s Asian session and hit the strong psychological level of 1.4000. The bullish strength remains intact as the price climbed higher on Monday and successfully surpassed the significant obstacle of 1.3940. The price is developing above its short-term ascending trend line, which has been holding since March 2017.
Short-term momentum indicators are also pointing to a continuation of the bullish bias. However, the RSI is well above the 70-overbought level, suggesting that the latest upswing may be running out of steam and that the risk of a near-term correction is high. On the other hand, the MACD oscillator is moving higher and is strengthening its upside momentum as it stands above its trigger and zero lines.
Further gains should see the 161.8% Fibonacci retracement level at 1.4050 of the last down-leg with the high at 1.3655 and the low at 1.3030. A jump above 1.4050 could drive cable near the next key level of 1.4330 taken from the bottom in May 2016.
In the event of a downside reversal, if the pair slips below the 1.3940 support level, it could open the way for the 1.3655 barrier. Moreover, further losses could lead the way towards the next immediate support of 1.3610.
As a side note, the price posted five straight green weeks and the bullish picture in the medium-term is further supported by the MACD, which is rising and above its red signal line.