Sample Category Title
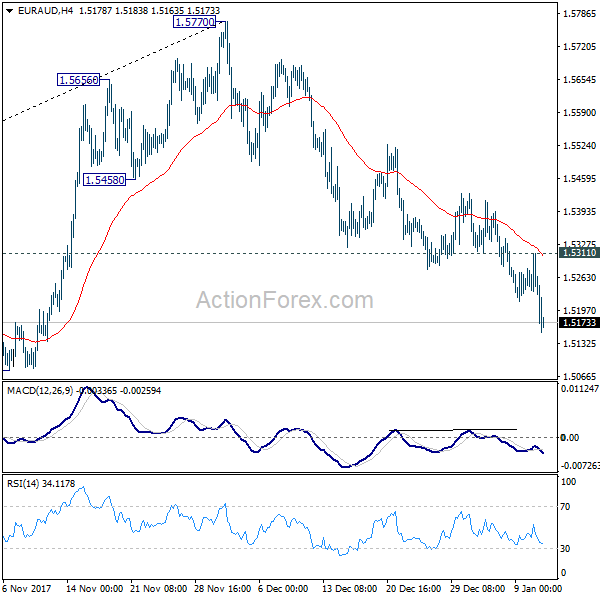
EUR/AUD Daily Outlook
Daily Pivots: (S1) 1.5206; (P) 1.5258; (R1) 1.5286; More....
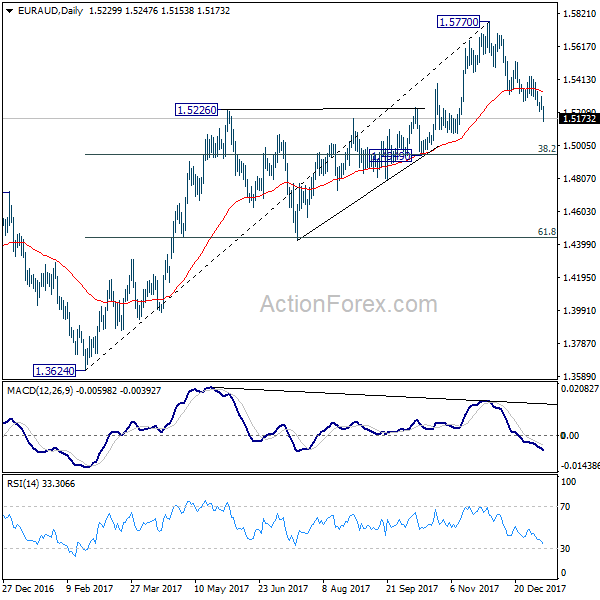
EUR/AUD's decline from 1.5770 extends to as low as 1.5153 so far. The break of 1.5226 resistance turned support is seen as a sign of larger reversal. That is, rise from 1.3624 could be completed at 1.5770 on bearish divergence condition in daily MACD. Intraday bias is now on the downside for 1.4949 cluster support (38.2% retracement of 1.3624 to 1.5770 at 1.4950). On the upside, above 1.5311 minor resistance will turn intraday bias neutral and bring consolidations first.
In the bigger picture, current development argues that the corrective pattern from 1.6587 medium term top (2015 high) is still in progress. And fall from 1.5770 could be the another leg. Sustained trading below 55 week EMA (now at 1.4950) will likely bring retest of 1.3624 support. But overall, there is still prospect of another medium term rally as long as 61.8% retracement of 1.1602 to 1.6587 at 1.3506 holds.
EUR/CHF Daily Outlook
Daily Pivots: (S1) 1.1667; (P) 1.1707; (R1) 1.1728; More...
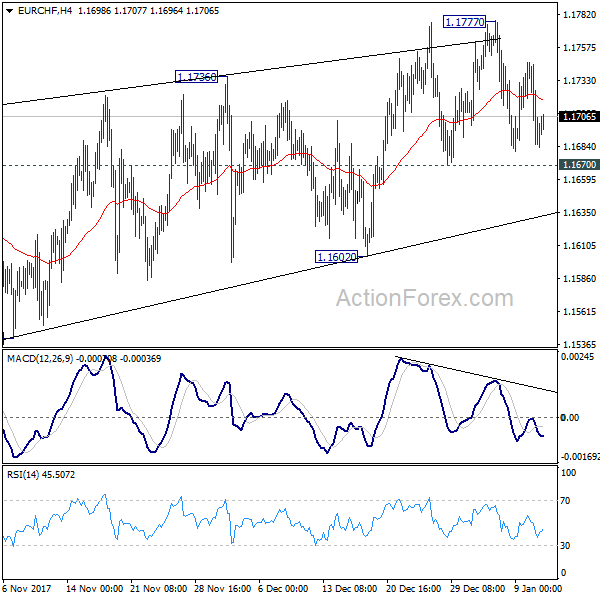
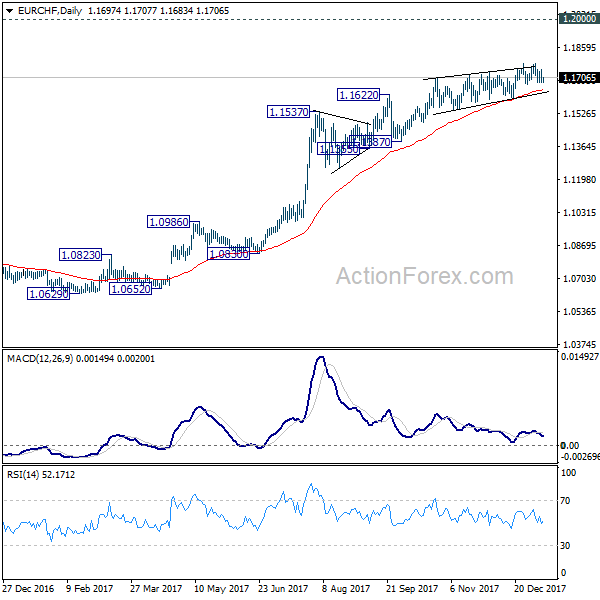
Intraday bias in EUR/CHF remains neutral for the moment. Outlook is unchanged that EUR/CHF should be close to topping, if not formed. And even in case of another rise, strong resistance should be seen well below 1.2 handle to bring medium term reversal. On the downside, below 1.1670 minor support will turn bias to the downside for 1.1602 support first. Further break of 1.1602 will indicate reversal and turn outlook bearish for 1.1387 and below.
In the bigger picture, while a medium term top could be around the corner, there is no change in the larger outlook. That is, long term rise from SNB spike low back in 2015 is still in progress and would extend. As long as 1.1198 resistance turned support holds, we'll hold on to this bullish view and expect another to prior SNB imposed floor at 1.2000. Though, we'll reassess the outlook if 1.1198 is firmly taken out.
USD/CAD Forming Short-Term Bottom At 1.2350
Key Highlights
- The US Dollar after a major decline found a strong support at 1.2350 against the Canadian Dollar.
- There was a break above a crucial bearish trend line at 1.2420 on the 4-hours chart of USD/CAD.
- It seems like the pair has formed a short-term bottom and it could move above 1.2560.
- The US Initial Jobless Claims is scheduled today with forecast as 245K versus the previous 250K.
USDCAD Technical Analysis
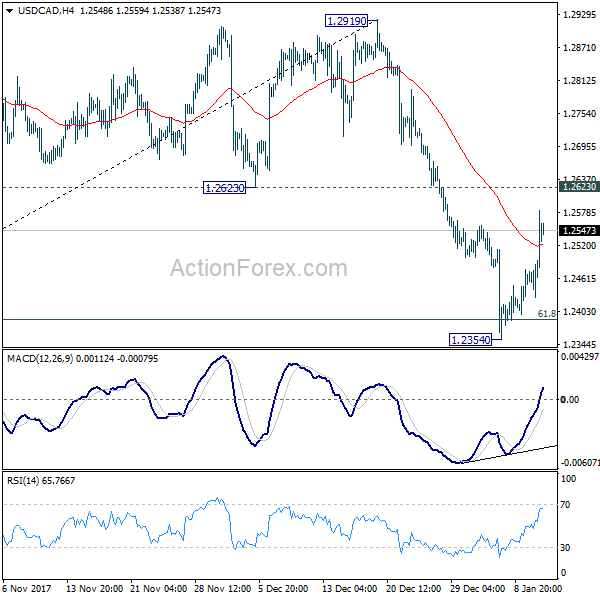
The US Dollar declined heavily during December 2017 against the Canadian Dollar and moved below 1.2500. The USD/CAD pair traded as low as 1.2355 and is currently moving higher.
Looking at the 4-hours chart, there is a bullish scenario forming from the 1.2355 low. The last few candles are positive and signaling a short-term bottom around 1.2350. The pair has recovered and it recently broke a crucial bearish trend line at 1.2420 on the same chart.
The trend line break at 1.2420 has cleared the path for more recoveries in the near term. It helped buyers to push the pair above the 23.6% Fib retracement level of the last major decline from the 1.2920 high to 1.2355 low.
Should there be a proper close above the 1.2560 level, the pair could accelerate higher towards the 1.2600 level. On the upside, the most important resistance is at 1.2625, which is around the 50% Fib retracement level of the last major decline from the 1.2920 high to 1.2355 low.
Moreover, the 100 simple moving average (red, 4-hour) is also positioned at 1.2630. Therefore, if the current recovery extends, the most significant hurdle for buyers on the topside is at 1.2625-30.
On the downside, an initial support is at 1.2500. Below this last, USD/CAD could retest the last swing low of 1.2420. In the mentioned case, the pair will most likely move back in the bearish zone.
Recently, the US saw the release of the Import Price Index for Dec 2017 by the US Department of Labor. The result was negative, as there was an increase in the index by 0.1% (MoM), less than the forecast of 0.5%.
There was no major impact on the greenback, but the pairs such as EUR/USD managed to correct higher. More importantly, GBP/USD succeeded in holding the 1.3480 support area.
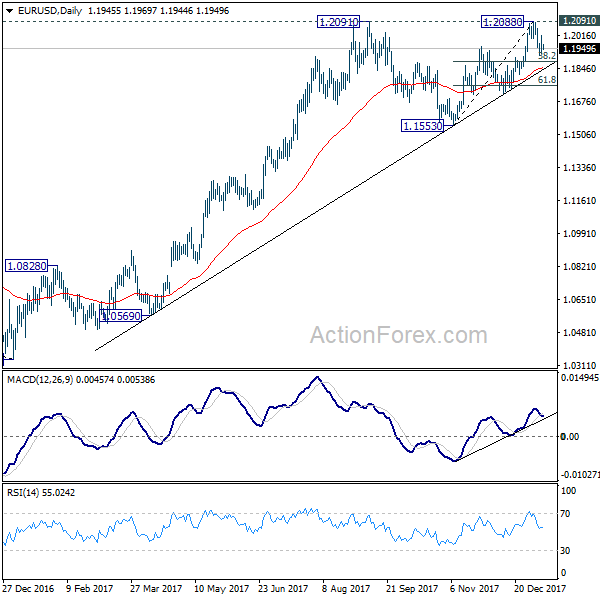
EUR/USD Daily Outlook
Daily Pivots: (S1) 1.1907; (P) 1.1963 (R1) 1.2002; More....
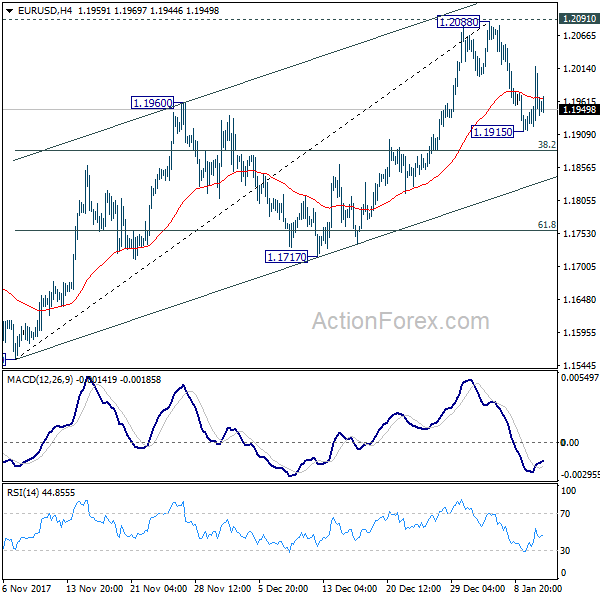
Intraday bias in EUR/USD remains neutral for the moment. Again, decisive break of 1.2091 key resistance is needed to confirm up trend resumption. Otherwise, more corrective trading should be seen with risk of another fall. Below 1.1915 will turn bias to the downside for 38.2% retracement of 1.1553 to 1.2088 at 1.1884. Break will target 61.8% retracement at 1.1757 and below.
In the bigger picture, rise from 1.0339 medium term bottom is still seen as a corrective move for the moment. Therefore, in case of another rally, we'd be expect 38.2% retracement of 1.6039 (2008 high) to 1.0339 (2017 low) at 1.2516 to limit upside and bring reversal. That is also close to 61.8% projection of 1.0569 to 1.2091 from 1.1553 at 1.2494.
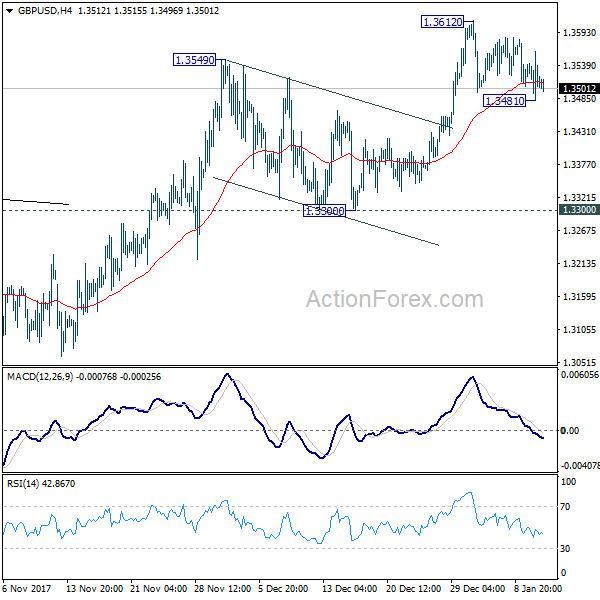
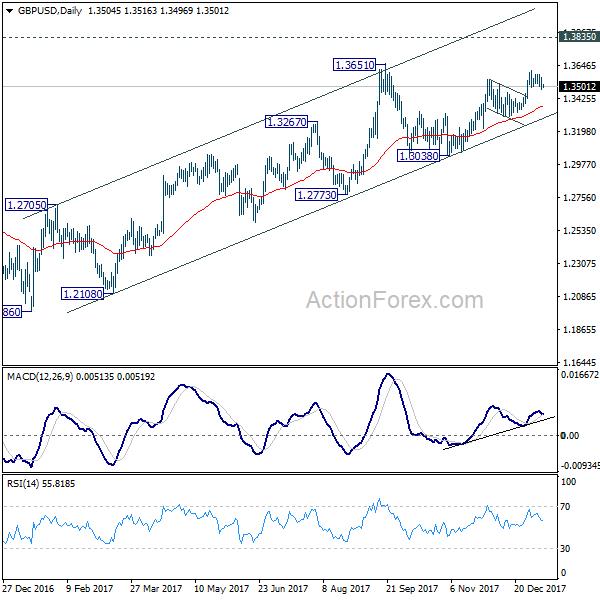
GBP/USD Daily Outlook
Daily Pivots: (S1) 1.3471; (P) 1.3516; (R1) 1.3551; More.....
Intraday bias in GBP/USD remains neutral first. At this point, another rise is still in favor. Above 1.3612 will target 1.3651 key resistance first. Break will resume medium term rise from 1.1946 and target key resistance level at 1.3835. However, another decline and break of 1.3481 will raise the chance of near term reversal and turn focus back to 1.3300 support.
In the bigger picture, the break of long term trend line resistance from 1.7190 (2014 high) is seen as a sign of long term reversal. However, rise from 1.1946 (2016 low) is not impulsive looking. And the pair is limited below 1.3835 key resistance. Hence, we won't turn bullish yet and would continue to monitor the development. On the downside, break of 1.3038 support will now indicate that rebound from 1.1946 has completed and turn outlook bearish. Meanwhile, sustained break of 1.3835 should at least send GBP/USD to 38.2% retracement of 2.1161 (2007 high) to 1.1946 (2016 low) at 1.5466.
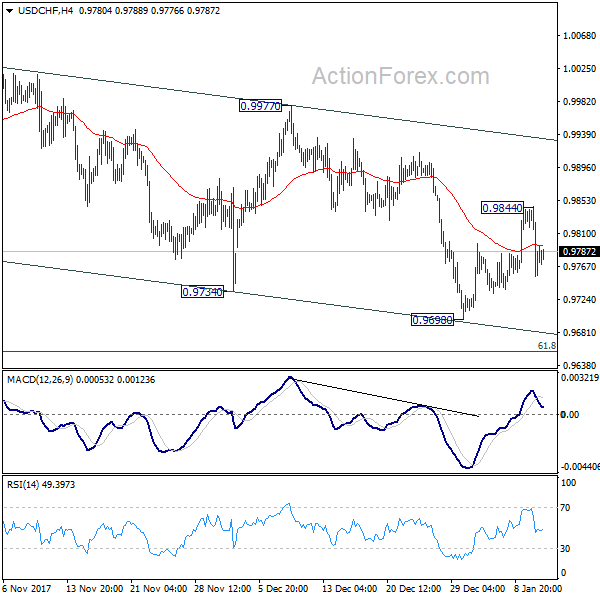
USD/CHF Daily Outlook
Daily Pivots: (S1) 0.9742; (P) 0.9794; (R1) 0.9834; More....
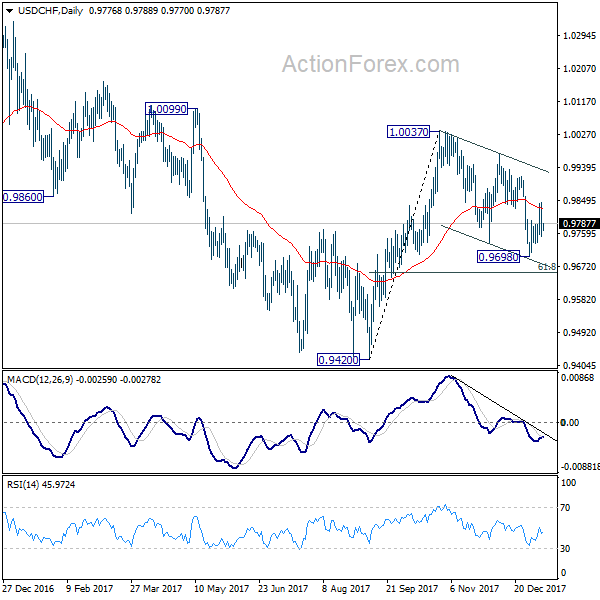
Intraday bias in USD/CHF remains neutral at this point. We're still slightly favoring that correction from 1.0037 has completed with three waves down to 0.9698. Above 0.9844 will turn bias back to the upside for 0.9977 resistance for confirming this bullish view. However, break of 0.9698 will extend such correction to 61.8% retracement of 0.9420 to 0.1.0037 at 0.9656 before completion.
In the bigger picture, range trading continues between 0.9420/1.0342. At this point, 0.9420 appears to be a strong support level. Therefore, in case of decline attempt, we don't expect a firm break of this level. Nonetheless, strong break of 1.0342 is also needed to confirm upside momentum. Otherwise, medium term outlook will stay neutral.
USD/JPY Daily Outlook
Daily Pivots: (S1) 110.86; (P) 111.82; (R1) 112.38; More...
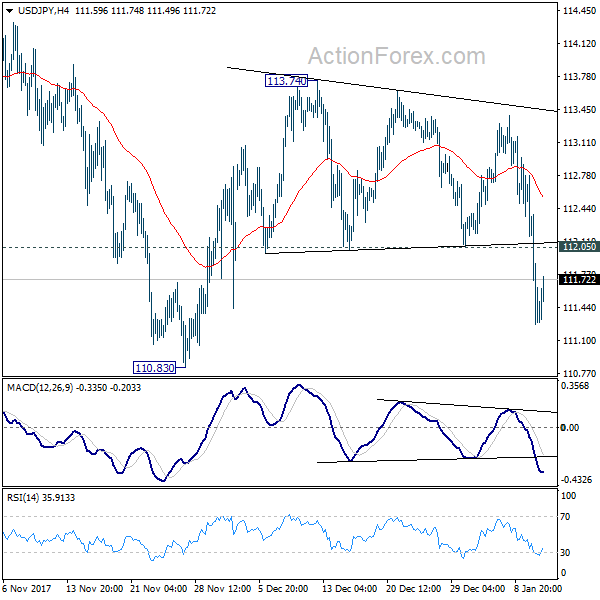
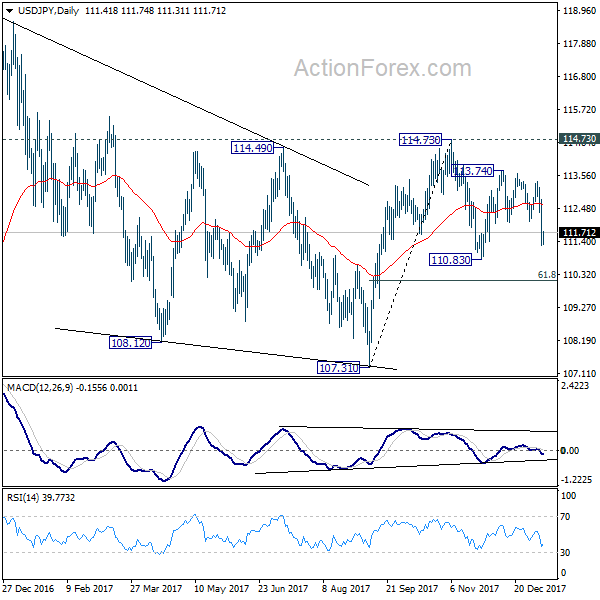
Intraday bias in USD/JPY remains on the downside for 110.83 support. As noted before, current development argues that fall from 114.73 is resuming. Break of 110.83 will target 61.8% retracement of 107.31 to 114.73 at 110.14. We'd look for bottoming signal again below 110.14. On the upside, above 112.05 minor resistance will turn intraday bias neutral first.
In the bigger picture, we're holding on to the view that correction from 118.65 is completed at 107.31. And medium term rise from 98.97 (2016 low) is going to resume soon. Sustained break of 114.73 should affirm our view and send USD/JPY through 118.65. However, break of 107.31 will dampen this view and extend the medium term fall back to 98.97 low.
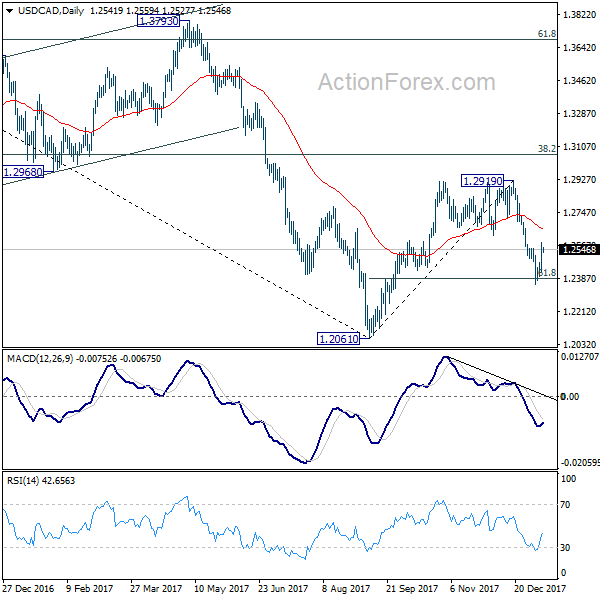
USD/CAD Daily Outlook
Daily Pivots: (S1) 1.2454; (P) 1.2518; (R1) 1.2611; More....
USD/CAD's recovery from 1.2354 is still in progress but outlook is unchanged. Intraday bias stays neutral first. As long as 1.2623 support turned resistance holds, deeper decline is expected. Break of 1.2354 will extend the fall from 1.2910 to retest 1.2061 low. However, sustained break of 1.2623 will argue that the fall has completed and turn bias back to the upside for 1.2919 resistance.
In the bigger picture, current development argues that rebound from 1.2061 has completed at 1.2919, rejected by 55 week EMA (now at 1.2850) and kept below 38.2% retracement of 1.4689 to 1.2061 at 1.3065. The development also suggests that long term fall from 1.4689 is not completed yet. Decisive break of 1.2061 low will target 61.8% retracement of 0.9406 to 1.4689 at 1.1424. This will now be the favored case as long as 1.2919 resistance holds.
Market Morning Briefing: Keep An Eye On The Euro-Yen
STOCKS
Global stocks look mixed. Nifty and Sensex seem to be trading just below crucial resistances and may come off soon while Dax and Nikkei have come off from immediate resistances and could come down in the next few sessions.
Dow (25369.13, -0.07%) looks bullish towards 25400-25600 as mentioned earlier. Dax (13281.34, -0.78%) on the other hand is finding it difficult to sustain a break above 13400 and while below that, the index could also come off towards 13200-13000 soon. Near term looks bearish.
Nikkei (23707.31, -0.34%) tested resistance below 24000 and while that holds, the index could come off slightly towards 23600-23400 in the near term. Looking at the weekly candles this could act as a long term resistance with a possibility of initiating a fresh downward correction in the coming sessions.
Shanghai (3408.80, -0.38%) almost came up to test 3440 yesterday but came off to close at lower levels. On the upside there is scope for testing 3450-3500 in the medium term.
Nifty (10632.20, -0.05%) saw an intra-day low of 10592 yesterday, near the support zone of 10600-10550 and while that holds, we may expect a test of 10750 on the upside. Failure to move up just now would take the index below 10550, initiating fresh correction towards 10400 in the medium term. Similar support on the Sensex (34433.07, -0.03%) would be at 34250 above which the index may remain sideways or try to move up again.
COMMODITIES
Brent (69.15) and WTI (63.53) are almost quiet after the sharp rise seen yesterday. Brent has crucial resistance at 70 which is likely to hold and push back prices towards 68-67 in the medium term. A break above 70 is not factored in just now and if that happens would be surprising. Weekly resistance on the WTI near 65-66 and on the Brent near 70 is expected to produce rejection in the near term.
Gold (1320.10) is paused near 1320 levels and is likely in a sideways consolidation mode unable to decide further movement just now. We may either see a bounce towards 1350 or a fall to 1300 in the near to medium term.
Copper (3.2525) has risen back from 3.23 instead of coming off towards 3.20 or lower. It could re-attempt a test of 3.30-3.35 before coming off to current levels.
FOREX
Keep an eye on the Euro-Yen (133.30). It saw a low just below 133 yesterday. Although it can bounce a bit towards 133.70-90 in the near term, there are increasing chances that it might eventually break below the crucial Support at 133. It would then target 130 in the medium term.
Such a dip in the Euro-Yen would be triggered/ accompanied by a fall in Dollar-Yen (111.44) over the coming days. These two together could try and pull the Euro (1.1960) below 1.19.
To prevent that from happening, the Euro needs to convincingly rise past 1.20 over today-tomorrow. While the potential is still there and it did, in fact, bounce from 1.19 to above 1.20 yesterday, it's failure to sustain that bounce is a little puzzling. We need to watch this carefully over today-tomorrow.
The Chinese Yuan (USDCNY = 6.5054) strengthened a goodish bit yesterday on news that Chinese officials are recommending a halt/ reduction in the purchase of US Bonds. Let us see whether the USDCNY breaks below 6.49 today or moves back up today. A bounce/ rise is a little more probable.
As expected, the Pound (1.3507) is relatively calm amidst the volatility in other currencies and is likely to remain so for some more days.
Contrary to our expectation of a dip to 0.7750, the Aussie (0.7875) did not even fall below 0.7800 and has, in fact, risen strongly today morning. This seems to be fresh strength that could pull the Aussie up towards 0.7950-8000 this time.
As expected, Dollar-Rupee (63.60) found Resistance just above 63.80 and can dip to 63.50-45 today. Direction after that is unclear.
INTEREST RATES
Global bond markets could well be entering a bearish phase with higher crude prices raising inflation and consequently, investors’ expectations for higher yields.
The US 10Yr (2.5495%) reached highs near 2.588% with news of China’s reluctance to buy US bonds coming in. We could now expect the 10 Yr yields to consolidate near 2.55% for sometime before targeting 2.62% on the upside, seen as resistance on short term charts. US 30 Yr (2.8928%) could move up to resistance near 2.94% on the short term chart and stay below that level for few days before attempting another rise. Expectations of higher inflation being reflected in the CPI data release (due tomorrow) seems to have been already factored into the rise in yields recently. However, we still need to see if some surprises could push the yields further up.
Japanese 10 Yr Yield (0.075%) dipped from yesterday’s levels around 0.088%, where we see resistance on the short term charts. This resistance could hold for the time being.
The German 10 Yr Bund Yield (0.543%) is testing resistance on the medium term chart and could dip from here. The German-US 10 Yr Yield Spread (-2.0095%) has gone up appreciably from yesterday and might attempt a test of resistance near -1.9% on the long term chart in the coming sessions.
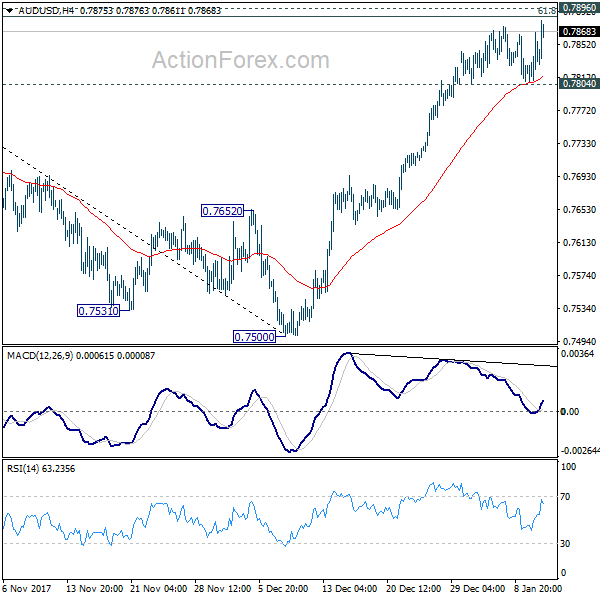
AUD/USD Daily Outlook
Daily Pivots: (S1) 0.7811; (P) 0.7838; (R1) 0.7869; More...
AUD/USD's rally resumed after drawing support from 4 hour 55 EMA. Outlook is unchanged. Considering bearish divergence condition in 4 hour MACD, upside should be limited by 0.7896 cluster resistance (61.8% retracement of 0.8124 to 0.7500 at 0.7886) resistance zone to bring short term topping. Break of 0.7804 minor support will turn bias to the downside for 55 day EMA (now at 0.7725). However, sustained break of 0.7886/96 will pave the way for retesting 0.8124 high.
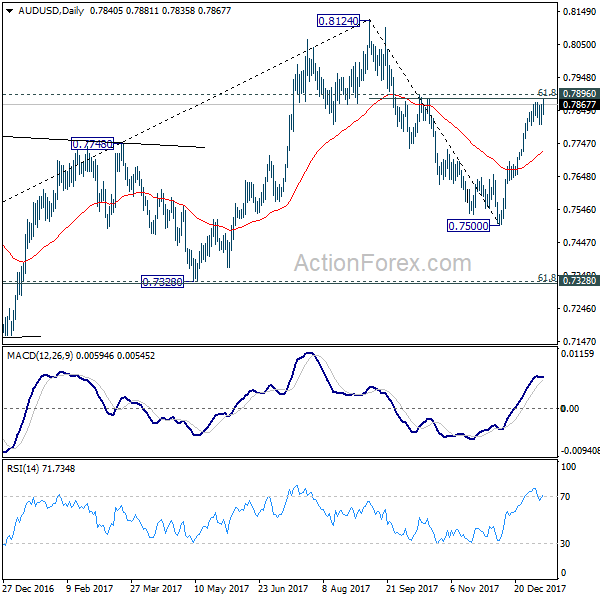
In the bigger picture, we're still slightly favoring the case that corrective rise from 0.6826 medium term bottom is completed at 0.8124, after hitting 55 month EMA (now at 0.8032). But stronger than expected rebound from 0.7500 is dampening this bearish view. On the downside, break of 0.7500 will target 0.7328 key cluster support (61.8% retracement 0.6826 to 0.8124 at 0.7322) to confirm this bearish case. But break of 0.8124 will extend the rise from 0.6826 to 38.2% retracement of 1.1079 (2011 high) to 0.6826 (2016 low) at 0.8451 before completion.