Sample Category Title
Swiss Franc Trading Marginally Lower This Morning
For the 24 hours to 23:00 GMT, the USD declined 0.21% against the CHF and closed at 0.9721.
In the Asian session, at GMT0400, the pair is trading at 0.9723, with the USD trading a tad higher against the CHF from yesterday’s close.
The pair is expected to find support at 0.9702, and a fall through could take it to the next support level of 0.9681. The pair is expected to find its first resistance at 0.9742, and a rise through could take it to the next resistance level of 0.9761.
Ahead in the day, traders would keep a close watch on Switzerland’s real retail sales for November and SVME–PMI for December.
The currency pair is showing convergence with its 20 Hr moving average and trading below its 50 Hr moving average.

Canada’s Manufacturing Sector Growth At A 3-Month High In December
For the 24 hours to 23:00 GMT, the USD declined 0.36% against the CAD and closed at 1.2513.
The Canadian Dollar gained ground against the USD, after Canada's Markit manufacturing PMI climbed to a level of 54.7 in December, notching to a three-month high level, thus suggesting that manufacturers ended the fourth quarter on a strong footing. The PMI had registered a level of 54.4 in the prior month.
In the Asian session, at GMT0400, the pair is trading at 1.2521, with the USD trading 0.06% higher against the CAD from yesterday's close.
The pair is expected to find support at 1.2497, and a fall through could take it to the next support level of 1.2474. The pair is expected to find its first resistance at 1.2547, and a rise through could take it to the next resistance level of 1.2574.
The currency pair is showing convergence with its 20 Hr moving average and trading below its 50 Hr moving average.

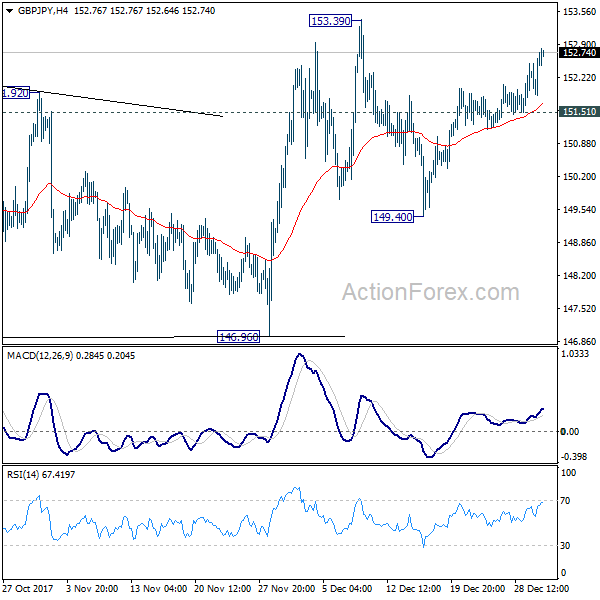
GBP/JPY Daily Outlook
Daily Pivots: (S1) 152.08; (P) 152.40; (R1) 152.94; More...
Intraday bias in GBP/JPY remains on the upside as rebound from 149.40 continues to 153.39 resistance. Break will resume medium term rally. On the downside, below 151.51 minor support will extend the corrective pattern with another fall through 149.40 before completion.
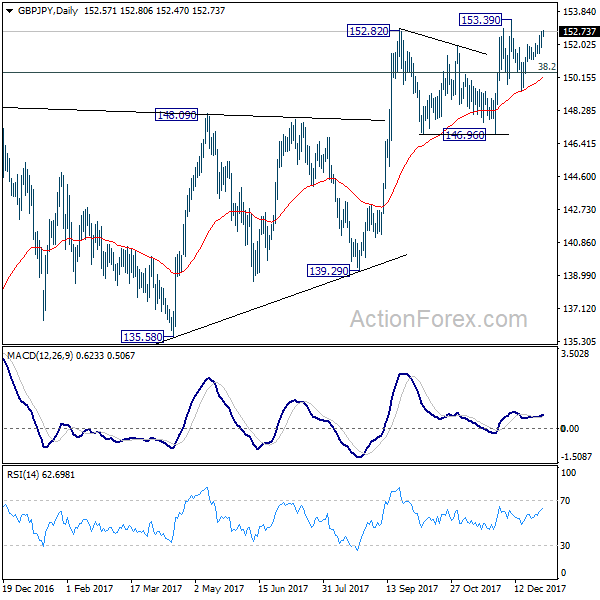
In the bigger picture, outlook is mixed up a bit with last week's sharp decline. But still, as long as 146.96 key support holds, medium term outlook remains bullish. Rise from 122.36 is in favor to extend to 61.8% retracement of 195.86 to 122.36 at 167.78. However, break of 146.96 support will indicate trend reversal. And the corrective structure of rebound from 122.36 will argue that larger down trend is resuming for a new low below 122.26.
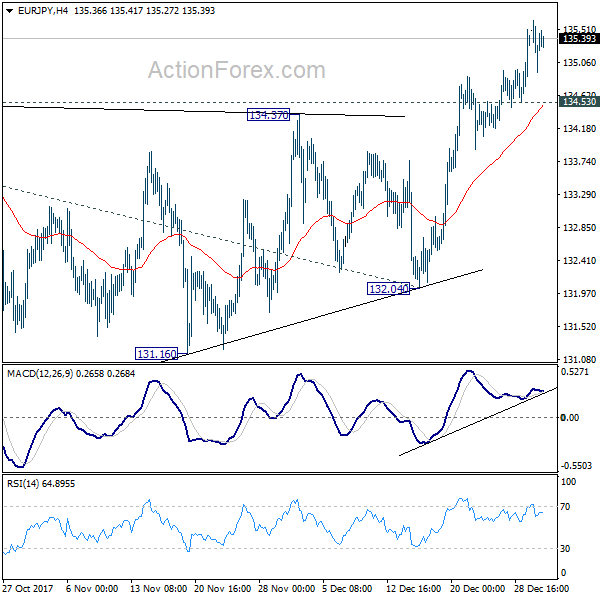
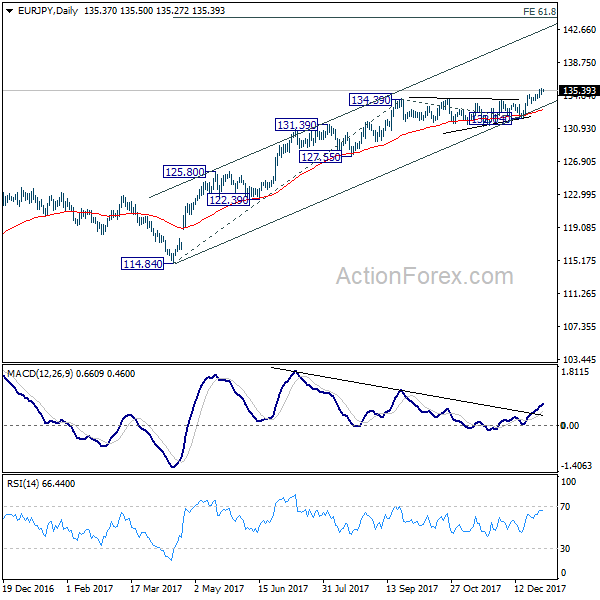
EUR/JPY Daily Outlook
Daily Pivots: (S1) 135.01; (P) 135.32; (R1) 135.70; More....
With 134.53 minor support intact, intraday bias in EUR/JPY remains on the upside. Current medium term rally would target 61.8% projection of 114.84 to 134.39 from 132.04 at 144.12. On the downside, below 134.53 minor support will turn intraday bias neutral again.
In the bigger picture, medium term rise from 109.03 (2016 low) is seen as at the same degree as the down trend from 149.76 (2014 high) to 109.03 (2016 low). Sustained break of 61.8% retracement of 149.76 to 109.03 at 134.20 will pave the way to key long term resistance zone at 141.04/149.76. However, break of 132.04 support will suggest medium term topping and will turn outlook bearish for deeper fall back 55 week EMA (now at 128.34).
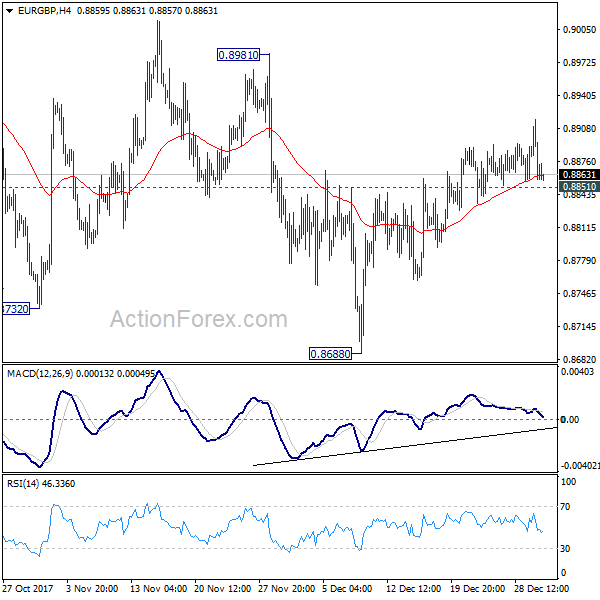
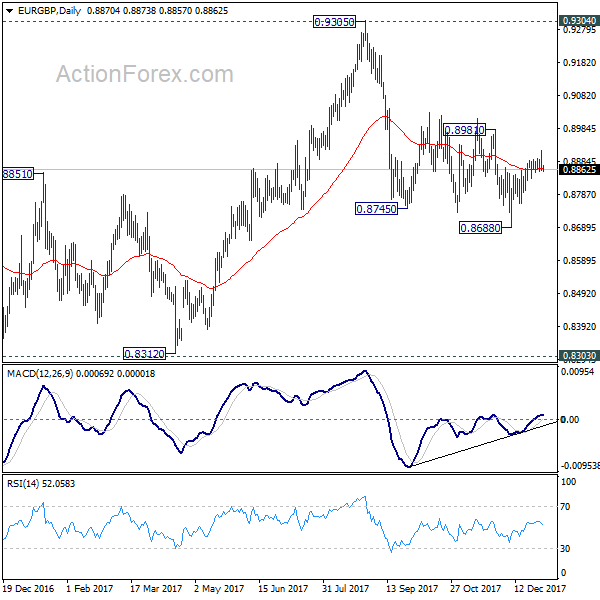
EUR/GBP Daily Outlook
Daily Pivots: (S1) 0.8846; (P) 0.8882; (R1) 0.8905; More...
At this point,f further rise is mildly in favor in EUR/GBP to 0.8981 resistance. Sustained break there will indicate that whole decline from 0.9305 has completed. In such case, EUR/GBP will target a test on 0.9304/5 key resistance. On the downside, below 0.8851 minor support will turn bias back to the downside for 0.8668 instead.
In the bigger picture, there are various ways to interpret price actions from 0.9304 high. But after all, firm break of 0.9304/5 is needed to confirm up trend resumption. Otherwise, range trading will continue with risk of deeper fall. And in that case, EUR/GBP could have a retest on 0.8303. But we'd expect strong support from 0.8116 cluster support (50% retracement of 0.6935 to 0.9304 at 0.8120) to contain downside.
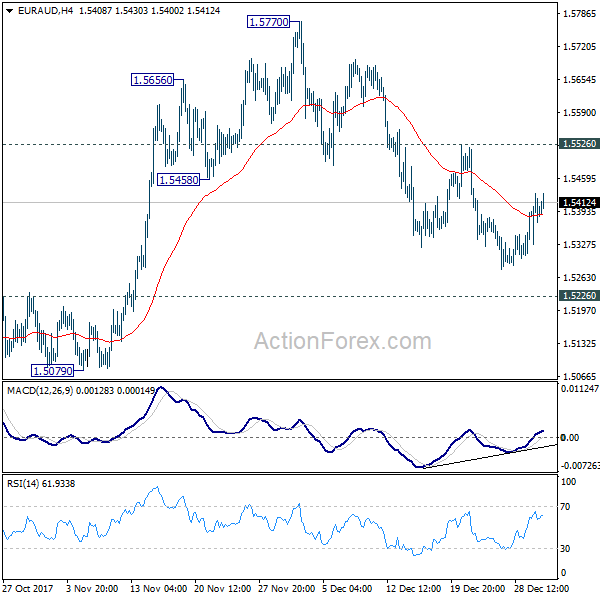
EUR/AUD Daily Outlook
Daily Pivots: (S1) 1.5339; (P) 1.5383; (R1) 1.5445; More....
Intraday bias in EUR/AUD stays neutral for the moment and outlook is unchanged. The correction from 1.5570 could still extend lower. But again, near term outlook stays bullish with 1.5226 resistance turned support intact. Break of 1.5526 minor resistance will turn bias back to the upside for retesting 1.5770 resistance. However, sustained break of 1.5226 will indicate larger reversal and target 1.4949 support next.
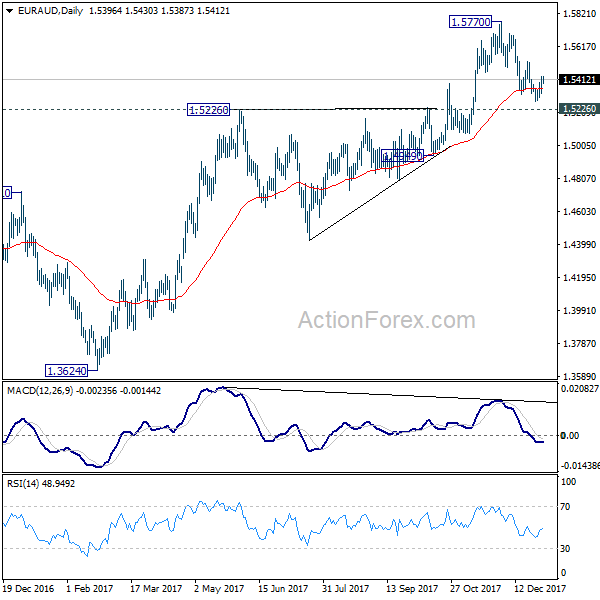
In the bigger picture, we're holding on to the view that corrective decline from 1.6587 medium term top (2015 high) has completed at 1.3624. Rise from 1.3624 is expected to extend to retest 1.6587. We'll hold on to this bullish view as long as 1.5226 resistance turned support holds. Firm break of 1.6587 will resume long term rise from 1.1602 (2012 low). However, sustained break of 1.5226 will indicate trend reversal and target 1.3624 again.
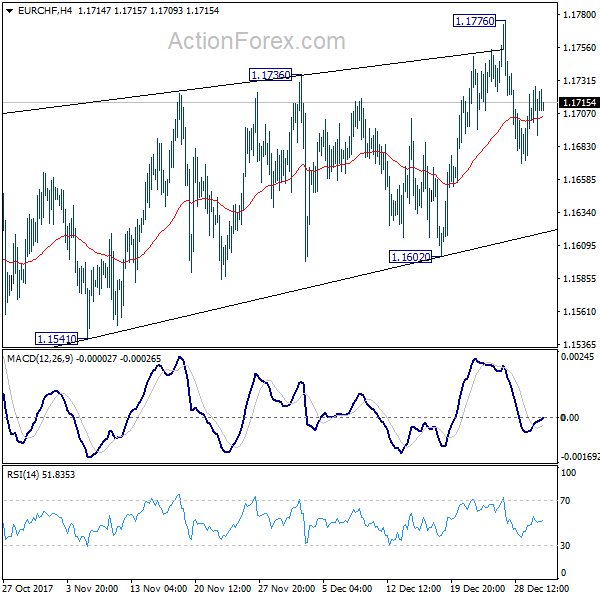
EUR/CHF Daily Outlook
Daily Pivots: (S1) 1.1694; (P) 1.1710; (R1) 1.1733; More...
Intraday bias in EUR/CHF remains neutral at this point and outlook is unchanged. While there is no confirmation yet, we'd maintain that the cross is close to topping. And in case of another rise, strong resistance should be seen well below 1.2 handle to bring medium term reversal. On the downside, break of 1.1602 support will indicate reversal and turn outlook bearish for 1.1387 and below.
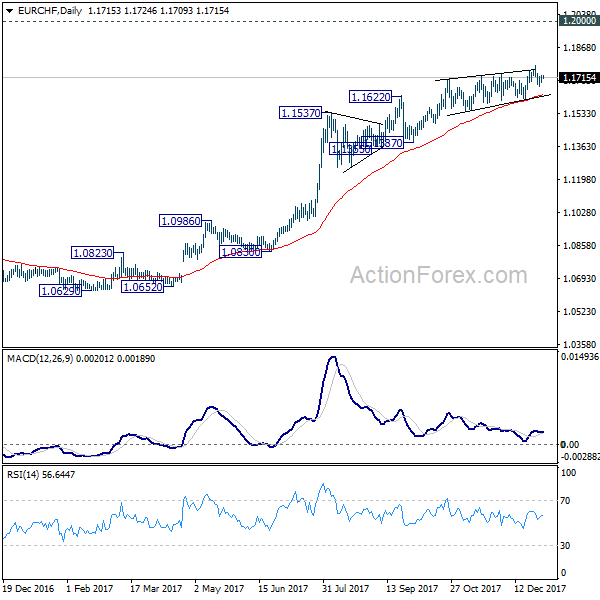
In the bigger picture, while a medium term top could be around the corner, there is no change in the larger outlook. That is, long term rise from SNB spike low back in 2015 is still in progress and would extend. As long as 1.1198 resistance turned support holds, we'll hold on to this bullish view and expect another to prior SNB imposed floor at 1.2000. Though, we'll reassess the outlook if 1.1198 is firmly taken out.
Elliott Wave View: Nasdaq Ended Correction
Elliott Wave view for Nasdaq suggests that the Index has ended the correction to the cycle from 12/5 low at 6383.25 and from there it it has started the next leg higher. Up from Intermediate wave (4) low on 12/5, the rally unfolded as a double three Elliott Wave structure where Minor wave W ended at 6545.75 and Minor wave X is proposed complete at 6383.25. However, for this view to gain validity, the Index needs to break above Minor wave W at 6545.75.
Internal of Minor wave W unfolded as a double three Elliott Wave structure where Minute wave ((w)) ended at 6427.75, Minute wave ((x)) ended at 6383, and Minute wave ((y)) of W ended at 6545.75. The Index then pullback in Minor wave X which unfolded as a a triple three Elliott Wave structure where Minute wave ((w)) ended at 6463.25, Minute wave ((x)) ended at 6520.75, Minute wave ((y)) ended at 6432.25, and second Minute wave ((x)) of X ended at 6383.25.
Short term, rally from 12/30 low (6383.25)( looks impulsive and could see more upside to end 5 waves up in Minutte wave (a). Afterwards, the Index should pullback in Minutte wave (b) in 3, 7, or 11 swing to correct cycle from 12/30 low (6383.25) before turning higher again. We don’t like selling the Index and while dips stay above 6383.25, and more importantly above 6232.30, expect Index to extend higher.
Nasdaq 1 Hour Elliott Wave Chart
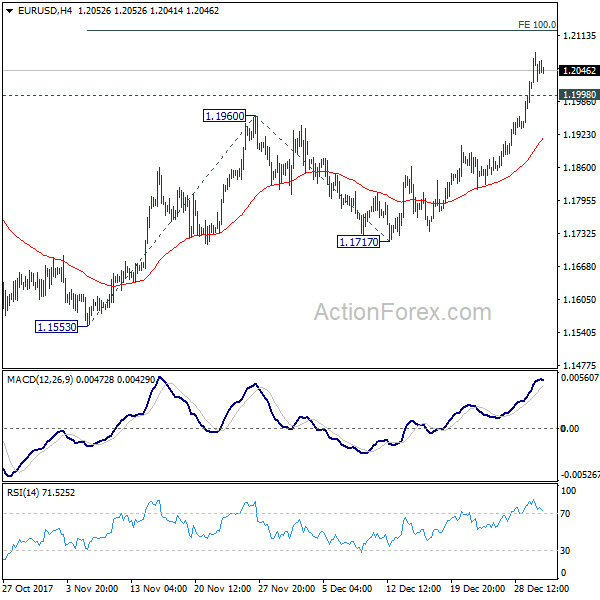
EUR/USD Daily Outlook
Daily Pivots: (S1) 1.2010; (P) 1.2045 (R1) 1.2094; More....
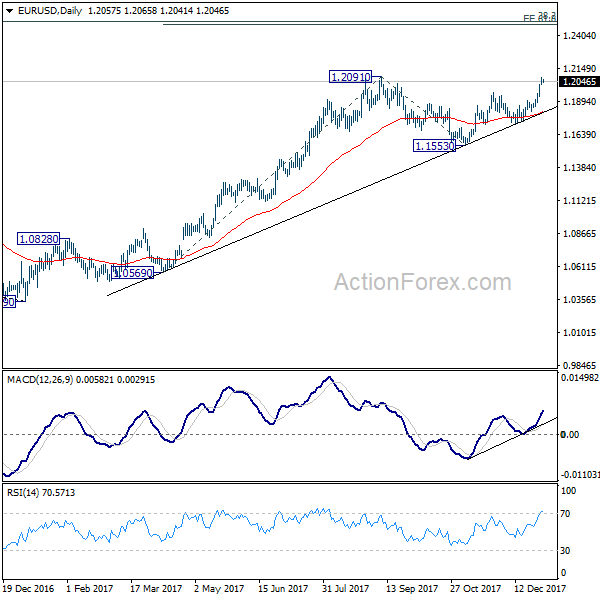
With 1.1998 minor support intact, intraday bias in EUR/USD remains on the upside for 100% projection of 1.1553 to 1.1960 from 1.1717 at 1.2124, which is above 1.2091 high. Decisive break there will confirm medium term rally resumption and target next key fibonacci level at 1.2494/2516. On the below 1.1998 minor support will turn intraday bias neutral and bring consolidation before staging another upmove.
In the bigger picture, rise from 1.0339 medium term bottom is seen as a corrective move for the moment. Therefore, in case of another rally, we'd be expect 38.2% retracement of 1.6039 (2008 high) to 1.0339 (2017 low) at 1.2516 to limit upside and bring reversal. That is also close to 61.8% projection of 1.0569 to 1.2091 from 1.1553 at 1.2494.
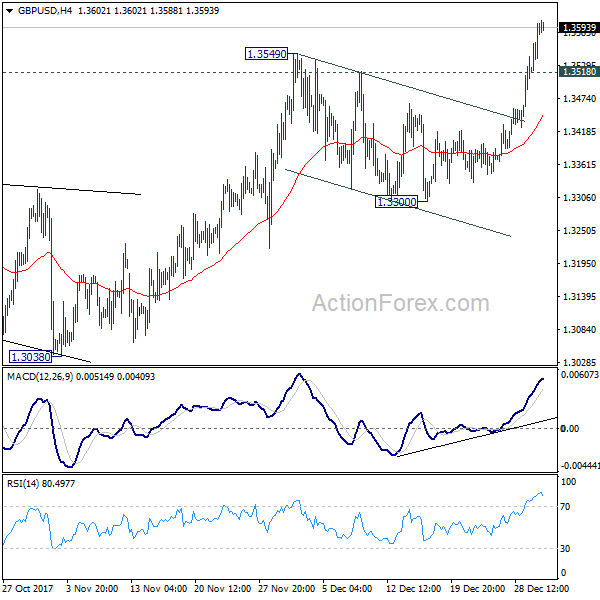
GBP/USD Daily Outlook
Daily Pivots: (S1) 1.3527; (P) 1.3564; (R1) 1.3629; More.....
Intraday bias in GBP/USD remains on the upside for 1.3651 resistance. Break will resume medium term rise from 1.1946 and target key resistance level at 1.3835. On the downside, below 1.3518 minor support will turn intraday bias neutral first. But outlook will stay bullish as long as 1.3300 support holds.
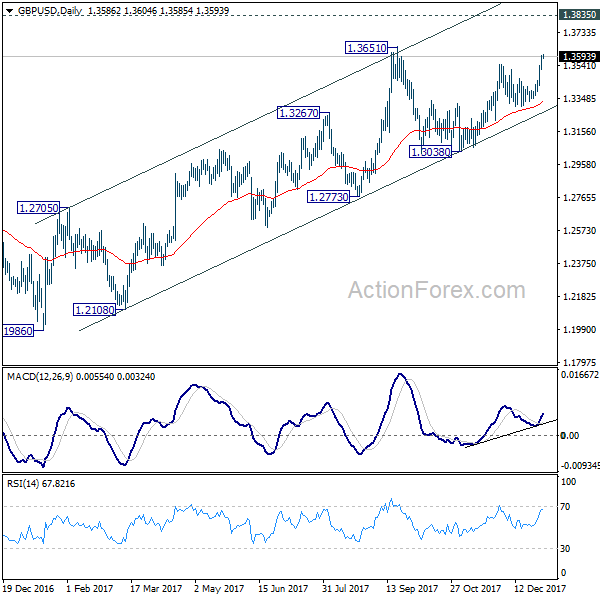
In the bigger picture, while the medium term rebound from 1.1946 low was strong, it's limited below 1.3835 key support turned resistance. As long as 1.3835 holds, we'd view such rebound as a correction. That is, we'd expect another leg in the long term down trend through 1.1946 low. However, sustained break of 1.3835 should at least send GBP/USD to 38.2% retracement of 2.1161 (2007 high) to 1.1946 (2016 low) at 1.5466.