Sample Category Title
Japanese Yen Trading Marginally Lower In The Asian Session
For the 24 hours to 23:00 GMT, the USD slightly declined against the JPY and closed at 112.67.
In the Asian session, at GMT0400, the pair is trading at 112.7, with the USD trading a tad higher against the JPY from yesterday’s close.
The pair is expected to find support at 112.60, and a fall through could take it to the next support level of 112.49. The pair is expected to find its first resistance at 112.80, and a rise through could take it to the next resistance level of 112.89.
In absence of key macroeconomic releases in Japan today, investor sentiment would be governed by global macroeconomic events.
The currency pair is showing convergence with its 20 Hr moving average and trading below its 50 Hr moving average.

Swiss Franc Extends Its Gains In The Asian Session
For the 24 hours to 23:00 GMT, the USD declined 0.39% against the CHF and closed at 0.9741.
In the Asian session, at GMT0400, the pair is trading at 0.9734, with the USD trading 0.07% lower against the CHF from yesterday’s close.
The pair is expected to find support at 0.9720, and a fall through could take it to the next support level of 0.9707. The pair is expected to find its first resistance at 0.9758, and a rise through could take it to the next resistance level of 0.9783.
The currency pair is trading below its 20 Hr and 50 Hr moving averages.

Loonie Trading Higher, Ahead Of Canada’s RBC Manufacturing PMI
For the 24 hours to 23:00 GMT, the USD declined 0.06% against the CAD and closed at 1.2558.
In the Asian session, at GMT0400, the pair is trading at 1.2536, with the USD trading 0.18% lower against the CAD from yesterday's close.
The pair is expected to find support at 1.2520, and a fall through could take it to the next support level of 1.2503. The pair is expected to find its first resistance at 1.2565, and a rise through could take it to the next resistance level of 1.2593.
Ahead in the day, investors would closely monitor Canada's RBC manufacturing PMI for December.
The currency pair is trading below its 20 Hr and 50 Hr moving averages.

Daily Wave Analysis: EUR/USD Uptrend Challenges Round 1.20 Resistance Level
Currency pair EUR/USD
The EUR/USD uptrend remains strong and has reached a solid resistance zone (red lines). A bearish reversal could send the EUR/USD lower to test the wave 2 vs 1 (pink) whereas a bullish breakout could indicate a continuation of the uptrend.
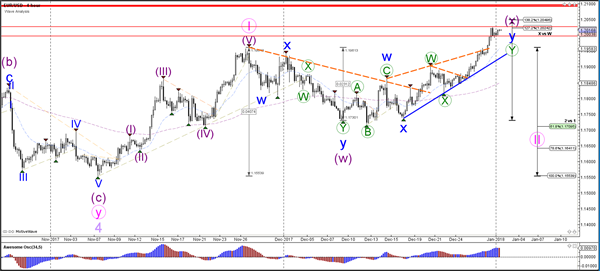
The EUR/USD broke above the resistance trend lines (dotted orange) of the rising wedge chart pattern. Price is now testing the Fibonacci levels of wave X (orange).
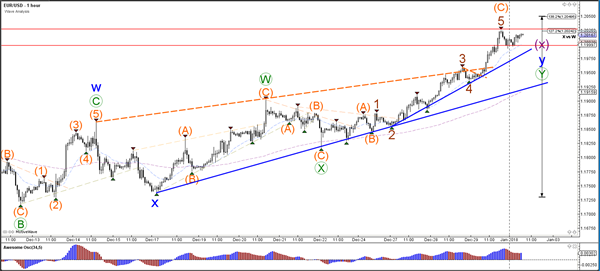
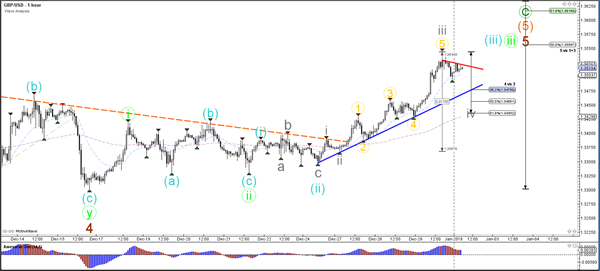
Currency pair GBP/USD
The GBP/USD is challenging the previous top (red) which could be a resistance point. A bullish break could see price move towards the Fibonacci targets of waves 5, which seems to be part of a wave 5 (brown) within wave C (green).
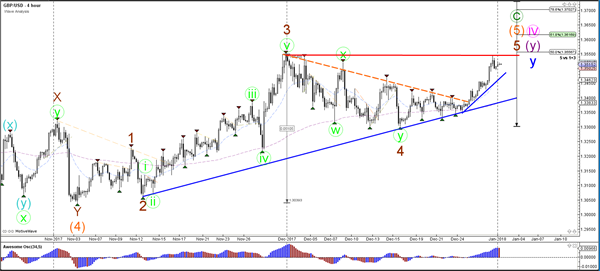
The GBP/USD seems to have completed an internal 5 wave (grey) pattern within a larger wave 3 (blue/green). A bearish retracement could occur as part of wave 4 (grey) but a break below the 61.8% Fib would make a wave 4 (grey) less likely.
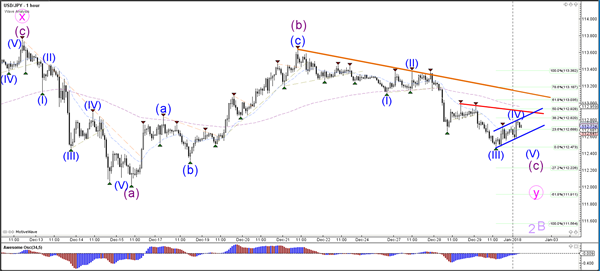
Currency pair USD/JPY
The USD/JPY bearish price action has broken below a larger support trend line (dotted blue), which could be part of a larger bearish wave C (purple) correction within wave 2 or B (light purple).
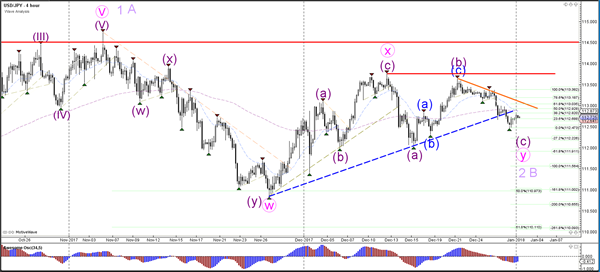
The USD/JPY is building a bear flag chart pattern (blue lines) which could be part of a wave 4 (blue) correction. A bearish break of the flag could see price fall towards the Fib targets of wave 5.
Elliott Wave View: Nasdaq Correcting Cycle From 6232.3 Low
Nasdaq Short Term Elliott Wave view suggests that the Index is correcting the rally from 12/5 low (6232.3). While dips remain above Intermediate wave (4) at 6232.3, expect Index to extend higher. Rally from Intermediate wave (4) low unfolded as a double three Elliott Wave structure where Minor wave W ended at 6545.75 and Minor wave X is in progress towards 6335.64 - 6362.85 green box area before the rally resumes. Internal of Minor wave W unfolded as a double three Elliott Wave structure where Minute wave ((w)) ended at 6427.75, Minute wave ((x)) ended at 6383, and Minute wave ((y)) of W ended at 6545.75.
Internal of Minor wave X unfolded as a double three Elliott Wave structure where Minute wave ((w)) ended at 6432.25, Minute wave ((x)) ended at 6477.50, and Minute wave ((y)) of X remains in progress towards 6335.64 - 6362.85. We don't like selling the Index and expect buyers to appear from 6335.64 - 6362.85 green box area for at least a 3 waves bounce as far as pivot at 12/5 low (6232.3) stays intact.
Alternatively, Minor wave X correction from 12/19 peak can take the form of a triple three Elliott Wave structure. In this scenario, minor wave X may have ended already at the last low at 6383.25 and thus Index does not need to make a new low and could have already resumed higher. In any case, we do not like selling any proposed pullback and expect more upside as far as pivot at 6232.3 low stays intact.
Nasdaq 1 Hour Elliott Wave Chart
Slow Start to 2018, Dollar Look Forward to FOMC Minutes, ISM and NFP
The forex markets start rather slowly today as, without any news, traders are staying in holiday mood. Trading could remain subdued today as UK manufacturing PMI is seen as the only market moving event. Nonetheless, US events will take lead later in the week with FOMC minutes, ISM indices and non-farm payrolls featured. Dollar was under tremendous pressure by the end of last year, partly thanks to surging commodity prices. The greenback will need some strong data to give it a life. Otherwise, Dollar index would have a take on 91 key support level within January.
North Korea Kim offer talks with South
North Korea catches much attention in a slow start to 2018. It's leader Kim Jong-Un warned in the new year speech that the country will be "mass producing nuclear missiles for operational deployment" this year. And Kim said there is a "nuclear button" on his desk and warned the US "never start a war" against him or his nation. But Kim also spent a lot of time on improving North-South relationship. He said that "it's about time that the North and the South sit down and seriously discuss how to improve inter-Korean relations by ourselves and dramatically open up." Kim even urged to the officials to "urgently meet" on sending a North Korea delegation to the Winter Olympics.
Kim's comments were taken by some as a test on US-South Korea alliance. But for now, nothing has changed yet. South Korean President Moon Jae-In responded today and said "the improvement of relations between North and South Korea cannot go separately with resolving North Korea's nuclear program, so the foreign ministry should coordinate closely with allies and the international community regarding this,"
China Caixin PMI manufacturing improved
China Caixin PMI manufacturing rose to 51.5 in December, up from 50.8 and beat expectation of 50.7. That's the highest level in four months. Zhengsheng Zhong, director of macroeconomic analysis at CEBM Group said in the release that "manufacturing operating conditions improved in December, reinforcing the notion that economic growth has stabilized in 2017 and has even performed better than expected,." However, he also warned of the "downward pressure on growth due to tightening monetary policy and strengthening oversight on local government financing."
For the rest of the day
PMI data will be the major focus. In particular, UK PMI manufacturing is expected to drop to 57.9 in December, down from 58.2. Eurozone will release PMI manufacturing final. Canada and US will also release PMIs.
For the week ahead
US events will be the major focuses in a holiday shortened week. ISM indices and non-farm payrolls will be mostly watched. FOMC minutes will also be scrutinized for how worried are Fed officials on slow inflation. In addition, UK PMI would likely trigger some volatility in Sterling. Canadian Dollar trade will also look into job data to be featured on Friday.
- Wednesday: Swiss manufacturing PMI; German unemployment; UK construction PMI; US construction spending, ISM manufacturing; FOMC minutes
- Thursday: Eurozone PMI services final; UK PMI services, M4, mortgage approvals; US Challenger job cuts, ADP employment, jobless claims; Canada IPPI and RMPI
- Friday: Japan monetary base; Australia trade balance; German retail sales; Eurozone CPI flash, PPI, retail PMI; Swiss foreign currency reserves; Canada employment, trade balance, Ivey PMI; US non-farm payroll, ISM manufacturing, trade balance, factory orders
Economic Indicators Update
| GMT | Ccy | Events | Actual | Forecast | Previous | Revised |
|---|---|---|---|---|---|---|
| 1:45 | CNY | Caixin PMI Manufacturing Dec | 51.5 | 50.7 | 50.8 | |
| 8:45 | EUR | Italy Manufacturing PMI Dec | 58.5 | 58.3 | ||
| 8:50 | EUR | France Manufacturing PMI Dec F | 59.3 | 59.3 | ||
| 8:55 | EUR | Germany Manufacturing PMI Dec F | 63.3 | 63.3 | ||
| 9:00 | EUR | Eurozone Manufacturing PMI Dec F | 60.6 | 60.6 | ||
| 9:30 | GBP | PMI Manufacturing Dec | 57.9 | 58.2 | ||
| 14:30 | CAD | RBC Manufacturing PMI Dec | 54.4 | |||
| 14:45 | USD | US Manufacturing PMI Dec F | 55 | 55 |
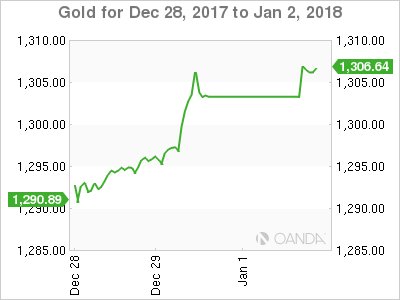
Gold Continues To Defy Sceptics
The street continues to be short and caught in gold as 2018 gets underway.
Gold continues to make more comebacks then Mohammed Ali, confounding critics (myself included) and soaring 11 dollars on Friday to recapture the 1300.00 level and close at its highs near 1305.00. The new three-month high represents a near 70 dollar rally from its mid-December lows near 1135.00.
Two cautionary points must be made though. Well over half of the rally was made in the last week over the holiday period on much lower than normal average daily volumes. Secondly, the Relative Strength Index (RSI) is now at very overbought levels. The RSI has been an excellent indicator of short-term price corrections in 2017.
That said, gold has clearly benefited from lower U.S. yields and a much weaker U.S. dollar into the year-end, and one also suspects, quite a bit of urgent short covering in a thin market. The old adage that the market can stay irrational longer then you can stay solvent appears to be alive and well in the gold market at the moment.
As global complacency over the trajectory of U.S. rates continues to be astoundingly low, precious metals, in general, should continue to benefit. Anti-pollution measures in China squeezing the prices of industrial metals heavily will also continue to provide an indirect boost.
Gold has opened positively in Asia, touching 1308.00 initially before correcting to a still respectable 1306.35. Gold has now traced out at double top at 1308.00, and this should be reasonably strong resistance intra-day. A break will open the road to the mid-September highs of 1314.50. Support is at 1302.00 and 1300.00 followed by 1294.00, Friday’s low.
GBPUSD – Risk Builds Up On 1.3549 Zone
GBPUSD - The pair closed higher the past week opening the door for more strength towards its resistance at 1.3549 zone. Support lies at the 1.3450 level where a break will turn attention to the 1.3400 level. Further down, support lies at the 1.3350 level. Below here will set the stage for more weakness towards the 1.3300 level. Conversely, resistance stands at the 1.3549 levels with a turn above here allowing more strength to build up towards the 1.3600 level. Further out, resistance resides at the 1.3650 level followed by the 1.3700 level. On the whole, GBPUSD looks to strengthen further.
EURUSD – Closes Higher, Eyes Further Upside Pressure
EURUSD - The pair extended its upside pressure the past week opening the door for gain in the new week. On the upside, resistance comes in at 1.2050 level with a cut through here opening the door for more upside towards the 1.2100 level. Further up, resistance lies at the 1.2150 level where a break will expose the 1.2200 level. Its weekly RSI is bullish and pointing higher suggesting further strength. Conversely, support lies at the 1.1950 level where a violation will aim at the 1.1900 level. A break of here will aim at the 1.1850 level. Below here will open the door for more weakness towards the 1.1800. All in all, EURUSD faces further upside pressure
USDCHF – Weakens, Looks To Decline Further
USDCHF - The pair sold off the past week leaving risk lower in the new week. On the downside, support lies at the 0.9700 level. A turn below here will open the door for more weakness towards the 0.9650 level and then the 0.9600 level. On the upside, resistance resides at the 0.9800 level where a break will clear the way for more strength to occur towards the 0.9850 level. Further out, resistance comes in at the 0.9900 level. Above here if seen will turn attention to 0.9950. All in all, USDCHF faces further corrective pullback pressure.