Sample Category Title
GBPUSD Analysis: Trades In Narrow Channel
Thursday's trading session was rather uneventful for British Sterling, as it remained fluctuating between the weekly R1 and the 1.3460 mark for the whole session. This lack of direction changed early today when bulls gathered enough strength for another surge. The pair's upward movement during the past few days has resulted in the formation of a narrow ascending triangle. In case the Pound pushes even higher today as suggested by technical indicators, it could find resistance near 1.35 where the intersection of the 50.0% Fibo retracement and the upper chanel boundary is located. On the other hand, the current steep upward movement might allay in the following hours. A failure to reach the upper channel line is likely to be followed by a breakout and a test of the 55-hour SMA circa 1.3420.
USDJPY Analysis: Points To Recovery
The strong momentum south that was driving the US Dollar early on Thursday stopped when the rate reached the monthly PP at 112.70. It subsequently edged higher, but the breached trend-line provided enough resistance to reverse the pair back south. Converging technical indicators suggest that the Greenback should finally regain some lost positions against the Yen in this session. Thus, the base scenario favours appreciation up to the 113.00 area where the aforementioned trend-line, 50.0% Fibo retracement and the 55–hour SMAs are located. Given that this is the last trading session of 2017, it is unlikely that bulls are able to breach this important resistance. Meanwhile, a fall is not expected in this session; however, the rate could likewise consolidate near the 112.80 mark
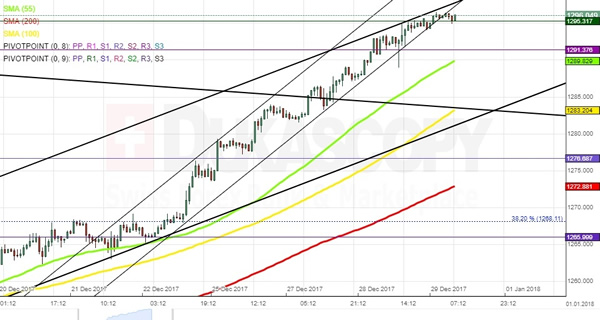
XAUUSD Analysis: Makes Further Advance
Thursday's trading session did not introduce massive changes to the pair's movement, as bulls continued to dominate the yellow metal. As a result, the pair had pushed up to the 1295.32 mark by Friday morning. As apparent on the chart, the steepness of the rate's upward move during the past few days has decreased, resulting in a breakout of the minor ascending channel early this morning. This factor could point to possible weakness. However, if the US Dollar is unable to recover from its recent weakness, Gold is likely to advance even further. The nearest resistance is set by the 23.60% Fibo retracement at 1302.32. Meanwhile, a possible downside target for this session could be the 1290.00 area, as the 55-hour SMA and the weekly R1 are located nearby.
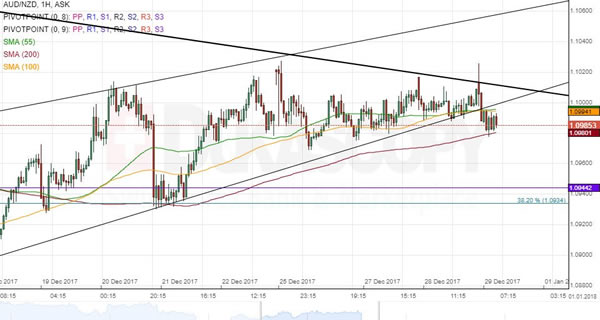
AUD/NZD 1H Chart: Aussie Breaches Wedge
During the last two months, the Australian Dollar has depreciated substantially against the New Zealand Dollar in a channel down pattern. This pair has provided several confirmations on both sides, the latest of which occurred this week. Meanwhile, an ascending wedge can also be spotted on the chart. This pattern, however, was breached early in this session when the rate overcame the support of the 55– and 100-hour SMAs circa 1.10. From theoretical point of view, both patterns should guide the pair lower. However, given that today is the last trading day of 2017, no massive changes to the pair’s price are expected to happen. It might fail to breach the 200-hour SMA at 1.0980 and surrender under the resistance of the aforementioned shorter-term SMAs, thus entering a minor period of consolidation. In case the channel is breached, a surge is likely to follow.
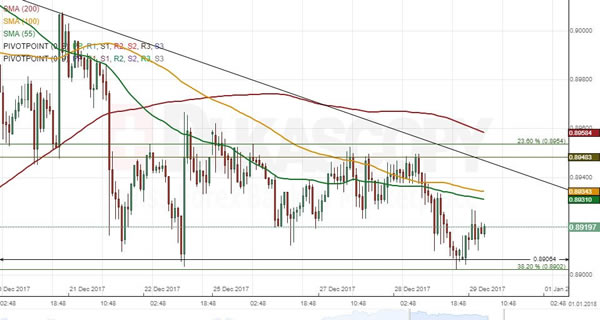
NZD/CAD 1H Chart: Kiwi Stranded In Bullish Triangle
The New Zealand Dollar has been trading in an ascending channel against the Canadian Dollar since mid-November. The upper boundary of this pattern was tested on November 18 that was followed by a new wave down. The Kiwi has stopped near the 0.8906 on various occasions, thus forming a descending triangle. Characteristics of both patterns suggest that the Kiwi should soon enter a period of appreciation. It is likely that the triangle continues to prevail in this session and early on Monday, as the pair has not yet reached the bottom channel boundary located circa 0.89. This trading session is expected to be relatively quiet. Thus, it is unlikely that the combined resistance of the 55– and 100-hour SMAs is breached; the 0.89 area should likewise hold. The base scenario favours strengthening of the Kiwi during next week.
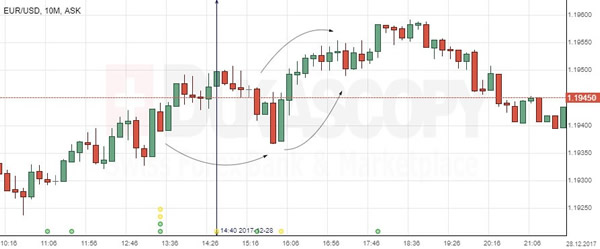
EUR/USD: US Chicago Purchasing Managers’ Index
The US Dollar weakened against the Euro on the US Chicago PMI report, but temporarily changed the direction to touch the 1.1937 mark. The EUR/USD was under less apparent bullish sentiment to continue consolidation at the 1.1945 level.
Factory activity in Chicago strengthened again by the end of the year, according to the MNI survey. Market News International stated that its PMI of manufacturing sector in Chicago jumped to 67.6 in December, after 63.9 reading in the previous month. The survey also showed that businesses were shoring the stock level to support lead times and prepare for next year's product launches. However, the employment rate decreased, but remained higher than in post-crisis times.
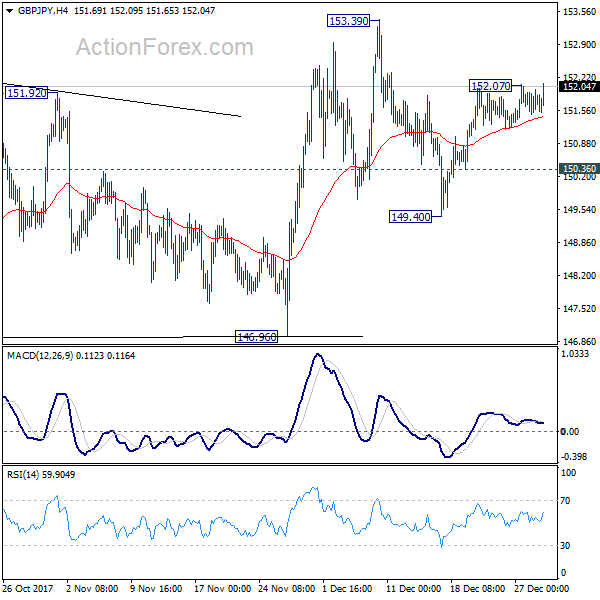
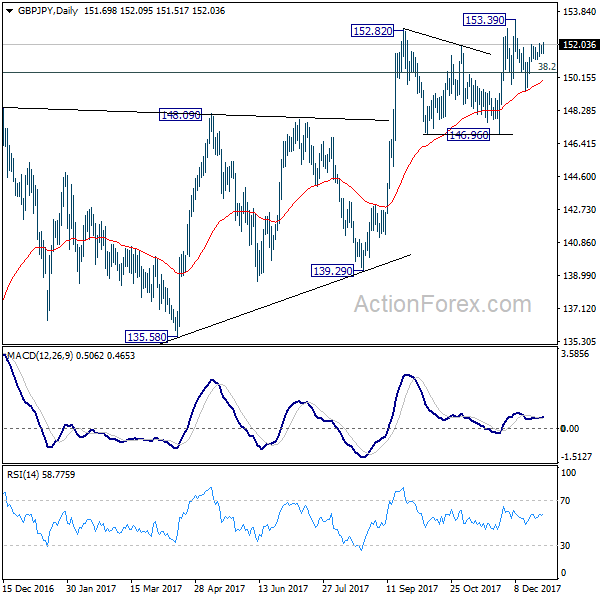
GBP/JPY Daily Outlook
Daily Pivots: (S1) 151.46; (P) 151.72; (R1) 151.95; More...
Breach of 152.07 suggests that GBP/JPY's rebound from 149.40 is resuming. Intraday bias is back on the upside for 153.39 resistance. Break will resume medium term rally. In any case, further rally will remain in favor as long as 150.36 minor support holds.
In the bigger picture, outlook is mixed up a bit with last week's sharp decline. But still, as long as 146.96 key support holds, medium term outlook remains bullish. Rise from 122.36 is in favor to extend to 61.8% retracement of 195.86 to 122.36 at 167.78. However, break of 146.96 support will indicate trend reversal. And the corrective structure of rebound from 122.36 will argue that larger down trend is resuming for a new low below 122.26.
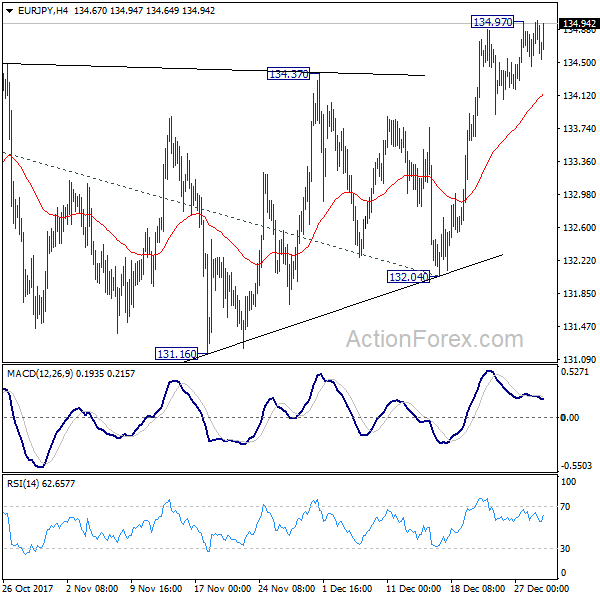
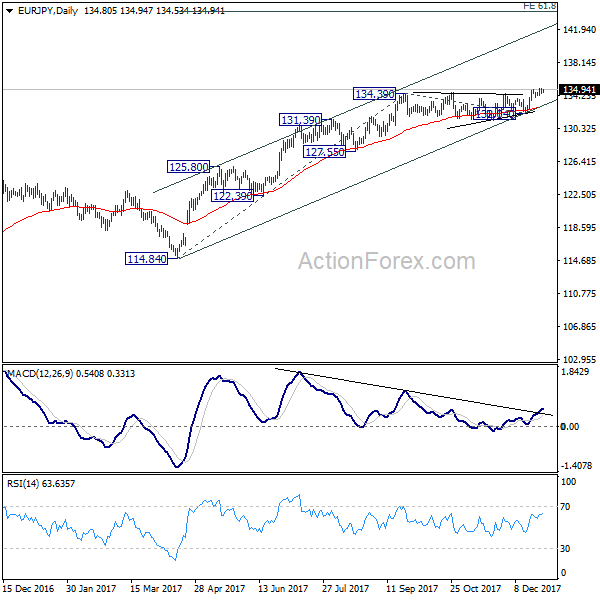
EUR/JPY Daily Outlook
Daily Pivots: (S1) 134.51; (P) 134.74 (R1) 135.03; More....
Intraday bias in EUR/JPY remains neutral at this point. On the upside, firm break of 134.97 will resume medium term rally and target 61.8% projection of 114.84 to 134.39 from 132.04 at 144.12. While another corrective fall cannot be ruled out, near term outlook stays bullish as long as 132.04 support holds.
In the bigger picture, medium term rise from 109.03 (2016 low) is seen as at the same degree as the down trend from 149.76 (2014 high) to 109.03 (2016 low). Sustained break of 61.8% retracement of 149.76 to 109.03 at 134.20 will pave the way to key long term resistance zone at 141.04/149.76. However, break of 132.04 support will suggest medium term topping and will turn outlook bearish for deeper fall back 55 week EMA (now at 127.82).
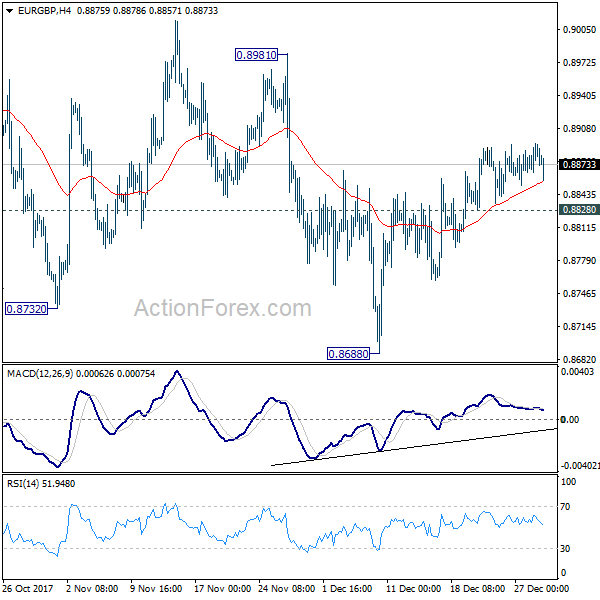
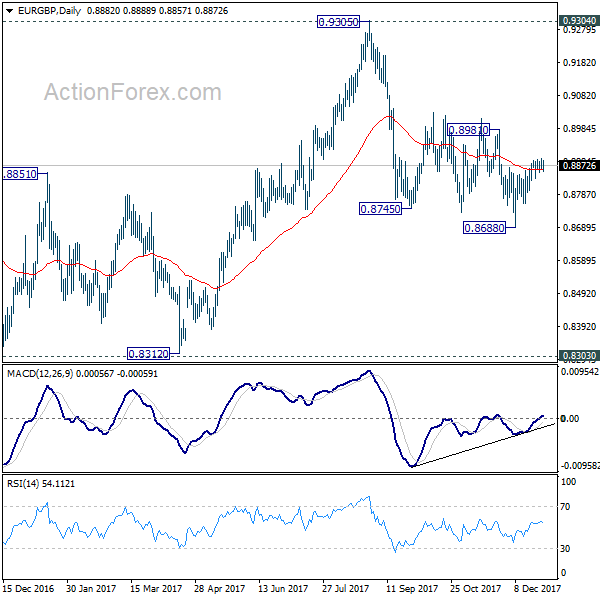
EUR/GBP Daily Outlook
Daily Pivots: (S1) 0.8868; (P) 0.8881; (R1) 0.8895; More...
No change in EUR/GBP's outlook even though upside momentum is weak. With 0.8828 minor support intact, further rise is mildly in favor for 0.8981 resistance. Sustained break there will indicate that whole decline from 0.9305 has completed. In such case, EUR/GBP will target a test on 0.9304/5 key resistance. On the downside, below 0.8828 minor support will turn bias back to the downside for 0.8668 instead.
In the bigger picture, there are various ways to interpret price actions from 0.9304 high. But after all, firm break of 0.9304/5 is needed to confirm up trend resumption. Otherwise, range trading will continue with risk of deeper fall. And in that case, EUR/GBP could have a retest on 0.8303. But we'd expect strong support from 0.8116 cluster support (50% retracement of 0.6935 to 0.9304 at 0.8120) to contain downside.
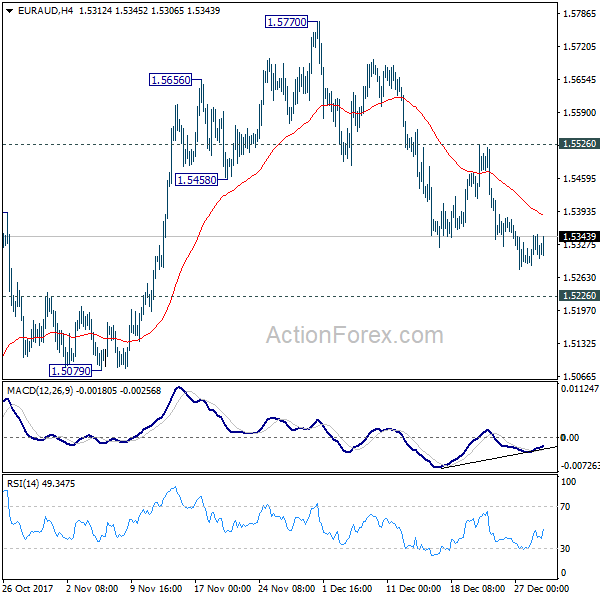
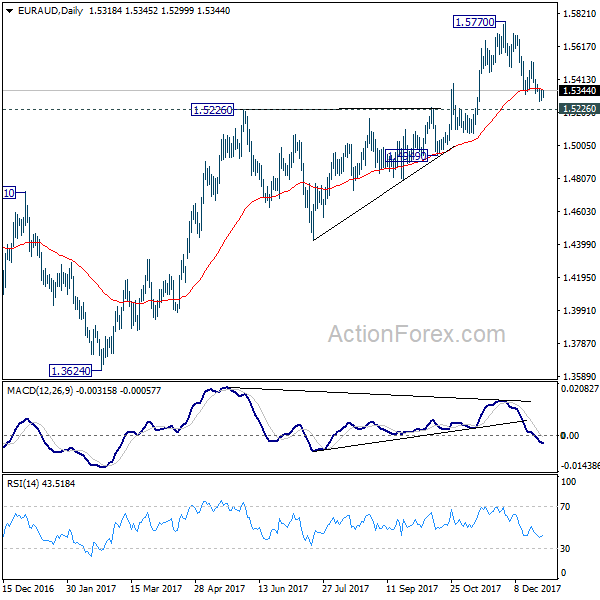
EUR/AUD Daily Outlook
Daily Pivots: (S1) 1.5285; (P) 1.5316; (R1) 1.5345; More....
No change in EUR/AUD's outlook. Further decline cannot be ruled out yet. But fall from 1.5770 is seen as a correction. And outlook will stay bullish as long as 1.5226 resistance turned support holds. Break of 1.5526 minor resistance will indicate that the correction has completed. And, intraday bias will be turned back to the upside for retesting 1.5770. However, sustained break of 1.5226 will indicate larger reversal and target 1.4949 support next.
In the bigger picture, we're holding on to the view that corrective decline from 1.6587 medium term top (2015 high) has completed at 1.3624. Rise from 1.3624 is expected to extend to retest 1.6587. We'll hold on to this bullish view as long as 1.5226 resistance turned support holds. Firm break of 1.6587 will resume long term rise from 1.1602 (2012 low). However, sustained break of 1.5226 will indicate trend reversal and target 1.3624 again.