Sample Category Title
EUR/CHF Daily Outlook
Daily Pivots: (S1) 1.1665; (P) 1.1701; (R1) 1.1721; More...
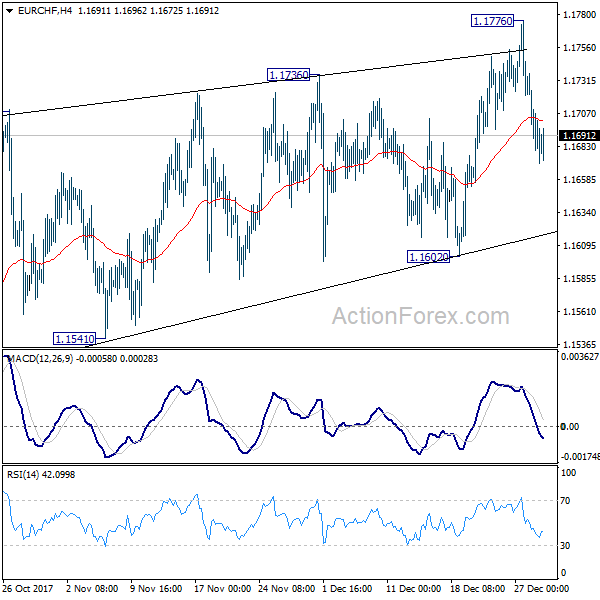
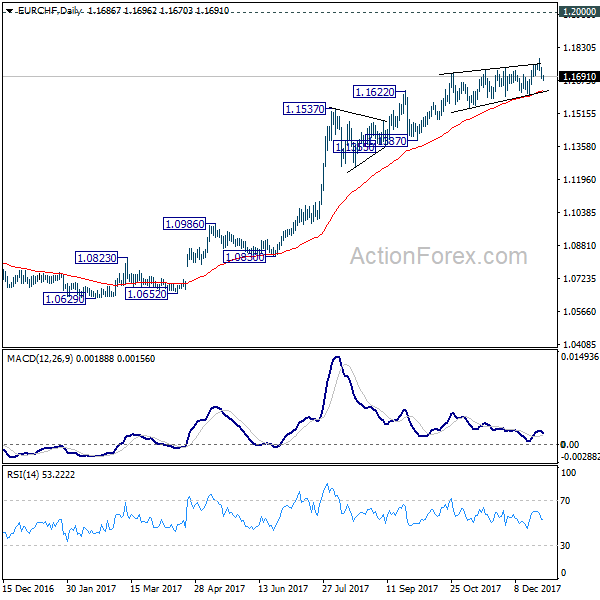
Intraday bias in EUR/CHF remains neutral at this point. We'd maintain that it's close to topping. And in case of another rise, strong resistance should be seen well below 1.2 handle to bring medium term reversal. On the downside, break of 1.1602 support will indicate reversal and turn outlook bearish for 1.1387 and below.
In the bigger picture, while a medium term top could be around the corner, there is no change in the larger outlook. That is, long term rise from SNB spike low back in 2015 is still in progress and would extend. As long as 1.1198 resistance turned support holds, we'll hold on to this bullish view and expect another to prior SNB imposed floor at 1.2000. Though, we'll reassess the outlook if 1.1198 is firmly taken out.
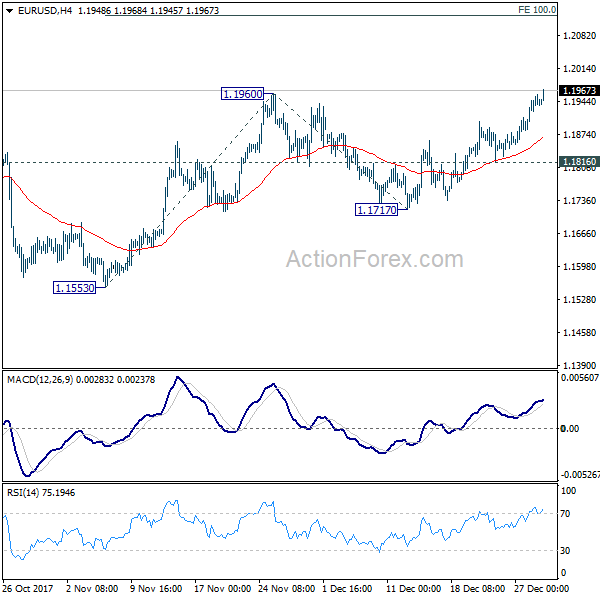
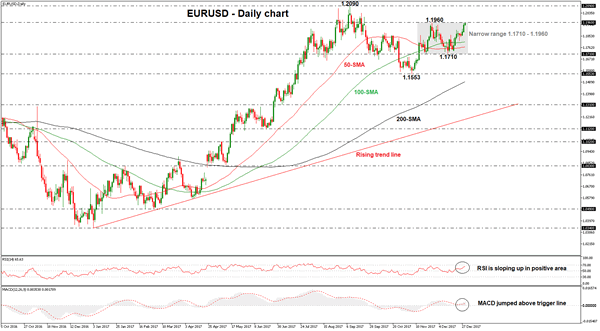
EURUSD Extends Its Gains, Prints 1-Month High Near 1.1960
EURUSD is posting a strong bullish rally over the last two trading days and reached a fresh one-month high of 1.1968 during today’s European morning session. In the short- to medium-term timeframe, the price is consolidating within a one-month narrow range with an upper boundary the 1.1960 resistance level and a lower boundary the 1.1710 support level. Now looks increasingly likely that the pair would extend its gains above the upper bound of its range.
If the price successfully surpasses the aforementioned obstacle could open the way for the 1.2090 resistance barrier, which hit last September and reflects an almost a three-year high. On the flip side, if traders fail to drive the price higher, a downside movement is expected towards the 1.1710 level.
Turning to the technical indicators, in the same short-term chart, the RSI and the MACD are painting a positive picture in the short term. The Relative Strength Index (RSI) is moving slightly below the overbought zone and is strengthening its momentum, whilst the MACD oscillator is currently above its trigger line.
Looking on the weekly timeframe, the world’s most traded currency pair is ready to record the second bullish week in a row.
NZDUSD Intraday Analysis
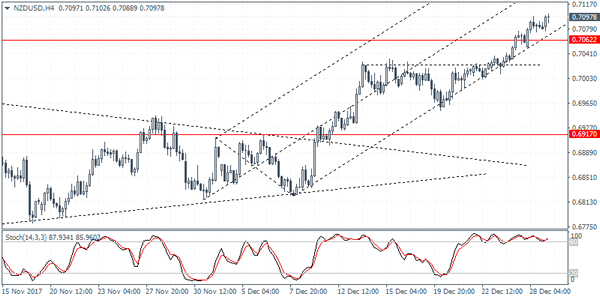
NZDUSD (0.7097): The New Zealand dollar managed to post a convincing close above 0.7062 level yesterday. Price action is expected to continue to the upside as it approaches the 0.71 handle. In the near term, the declines could be seen limited to the 0.7062 level which could now be tested as support. However, lower support at 0.7023 could also be tested following the breakout from this level and price action is still pending a retest of support at this level
USDJPY Intraday Analysis
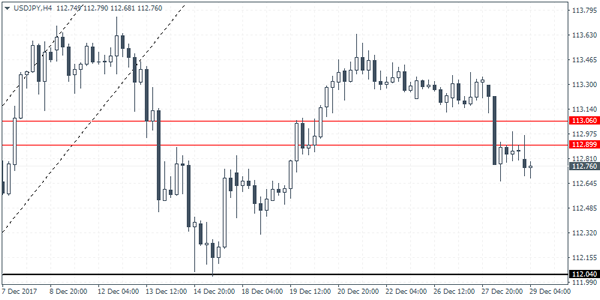
USDJPY (112.76): The USDJPY extended the declines yesterday as price action closed strongly below the support level of 113.00 region. The decline below this level signals further downside in USDJPY which could see price action extending the declines to the 112.00 level. In the near term, USDJPY could be seen consolidating near the 113.00 area as price could briefly retest the resistance level ahead of the declines to 112.00. In the event that USDJPY manages to close back higher above this level, then further gains can come by only if the U.S. dollar manages to establish support here.
EURUSD Intraday Analysis
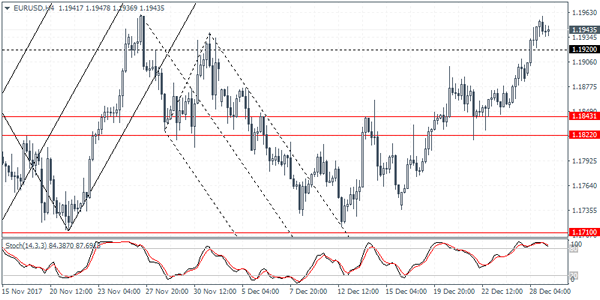
EURUSD (1.1943): The EURUSD rallied to briefly test the 1.1954 handle before slightly retreating back. The currency pair managed to close at a 3-month high at 1.1941. The gains came amid a weaker U.S. dollar. On the 4-hour session, the currency pair was seen closing above the 1.1920 handle which could now come in as support. Establishing support at this previous resistance level is likely to signal further gains in the near term. However, this comes at a risk that the currency pair might close below the level in which case the sideways momentum could still be maintained. The next lower support comes in at 1.1843 - 1.1822 level.
Greenback Declines To A 3-Month Low
The U.S. dollar extended declines, falling to a three-month low led by many factors including end of year balancing from portfolio managers. The decline in the greenback led the commodity markets to maintain the gains. Gold prices continued to extend the rally, rising to $1294 an ounce.
Crude oil prices also held up stronger as the EIA's crude oil inventory report showed that stockpiles declines 4.6 million barrels during the previous week which was more than expected.
On the economic front, the weekly unemployment claims rose 245k more than the expected 240k while the Chicago PMI was seen rising to 67.2 compared to estimates of 62.2 and up from 63.9 previously.
Looking ahead, the economic calendar is quiet today. From the Eurozone the preliminary inflation details from Germany and Spain will be released today.
Daily Wave Analysis: EUR/USD Approaches 1.20, GBP/USD At 1.35 Resistance
Currency pair GBP/USD
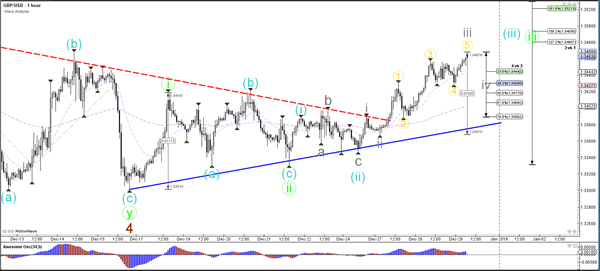
The GBP/USD bullish break is still moving higher and could see price move towards the Fibonacci targets of waves 5. The uptrend seems to be part of a wave 5 (brown) within wave C (green).
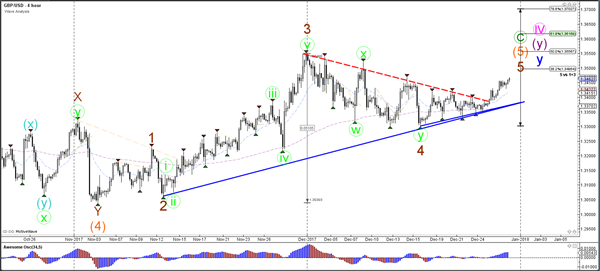
The GBP/USD seems to be building an internal 5 wave (grey) pattern within a larger wave 3 (blue/green) breakout. A bearish retracement could occur as part of wave 4 (grey) but price could some time before the correction is completed. A break below the 61.8% Fib would make a wave 4 (grey) less likely.
Currency pair EUR/USD
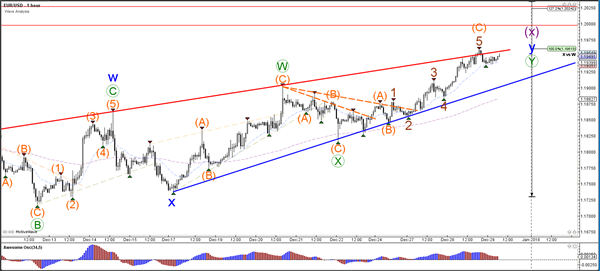
The EUR/USD has reached the strong resistance zone (red lines) and is building a rising wedge chart pattern (red/blue lines). A bearish reversal could send the EUR/USD lower to test the wave 2 vs 1 (pink) and the Fib levels of wave Y (purple) whereas a bullish breakout could indicate a continuation of the uptrend.
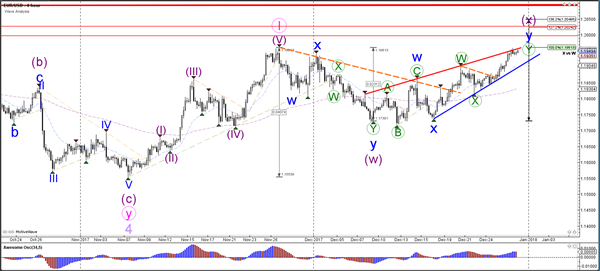
The EUR/USD is testing the resistance trend line (red) and the Fibonacci levels of wave Y (orange) of the rising wedge pattern.
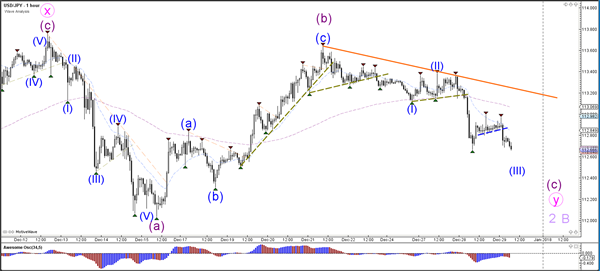
Currency pair USD/JPY
The USD/JPY bearish price action is now challenging a larger support trend line. A break below the support trend line (blue) could indicate a larger bearish wave C (purple) correction within wave 2 or B (light purple).
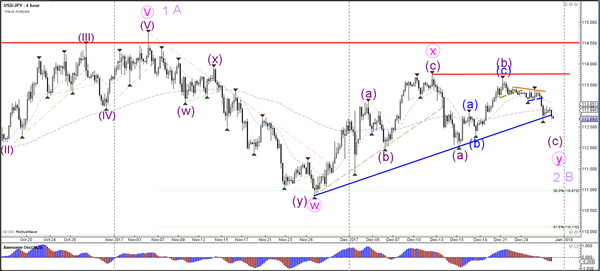
The USD/JPY bearish breakout could see price retest the support levels around 112.
Forex Technical Analysis: EUR/USD, USD/JPY, GBP/USD
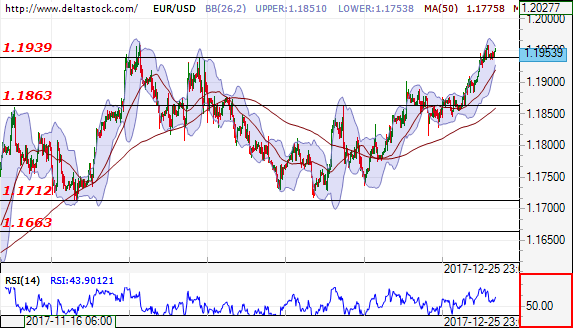
EUR/USD
Current level - 1.1953
The outlook is still positive after the successful breakthrough of the resistance level at 1.1939, for a new test of the next resistance at 1.2033. In negative direction a successful break of the support level at 1.1939, may lead to downtrend and test at 1.1863.
| Resistance | Support | ||
| intraday | intraweek | intraday | intraweek |
|
1.2033 |
1.2033 |
1.1939 |
1.1712 |
|
1.2033 |
1.2090 |
1.1863 |
1.1663 |
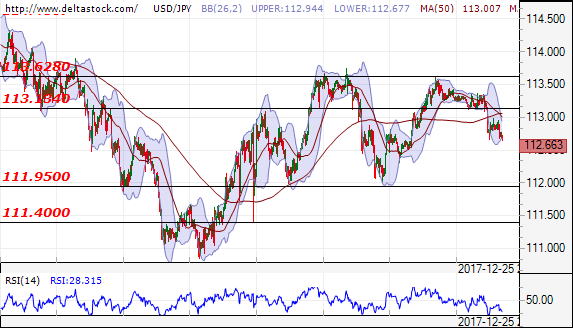
USD/JPY
Current level - 112.663
The downtrend is still intact for test of the support level at 111.95. In positive direction only a breakthrough at 113.13, may lead to the level at 113.62.
| Resistance | Support | ||
| intraday | intraweek | intraday | intraweek |
|
113.13 |
114.48 |
111.95 |
109.50 |
|
113.62 |
114.48 |
110.81 |
107.30 |
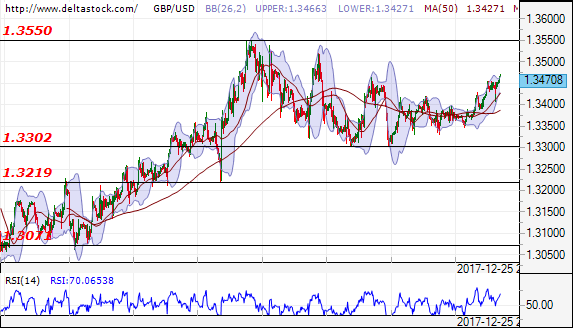
GBP/USD
Current level - 1.3470
The uptrend is still positive for a test of the resistance level at 1.3550. In negative direction the support level will be at 1.3300.
| Resistance | Support | ||
| intraday | intraweek | intraday | intraweek |
|
1.3550 |
1.3660 |
1.3302 |
1.3220 |
|
1.3550 |
1.3660 |
1.3220 |
1.3070 |
Dollar Hits Fresh One-Month Low, Oil Rises To Highest Since Mid-2015
Here are the latest developments in global markets:
FOREX: The dollar traded marginally lower against a basket of major currencies, touching its lowest level since late November.
STOCKS: Japan's Nikkei 225 closed lower, albeit by less than 0.1%, while Hong Kong's Hang Seng was up by nearly 0.3%. Futures tracking the Euro Stoxx 50 were up 0.2%, while those tracking the Dow Jones, S&P 500 and Nasdaq were all higher by roughly 0.1%. The Dow yesterday finished at an all-time high, though its gains were limited as it rose by around 0.3%.
COMMODITIES: WTI and Brent crude were both up by 0.6%, with WTI breaking above the $60/barrel level to touch a fresh more than two-year high, a few hours after the weekly EIA inventory data showed a bigger-than-anticipated drawdown in US crude stockpiles. Gold traded higher, but only marginally so, possibly buoyed by the greenback's ongoing weakness. The precious metal was up 0.05%, at $1295 per ounce. Meanwhile, copper continued to extend its recent gains, though it too did not add much relative to yesterday's close.

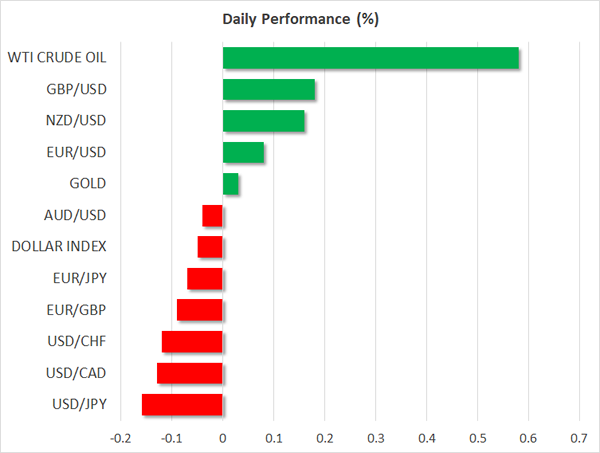
Major movers: Dollar records fresh one-month low; oil reaches highest since June 2015
The US dollar continued to bleed during Friday's Asian trading session, with the dollar index currently near 92.5, its lowest point since late-November. Given the absence of any major market news, the greenback's underperformance in the past days may be owed primarily to end-of-year flows as major funds liquidate the remainder of their positions for the year, with the moves possibly exacerbated by thin liquidity conditions.
The US currency also underperformed its European and Japanese counterparts. Euro/dollar traded 0.1% higher to touch the 1.1958 level before pulling back slightly. Meanwhile, dollar/yen is almost 0.2% lower, currently trading near 112.64.
The Canadian dollar extended its latest gains as WTI oil prices surged further to touch levels last seen in 2015. Higher oil prices are perceived as a bullish factor for the loonie, considering Canada's status as a major oil exporter. Dollar/loonie was down 0.1% in Asian trading Friday, after having dropped notably on Thursday. The pair is currently trading a few pips above the 1.2550 zone and if the bears prove strong enough to break below that hurdle, they could aim for the next major support territory at the crossroads of the 1.2470 level and the 23.6 Fibonacci retracement of the May 5 – September 8 collapse.
As for the rest of the commodity-linked currencies, aussie/dollar was marginally lower despite the advances in copper prices. On the other hand, kiwi/dollar caught a bid, trading nearly 0.2% higher. It is worthy to note that both pairs are trading near 2-month highs, boosted in recent days by the dollar's softness and the gains in commodity prices in general.
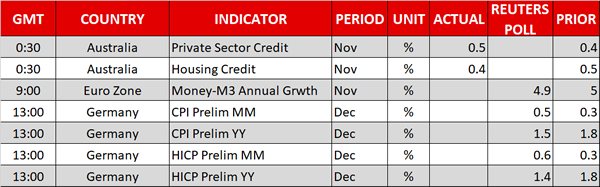
Day ahead: Quiet day with German inflation numbers attracting some attention
It will be an extremely quiet day in terms of releases out of major economies, with inflation data out of the eurozone's – as well as Europe's – largest economy being the only release expected to generate some investor interest.
Preliminary December CPI figures out of Germany are forecast to accelerate on a monthly basis relative to November and decelerate on an annual basis. The harmonized figures (HICP), which facilitate comparisons between EU nations, are projected to behave in a similar manner, i.e. grow at a faster pace month-on-month and at a slower one year-on-year.
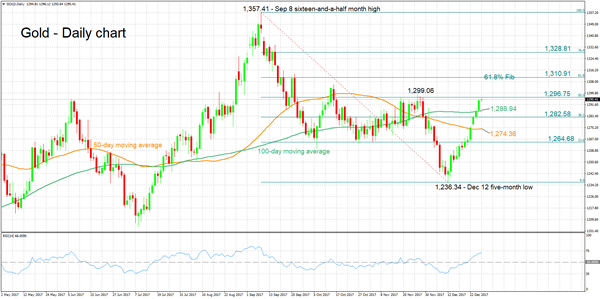
Technical Analysis: Gold short-term bullish; records fresh one-month high
Gold hit a fresh one-month high of 1,296.12 during today's trading after finishing higher in the six preceding trading days. The precious metal is bullish in the short-term, with the RSI supporting this view: the indicator has been rising in recent days and currently maintains a positive slope. Notice though that it is edging closer to the 70 overbought level; it is currently at 66.
The dollar-denominated metal has been gaining on the back of dollar weakness as of late and a catalyst driving the dollar higher could lead to falling gold prices. In such an event, the yellow metal might find support around the current level of the 100-day moving average at 1,286.94. Additional support to steeper declines could come around the 38.2% Fibonacci mark of the September 8 to December 12 downleg at 1,282.58.
On the upside and should gold continue advancing, resistance could be met around the 50% Fibonacci level at 1,296.75. Notice that the area around this point also encapsulates a top from the recent past (November 27's 2-½-month high of 1,299.06) as well as being close to the 1,300 handle, this being a potential psychological level. Also bear in mind that the price is currently in proximity to the 50% Fibonacci mark. Further above, the focus would shift to the 61.8% Fibonacci level at 1,310.91 as an additional barrier to the upside.
EUR/USD Daily Outlook
Daily Pivots: (S1) 1.1904; (P) 1.1931 (R1) 1.1970; More....
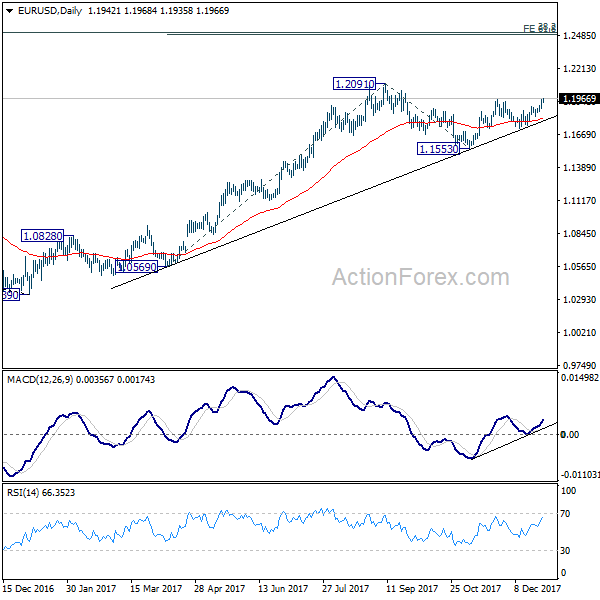
EUR/USD's break of 1.1960 resistance suggests resumption of rise from 1.1553. Intraday bias stays on the upside for 100% projection of 1.1553 to 1.1960 from 1.1717 at 1.2124, which is above 1.2091 high. On the downside, break of 1.1816 support is needed to be first sign of completion of the rally. Otherwise, near term outlook will remains bullish in case of retreat.
In the bigger picture, rise from 1.0339 medium term bottom is seen as a corrective move for the moment. Therefore, in case of another rally, we'd be expect 38.2% retracement of 1.6039 (2008 high) to 1.0339 (2017 low) at 1.2516 to limit upside and bring reversal. That is also close to 61.8% projection of 1.0569 to 1.2091 from 1.1553 at 1.2494.