Sample Category Title
USD/CHF Candlesticks and Ichimoku Analysis
Weekly
• Last Candlesticks pattern: Shooting star
• Time of formation: 7 Mar 2017
• Trend bias: Sideways
Daily
• Last Candlesticks pattern: Morning star
• Time of formation: 9 May 2017
• Trend bias: Near term up
USD/CHF – 0.9859
The greenback only slipped to as low as 0.9735 last week before staging the anticipated rebound (we recommended in our previous update to buy at 0.9730 and just missed our long entry), suggesting consolidation above this level would be seen and test of the Kijun-Sen (now at 0.9887) is likely, however, a sustained breach above this level is needed to signal low has been formed there, bring a stronger rebound to 0.9950-55, once this level is penetrated, this would signal the fall from 1.0039 has ended at 0.9735, bring test of indicated resistance at 1.0018, above there would provide confirmation and bring retest of this level first.
On the downside, expect pullback to be limited to 0.9800-10 and bring another rebound to aforesaid upside targets. Only a drop below said support at 0.9735 would abort and signal top has been formed at 1.0039 earlier, bring retracement of recent upmove from 0.9421 to minor support at 0.9670, then 0.9642 (another support) but reckon downside would be limited to 0.9590-00 and support at 0.9565 should remain intact.
Recommendation: Buy at 0.9810 for 1.0000 with stop below 0.9730.
On the weekly chart, although dollar fell to as low as 0.9735 late last week, the greenback found decent demand there and has staged a strong rebound, the pair opened higher this week and test of resistance at 0.9882 is likely break there would extend gain to 0.9947-50 but a weekly close above there is needed to signal the pullback from 1.0039 has ended, bring a test of 0.9987, break there would signal upmove has resumed for retest of 1.0039, above there would extend the rise from 0.9421 low to previous resistance at 1.0100-08, having said that, overbought condition should prevent sharp move beyond previous resistance at 1.0171 and 1.0200-10 should hold from here.
On the downside, although initial pullback to 0.9800-10 cannot be ruled out, price should stay well above support at 0.9730-35 and bring another rise later. A weekly close below there would defer and signal top is formed instead, this also suggest first leg of rebound from 0.9737 has ended and bring weakness to 0.9690-00, however, reckon support at 0.9642 would limit downside and price should stay above support at 0.9565 and the greenback shall stage another strong rebound next month.
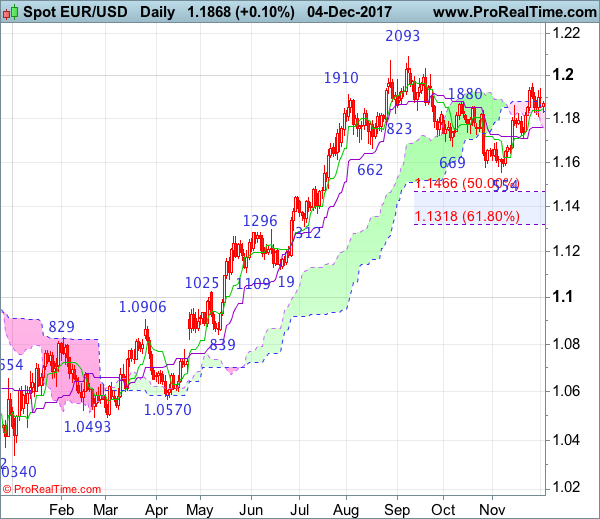
EUR/USD Analysis: Still Trades Near 1.1870
Despite positive sentiment related to successful vote on tax bill by the US Senate, the pair both started and ended the day near the 1.1870 mark. The reason for that is related to combined resistance formed by the 55-, 100- and 200-hour SMAs and support provided by the lower trend-line of a one-month long ascending channel. Unless the rate receives an impulse from some fundamental event, such as the Non-Manufacturing PMI data release, it is likely to spend another day in a similar horizontal movement. Apart from that, there is a need to take into account two additional junior descending channels. It is highly possible that their framework taken together with the above technical indicators will create a bearish pressure strong enough to dissolute the ascending channel eventually.
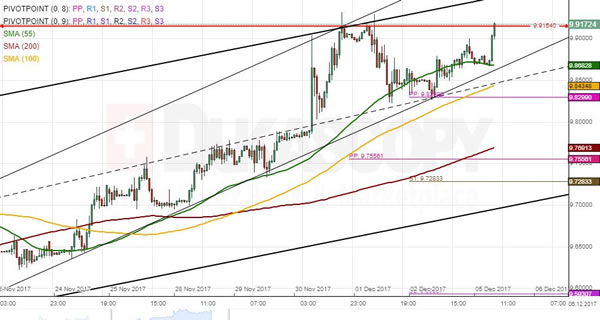
EUR/NOK 1H Chart: Euro Points To Weakness
The common European currency has been appreciating against the Norwegian Krone in an ascending since late September. This pattern has guided the pair up to the 9.9154 mark—its highest level during the past several years. Apart from this channel, the pair is likewise trading in a junior one valid since November 21. Its slope is relatively steep; however, as apparent on the chart, the Euro has failed to initiate a solid wave up. This might suggest that a change in the bullish sentiment might occur soon. This assumption is likewise supported by technical indicators. In terms of support, the pair might hinder near the 9.75 area near where the monthly PP, the 200-hour SMA and the weekly S1 are located.
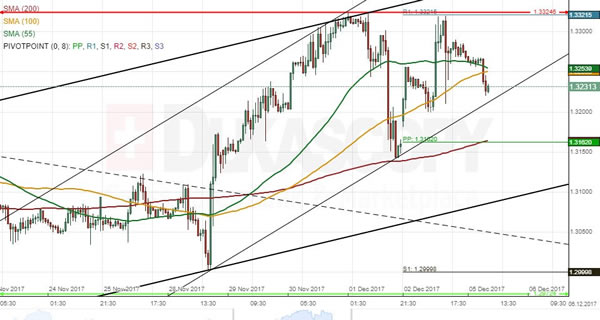
GBP/CHF 1H Chart: Pair Tests 2017 High
Following a steady increase in price since late August, GBP/CHF has entered a six-week period of consolidation. As a result, the Pound has been fluctuating against the Swiss Franc in the 1.3325/1.2972 range. The pair tested the former barrier two times during the past two trading sessions. Technical indicators suggest that the same scenario might occur today, as well. However, given that this level is a 2017 high, it might provide strong resistance, especially when reinforced by the weekly R1. Conversely, it is also possible that the Pound falls down to the weekly PP and the 200-hour SMA circa 1.3160 prior to re-testing the aforementioned high. By and large, it is expected that the pair moves lower in the medium term, possibly down to the 1.2972 area.
GBP/USD: UK Construction PMI
The British Pound was slightly higher against the US Dollar on the release showing stronger activity in the country's construction sector. The GBP/USD added 8 base points to keep appreciating up to the 1.3500 level, though the pair was hit strongly as the BBC said not to anticipate deal to be reached from Brexit negotiations on Monday.
Housebuilding in the UK stimulated activity in the country's construction industry in November, compensating weakness in other parts of mostly downbeat sector. The IHS Markit/CIPS said that the Britain's Construction PMI reached the highest level in five months of 53.1 in the reported month, entirely driven by the residential projects, while civil and commercial engineering activity kept contracting.
AUD/USD: Australian Retail Sales, RBA Interest Rate Decision
The Aussie was under stronger bullish sentiment against the Greenback on early Tuesday reports. The AUD/USD currency pair added 14 base points initially after the country's retial sales report and managed to sustain gains, as the RBA announced its rate decision.
The Australain Bureau of Statistics reported that the country's retail sales rose at a stronger-than-expected pace of 0.5% in October, following an upwardly revised 0.1% gain in the prior month. The most of contribution came from a stronger sales in eating out and clothing sectors. Later, the Reserve Bank of Australia stated that it kept its key interest rate unchanged at the historical low of 1.50%. The next move in the pair would be determined by the substantial GDP report on Wednesday.
Aussie Boosted By Retail Sales While Tech Selloff Spreads To Asia
Here are the latest developments in global markets:
FOREX: The RBA held rates unchanged on early Tuesdayas expected, but the aussie hit a three-week high following upbeat retail sales figures which pointed to an improved economic outlook. The kiwi also posted a strong rebound, erasing yesterday’s losses after the RBNZ governor said that the central bank had less leverage over inflation. Sterling was on the backfoot as the UK Prime Minister failed to satisfy the EU on Brexit elements, while the dollar inched up versus the yen as investors continued to see positive momentum following the Senate’s passage of the US tax code.
STOCKS: The Nikkei 225 retreated by 0.4% on a day when tech stocks underperformed in Asian equity markets as yesterday’s selloff in the US reverberated into the continent. At 0800 GMT, Euro Stoxx 50 futures were down by 0.1%. Dow futures were higher by 0.2%, S&P 500 contracts traded up by 0.1% and Nasdaq 100 equivalents were unchanged.
COMMODITIES: Oil prices were steady around yesterday’s lows ahead of the API weekly report as investors remained cautious on rising US crude inventories. WTI crude and Brent were last trading at $57.44 and $62.37 per barrel respectively. Gold was flat at $1,275.40 per ounce.
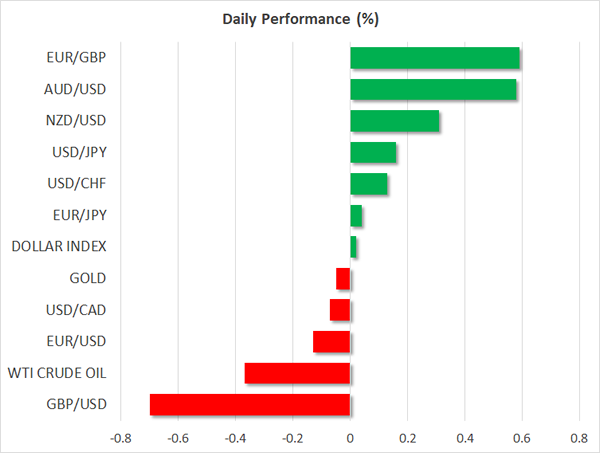
Major movers: Aussie surges on retail sales; pound pressured on Irish border
The RBA decided on Tuesday to leave interest rates steady at a record low of 1.5% for the sixteen-consecutive meeting as expected. The monetary policy statement following the decision was perceived as hawkish by investors as policymakers omitted the phrase “inflation is likely to remain low for some time”, providing some support to the aussie. Moreover, better-than-expected readings on Australian retail sales published prior the RBA statement were good news for the central bank which hopes inflation would pick up and the economic outlook would improve. Retail sales rose by 0.5% m/m in October, surprising analysts who forecasted a growth of 0.3%. September’s mark was also revised upwards from 0.0% m/m to 0.1%. In the wake of the news, the aussie surged to a three-week high of $0.7653 (+0.61% on the day).
The New Zealand dollar followed an uptrend as well towards a session high of $0.6906 (+0.35%), supported by comments delivered by the acting RBNZ governor, Grant Spencer. Spencer said that “In pursuing long-term price stability objective, relatively more weight is being attached to output, employment, and financial stability” due to persistent low import prices – a fact that could reduce chances for further rate cuts.
The pound retreated back to $1.3385 (-0.71%) after progress on Brexit talks was stuck in Brussels, with the UK Prime Minister Theresa May unable to persuade the EU on any positive developments on issue of the Irish border. Euro/pound was 0.61% up at 0.8856.
Dollar/yen gained 0.18%, rising to 112.60 while euro/dollar edged up by 0.12% to 1.1850. The dollar index was flat at 93.19.
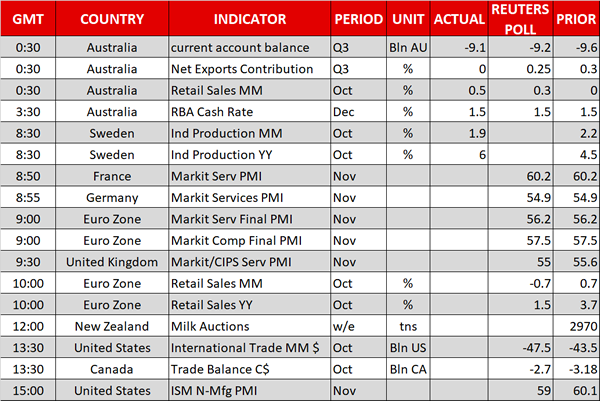
Day ahead: UK services PMI, eurozone retail sales & PMIs, US and Canadian trade data as well as ISM’s services PMI to attract most attention
At 0900 GMT, the eurozone will see the release of November services and composite PMI figures. Those would pertain to their final readings though and are not expected to gather much attention – analysts expect the figures to be released unchanged relative to their flash estimates. One hour later, euro area retail sales for the month of October will be made public. Month-on-month, sales are expected to contract by 0.7% and year-on-year to grow by 1.5% (September’s respective readings stood at 0.7% and 3.7% respectively).
Out of the UK, the November Markit/CIPS services PMI is due at 0930 GMT. The gauge of activity in the UK’s largest sector is forecasted to fall to 55.0 – remaining though comfortably above the 50 threshold that separates contraction from expansion – from October’s 55.6.
The outcome of the global milk auction will be known around 1200 GMT (the release is tentative though, lacking a certain time of release). Major dairy exporter New Zealand and consequently the kiwi will be in focus.
US international trade data and Canada’s trade balance (both for the month of October) will be made public at 1330 GMT. The US will also see the release of ISM’s services PMI for November at 1500 GMT. Activity in the sector is expected to ease with the index falling to 59.0 – still a robust reading – from October’s more than two-year high of 60.1.
API weekly data, including on US crude oil stocks are due at 2135 GMT.
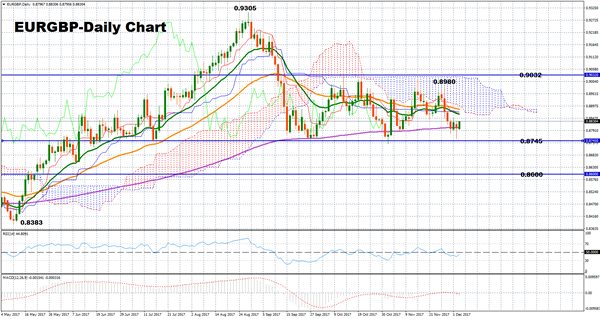
Technical Analysis: EURGBP holds neutral bias in short-term; bearish outlook still in place
EUGBP has been moving sideways between 0.8745-0.9032 since the end of September following a sharp fall from an eight-year peak at 0.9305. In the short-term the bias is looking neutral with the pair looking likely to remain within the current range. The technical indicators also support this view, with the RSI trending marginally below 50 and the MACD being attached to zero.
However, any close below 0.8745 would resume the medium-term downleg starting from 0.9305 and shift focus to the 0.8600 key-level. Deeper falls could also target the seven-month low of 0.8383.
On the upside, immediate resistance could emerge between the 20-day EMA and the 50-day EMA (0.8861-0.8883) before the pair heads up to the upper bound of the range at 0.9032. If this point is broken, the scope would open for a revisit of the eight-year high of 0.9305, turning the bias from neutral to bullish.
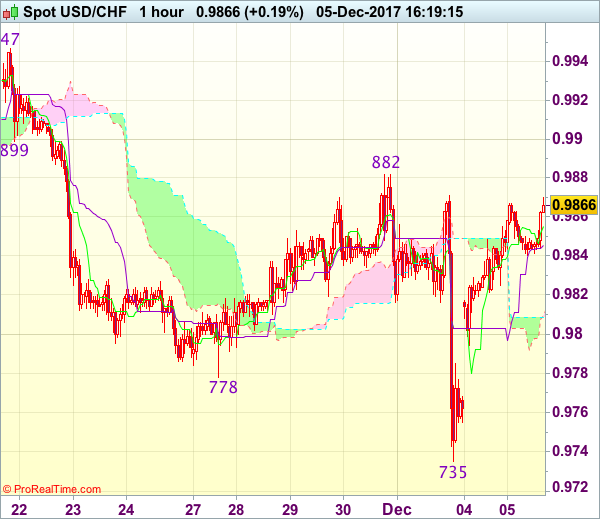
Trade Idea : USD/CHF – Buy at 0.9795
USD/CHF - 0.9859
Most recent candlesticks pattern : N/A
Trend : Near term down
Tenkan-Sen level : 0.9855
Kijun-Sen level : 0.9846
Ichimoku cloud top : 0.9812
Ichimoku cloud bottom : 0.9809
Original strategy :
Buy at 0.9785, Target: 0.9885, Stop: 0.9750
Position : -
Target : -
Stop : -
New strategy :
Buy at 0.9795, Target: 0.9895, Stop: 0.9760
Position : -
Target : -
Stop : -
As the greenback has maintained a firm undertone after staging a strong rebound from 0.9735 (last Friday’s low), adding credence to our view that a temporary low has been formed there and consolidation with upside bias remains for gain to last week’s high at 0.9882, however, a sustained breach above this level is needed to confirm this view and bring at least a retracement of recent decline to 0.9900 and later towards resistance at 0.9947.
In view of this, we are looking to buy dollar on dips as 0.9775-85 should limit downside and bring another rebound. Below 0.9750 would risk a retest of said last week’s low at 0.9735 but only break there would signal the decline from 1.1038 top has resumed for weakness to 0.9705 support.
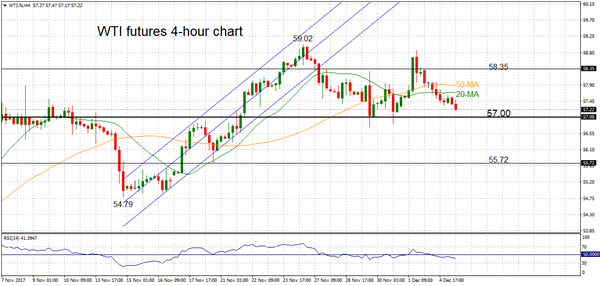
WTI Oil Futures In Bearish Phase But Maintain Medium-Term Neutral Outlook
WTI oil futures have unwound almost all of the gains made from the recent rally off the key 57 level. The near-term bias is to the downside and last Friday’s 58.86 high remains unchallenged.
Technicals are bearish on the 4-hour chart. The market has dropped below the 20 and 50-period moving averages which are negatively aligned. The RSI has fallen below 50.
Prices are expected to grind lower with the next target at the key 57 level. This level has held strong support during the past two weeks, keeping the market neutral in the medium-term. A break below 57 would strengthen the bearish momentum to target previous lows at 55.72 and 54.79.
Only a clear break above 58.35 would open the way for a re-test of the more than two-year high of 59.02. The odds for clearing this peak are low in the near term.
The medium-term neutral outlook is expected to remain in place with more range trading above the 57 base as the market enters a consolidation phase following the rally from 54.79 to 59.02.
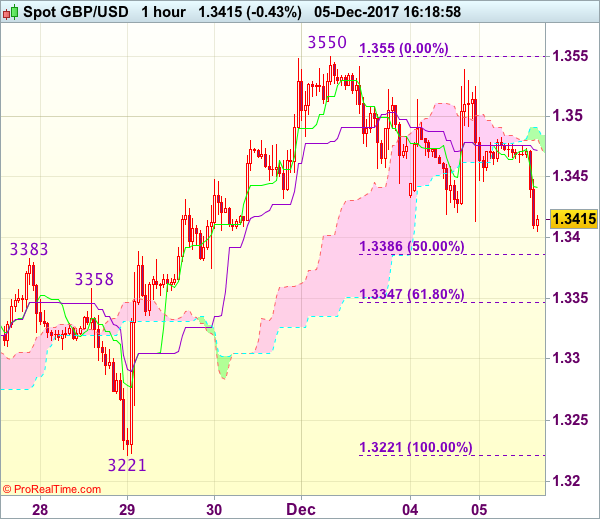
Trade Idea : GBP/USD – Target met and sell at 1.3440
GBP/USD - 1.3392
Most recent candlesticks pattern : N/A
Trend : Near term up
Tenkan-Sen level : 1.3425
Kijun-Sen level : 1.3455
Ichimoku cloud top : 1.3491
Ichimoku cloud bottom : 1.3482
Original strategy :
Sold at 1.3500, met target at 1.3400
Position : - Short at 1.3500
Target : - 1.3400
Stop : -
New strategy :
Sell at 1.3440, Target: 1.3340, Stop: 1.3475
Position : -
Target : -
Stop : -
Current selloff has reinforced our view that top has been formed at 1.3550 and consolidation with downside bias remains for the fall from 1.3550 to bring retracement of recent rise, hence further weakness to 1.3340-50 (61.8% Fibonacci retracement of 1.3221-1.3550) would be seen, however, near term oversold condition should prevent sharp fall below 1.3300 and reckon 1.3260-65 would hold, bring rebound later.
In view of this, we are looking to reinstate short on recovery as 1.3440-50 should limit upside.Above the Kijun-Sen (now at 1.3455) would defer and risk test of resistance at 1.3483 but only break there would signal an intra-day low is formed instead, bring another bounce to 1.3530-35 first.