Sample Category Title
US: Finally, Core Inflation Firms in October
A modest 0.1% increase in October for the headline consumer price index (CPI), saw total inflation ebb slightly to 2.0% year-on-year, from 2.2% in September. October's modest increase is right in line with market expectations.
Energy prices fell 1.0% m/m in October, only partly giving back their hurricane-induced bump-up in August and September. Food prices were unchanged on the month, and are up only 1.3% from twelve months ago.
Core inflation finally gained a step, rising 0.2% in October. That took the year-on-year pace up one tick to 1.8%, after remaining stuck at 1.7% for most of the middle of 2017. The shelter index was a key factor taking core higher, with both rent and owners' equivalent rent firming 0.3% on the month. Increases in core inflation were widespread. Some examples include medical care (+0.3%), used cars and trucks (+0.7%), tobacco (+1.6%), education (0.3%) and wireless phone services (+0.4%).
Finally, both core goods (0.1% m/m) and core services (0.3% m/m) were rowing in the same direction, taking core inflation higher. Core services are now up 2.7% year-on-year, the fastest pace since February. Core goods prices are still down 1% year-on-year, reflecting past strength in the U.S. dollar.
Key Implications
One would expect that in an economy running at a 3% annualized pace over the past two quarters, and an unemployment rate at a 17-year low, that inflation would show signs of picking up. October's inflation data is a tentative step in the right direction after a soft patch through much of 2017 worried many at the FOMC.
Today's report should remove any lingering doubts that the Fed will hike rates in December. From a full-employment standpoint, the argument for rate hikes is strong. But, inflation has been a missing piece for much of the year. Now that it is starting to move into place, we see little to prevent the Fed from moving ahead next month.
US: Retail Sales Continue to Rise in October, Extending the Post-Hurricane Rebound in September
Retail sales rose 0.2% m/m in October, ahead of expectations for a flat reading. The rise follows an upwardly-revised growth of 1.9% m/m in September (previously 1.6%), which was boosted by a rebound in purchases following Hurricanes Harvey and Irma.
Most categories rose in October, with the only major declines experienced by building material stores (-1.2%), gasoline stations (-1.2%), and non-store retailers (-0.3%). Having said that, the decline in sales at gasoline stations was partly a price story, with the price of gasoline pulling-back as the impact of refinery shutdowns waned.
The 'control group' used in calculating GDP (excluding gas, autos, building materials, and food services) was up 0.3% on the month - on par with consensus. Still, it follows an upwardly revised gain of 0.5% in September suggesting more consumption spending during the third quarter.
Key Implications
With upward revisions in September and better-than-expected retail sales growth in October, consumer spending appears likely to increase by around 3% (annualized) in the third quarter. While some of the recent momentum reflects the normalization of activity following the hurricanes, looking through the volatility consumers are likely to continue to a vital support to economic growth through the next year.
Alongside an acceleration in inflation, this report cements the case for the Federal Reserve to raise interest rates in December. Further out, the outlook for rate hikes over the course of 2018 will depend in large part on the stance of fiscal policy. A major tax cut at this stage in the cycle, while giving support to disposable income growth, is likely to be met with additional interest rate hikes by the Federal Reserve. Over the medium term, this will help return the economy to its trend rate of growth around 2.0%.
XAU/USD Analysis: Gold is Pushing Higher
As I have showed in my previous Gold Spot analysis, the price rejected from the POC zone, making a push higher. The price followed the continuation move and now we have another POC formed for possible new bullish swing. If the price stays above 1283.90 we might see a continuation towards 1287.70 and 1288.44. Breakout might happen above 1288.44 towards 1290.37 and 1293.91. However in case of retracement pay attention to 1278.15-1280.05 POC zone as the price might reject towards H3 then. So as long as the price is above D H3 and W H3, the bias is bullish.
- H3 - Weekly Camarilla Pivot (Weekly Interim Resistance)
- W H4 - Weekly Camarilla Pivot (Strong Weekly Resistance)
- D H4 - Daily Camarilla Pivot (Very Strong Daily Resistance)
- D L3 - Daily Camarilla Pivot (Daily Support)
- D L4 - Daily H4 Camarilla (Very Strong Daily Support)
- PPR - Progressive Polynomial Channel
- POC - Point Of Confluence (The zone where we expect price to react aka entry zone)
U.S. Retail Sales Rise in October, Inflation Picks Up
Data this morning shows that U.S consumers increased their spending only slightly in October, a sign that households spend moderated after a hurricane-related bump the previous month.
Sales at restaurants, retail stores and online-shopping platforms rose +0.2% m/m to a seasonally adjusted +$486.55B in October. Compared with a year earlier, sales increased +4.6%.
The market were expecting a +0.1% increase in October.
Digging deeper, sales at gas stations fell -1.2%, likely reflecting pullback from the spike in gas prices after the storms. Motor vehicles and parts dealers had a +0.7% sales increase, compared to a +4.6% increase in September.
Ex-motor vehicles, retail sales were up +0.1% in October, and ex-gas, sales were up +0.4%. Excluding both categories, sales were up +0.3% m/m.
Core U.S inflation finally picks up
The CPI index rose +0.1% in October, in line with markets expectations. The increase was driven largely by higher shelter costs, as food prices were unchanged and energy costs declined.
U.S consumer prices were up +2.0% on the year last month. Core prices were up +0.2% on the month and +1.8% on the year.
Note: That's slightly higher compared to September's reading, when core inflation was up +1.7% y/y - it's the strongest in six months.
Empire manufacturing index disappoints
Other data shows that business activity continued to grow strongly in New York State.
The Empire manufacturing index headline general business conditions index fell -11 points from the multiyear high (30.2) it reached last month, it remained firmly in positive territory at 19.4.
The new orders index climbed to 20.7 and the shipments index came in at 18.4 - readings that pointed to ongoing solid gains in orders and shipments.
Market reaction
U.S Treasuries have held onto their overnight gains after consumer prices rose only slightly.
The yield on U.S 10-year note is trading at +2.331%. The market was looking for a stronger-than-expected inflation reading that would of solidified the Fed's case to raise rates at next month's meeting. This morning's data has done little to suggest acceleration in inflation that might pose a threat to bond prices.
The USD remains on the back foot on investor concerns over the U.S tax reform proposal losing momentum.
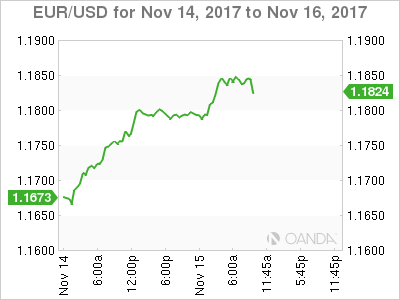
EUR/USD Mid-Day Outlook
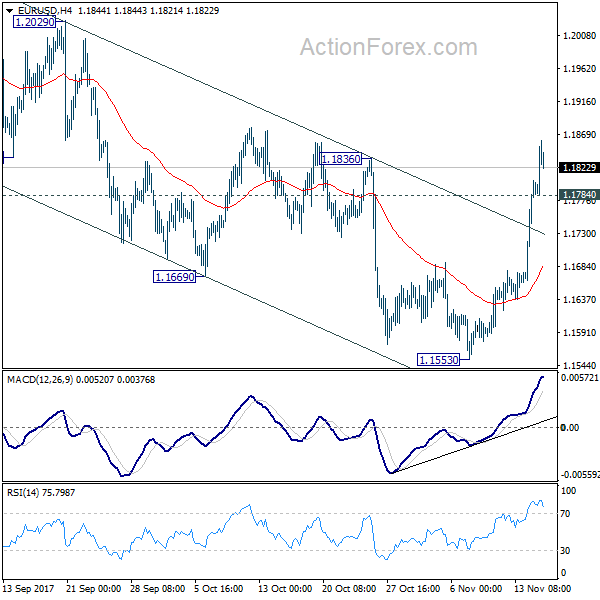
Daily Pivots: (S1) 1.1704; (P) 1.1754 (R1) 1.1848; More...
EUR/USD's rise from 1.1553 is still in progress. The break of 1.1836 resistance should confirm our bullish view. That is, correction from 1.2091 has completed at 1.1553 already. Further rally would be seen to retest 1.2091 high. On the downside, below 1.1784 minor support will bring consolidations before staging another rally.
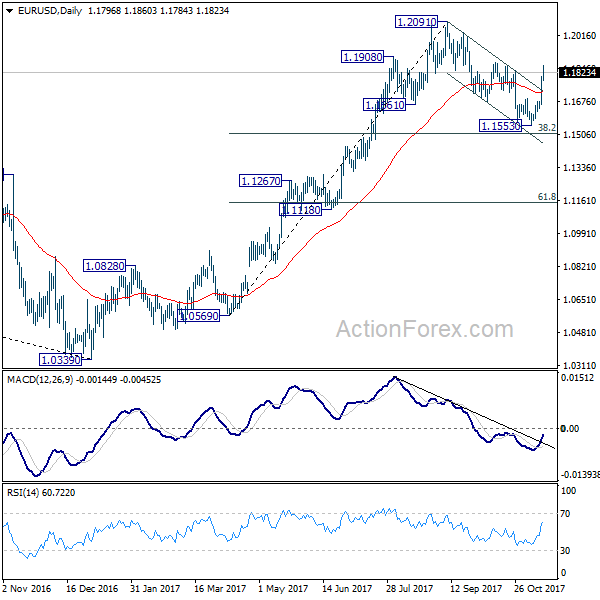
In the bigger picture, rise from 1.0339 medium term bottom is seen as a corrective move for the moment. Therefore, in case of another rally, we'd be cautious on 38.2% retracement of 1.6039 (2008 high) to 1.0339 (2017 low) at 1.2516 to limit upside and bring reversal. Meanwhile, sustained trading below 55 week EMA (now at 1.1346) will suggest that such medium term rebound is completed and could then bring retest of 1.0339 low.
USD/CHF Mid-Day Outlook
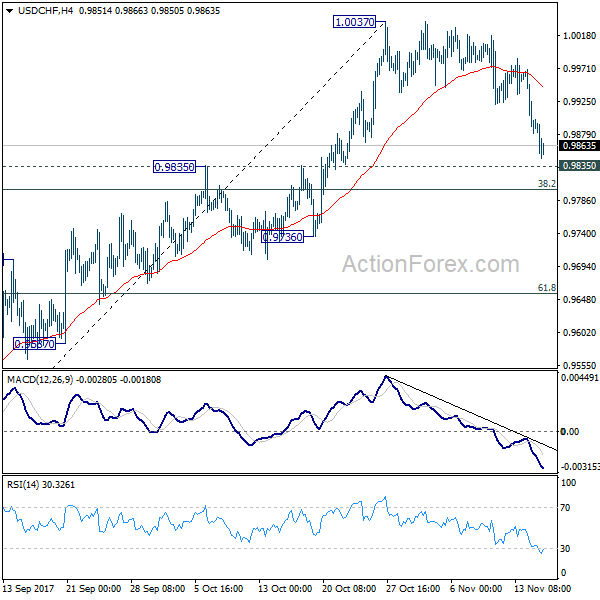
Daily Pivots: (S1) 0.9860; (P) 0.9915; (R1) 0.9949; More....
As the fall from 1.0037 extends, focus is now on 0.9835 resistance turned support. Decisive break there will argue that whole rebound form 0.9420 is completed and turn outlook bearish. In that case, USD/CHF should target 61.8% retracement of 0.9420 to 1.0037 at 0.9565 and possibly below. Nonetheless strong rebound from 0.9835 will retain near term bullishness. And, break of 1.0047 will extend the rise from 0.9420 and target 1.0342 high.
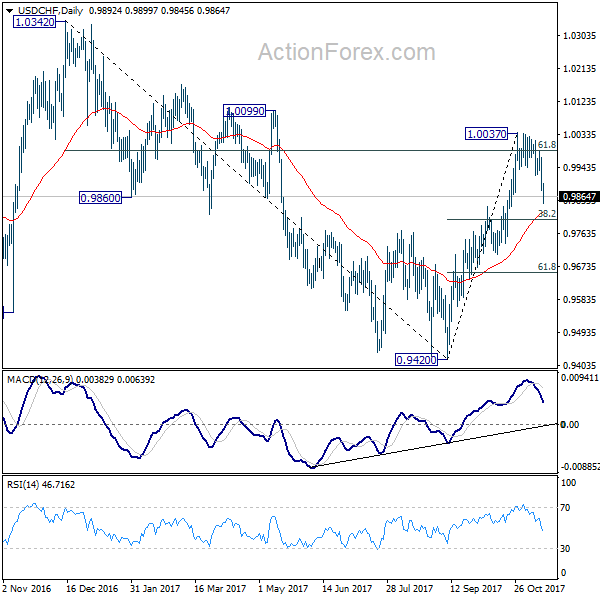
In the bigger picture, current development suggests that USD/CHF has defended 0.9443 (2016 low) key support level again. Rise from 0.9420 could is a medium term up move and should target a test on 1.0342 high. This represents the upper end of a long term range that started back in 2015. On the downside, break of 0.9736 support is now needed to indicate completion of the rise from 0.9420. Otherwise, further rally will remain in favor in medium term.
GBP/USD Mid-Day Outlook
Daily Pivots: (S1) 1.3088; (P) 1.3159; (R1) 1.3259; More....
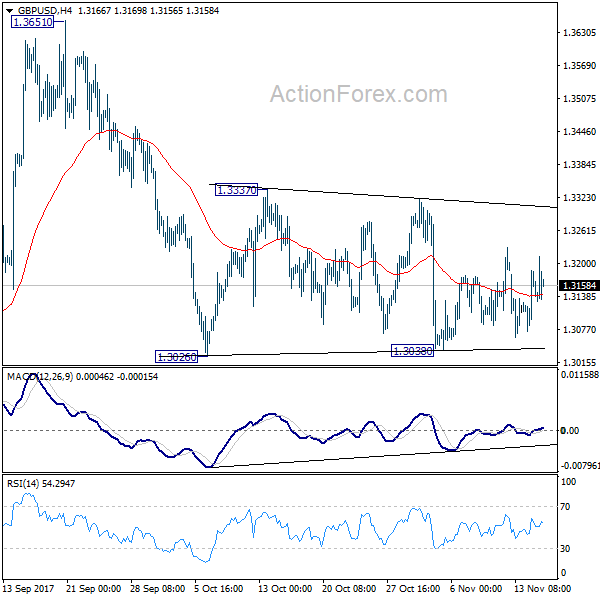
Intraday bias in GBP/USD remains neutral as it's still bounded in range of 1.3038/3337. In case of another recovery, upside should be limited below 1.3337 resistance to bring fall resumption. Break of 1.3038 will now resume decline from 1.3651 to 1.2773 key support level. However, decisive break of 1.3337 will indicate that pull back from 1.3651 is completed and medium term rise from 1.1946 is resuming.
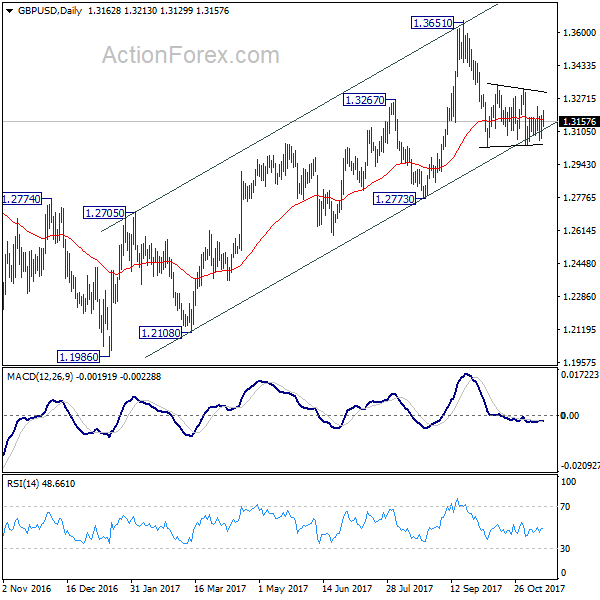
In the bigger picture, as noted before, GBP/USD hit strong resistance from the long term falling trend line. Current development is starting to favor that corrective rebound from 1.1946 low has completed at 1.3651. Decisive break of 1.2773 will confirm this bearish case and target a test on 1.1946 low next, with prospect of resuming the low term down trend. Nonetheless, break of 1.3320 resistance will restore the rise from 1.1946 for 38.2% retracement of 2.1161 (2007 high) to 1.1946 (2016 low) at 1.5466.
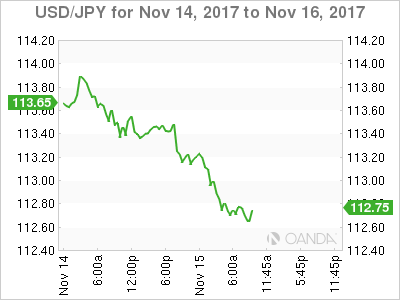
USD/JPY Mid-Day Outlook
Daily Pivots: (S1) 113.19; (P) 113.55; (R1) 113.80; More...
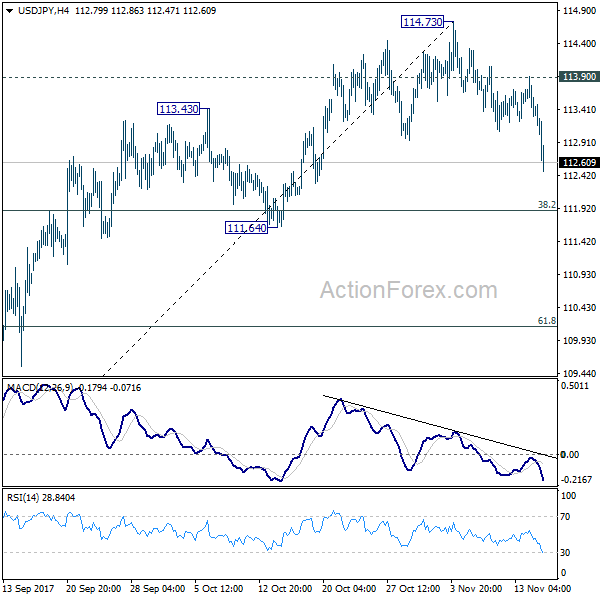
USD/JPY's drops to as low as 112.47 so far today. The strong break of 112.95 support should confirm rejection from 114.49 key resistance. Intraday bias is turned back to the downside for 38.2% retracement of 107.31 to 114.73 at 111.89 first. Sustained break of 111.64 support will now argue that rise from 107.31 has completed. In that case, USD/JPY should target 61.8% retracement at 101.14. On the upside, break of 113.90 resistance is needed to confirm completion of the fall. Otherwise, near term outlook will now stay cautiously bearish.
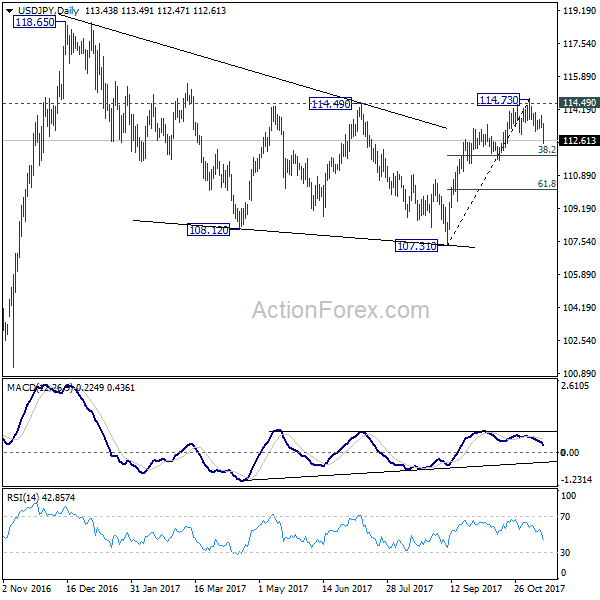
In the bigger picture, medium term rise from 98.97 (2016 low) is not completed yet. It should resume after corrective fall from 118.65 completes. Break of 114.49 resistance will likely resume the rise to 61.8% projection of 98.97 to 118.65 from 107.31 at 119.47 first. Firm break there will pave the way to 100% projection at 126.99. This will be the key level to decide whether long term up trend is resuming. However, firm break of 111.64 support will dampen this view and turn focus back to 107.31 instead.
Yen Surges on Global Equity Rout, Higher Core CPI Not Giving Support to Dollar
Yen surges broadly today on risk aversion as global equity markets suffer heavy selloff. At the time of writing, FTSE is trading down -0.5%, DAX down -1% while CAC is down -0.5%. DOW futures also point to triple digit loss. That followed -1.57% fall in Nikkei earlier. The correction in oil price is seen as a key facto that drives stocks down. WTI crude oil is trading at around 55, after dipping to 54.97, comparing to last week's high at 57.92. Euro remains generally firm and accelerates against Dollar, as supported by optimistic economic outlook. But the common currency is overwhelmed by Yen. Meanwhile, Aussie remains the weakest one today as weighed down by weak wage growth. Canadian Dollar follows as weighed down by oil. Dollar is trading as the third weakest, and it could try to recover on slightly higher than expected core CPI reading. But it's not showing any strong sign of rebound yet.
Crude oil tumbles as IEA lowered demand forecast
Correction in oil price is a key factor in driving the global equity rout. The Paris-based International energy Agency (IEA) unveiled in the monthly report that it has lowered the global oil demand growth forecast, by -0.05M bpd, to 1.5M bpd for this year. For 2018, the agency projects the demand would expand 1.3M bpd, down -0.19M bpd from last months' forecast for 2018. As a result, oil demand would reach 97.7M bpd this year and 98.9M bpd in 2018. It warned that the market might be oversupplied in 4Q17. While the market has used the downgrades as an excuse to lighten their long positions in oil and noted that the IEA has "poured cold water" on OPEC's upgrades on oil demand, one should note that IEA's demand forecasts for both this year and 2018 remain higher than OPEC's (2017: 96.9M bpd; 2018: 98.5M bpd), despite the downward revisions.
US core CPI accelerated, other data mixed
US headline CPI rose 0.1% mom, 2.0% yoy in October, slowed from 0.5% mom, 2.2% yoy but met expectation. Core CPI rose 0.2% mom 1.8% yoy, up from September's 0.1% mom 1.7% yoy. The annual reading also beat expectation at 1.7% yoy. Headline retail sales rose 0.2% in October, above expectation of 0.0%. But ex-auto sales rose 0.1%, missed expectation of 0.2%. Empire state manufacturing index dropped to 19.4 in November, below expectation of 25.0. While some Fed officials expressed concern on sluggish inflation, the pickup in core CPI should keep Fed on track for a December hike.
Fed doves showed concerns on inflation
Chicago Fed President Charles Evans expressed his concerns on inflation. He said that "when I look at the downward drift in multiple expectations measures, I find it tougher to confidently buy into the idea that inflation today is just temporarily low once again." And he urged his fellow Fed official that "our public commentary needs to acknowledge a much greater chance of inflation running at 2-1/2 percent in the coming years than I believe we have communicated in the past." Nonetheless, he remain optimistic on the economy and expects "continued solid growth" in 2018.
St. Louis Fed President James Bullard said yesterday that "inflation data during 2017 have surprised to the downside and call into question the idea that U.S. inflation is reliably returning toward target." And he warned that "the main concern I would have is that we raise rates in December and inflation expectations fall... which would in my view be a vote of no confidence from markets."
UK employment suffered worst contraction since 2015
UK claimant counts rose 1.1k in October, better than expectation at 2.4k. Claimant count rate was unchanged at 2.3%. ILO unemployment rate was unchanged at 4.3%, in line with consensus. Average weekly earnings rose 2.2% 3moy, slightly higher than expectation of 2.1% 3moy. Considering that CPI stood at 3.1% in October, real wage was indeed in decline and continued to squeeze household spending power. Overall employment dropped -14k in the three months to September. The contraction is the worst since 2015 and raised concerned that Brexit is hurting the labor market. Both job and wage data affirms the general view that BoE is no where near another rate hike and could only move a year from now.
Australian wage growth missed expectations
Australia wage price index rose 0.5% qoq in Q3, unchanged from quarter's figure and missed expectation of 0.7% qoq. Annually, wage grew 2.0% yoy, also missed expectation of 2.2% yoy. Growth in wage was driven by end of financial year salary reviews as well as the annual minimum wage review. The 3.3% rise in minimum wage already boosted quarterly wage growth by 0.2%. Hence, considering all factors, wage growth was like non-existent in the September quarter. And that clearly support RBA's neutral stance to divergence from global monetary tightening and stands pat ahead. Also from Australia, Westpac consume confidence dropped -1.7% in November.
Yen surges on Japan GDP miss
Japan GDP grew 0.3% qoq in Q3, below expectation of 0.4% qoq. That's also just half of prior quarter's 0.6% qoq. Nonetheless, that's still the second straight quarter of growth, held by exports as global economy recovers. GDP deflator rose 0.1% yoy, in line with consensus.
USD/JPY Mid-Day Outlook
Daily Pivots: (S1) 113.19; (P) 113.55; (R1) 113.80; More...
USD/JPY's drops to as low as 112.47 so far today. The strong break of 112.95 support should confirm rejection from 114.49 key resistance. Intraday bias is turned back to the downside for 38.2% retracement of 107.31 to 114.73 at 111.89 first. Sustained break of 111.64 support will now argue that rise from 107.31 has completed. In that case, USD/JPY should target 61.8% retracement at 101.14. On the upside, break of 113.90 resistance is needed to confirm completion of the fall. Otherwise, near term outlook will now stay cautiously bearish.
In the bigger picture, medium term rise from 98.97 (2016 low) is not completed yet. It should resume after corrective fall from 118.65 completes. Break of 114.49 resistance will likely resume the rise to 61.8% projection of 98.97 to 118.65 from 107.31 at 119.47 first. Firm break there will pave the way to 100% projection at 126.99. This will be the key level to decide whether long term up trend is resuming. However, firm break of 111.64 support will dampen this view and turn focus back to 107.31 instead.
Economic Indicators Update
| GMT | Ccy | Events | Actual | Forecast | Previous | Revised |
|---|---|---|---|---|---|---|
| 23:30 | AUD | Westpac Consumer Confidence Nov | -1.70% | 3.60% | ||
| 23:50 | JPY | GDP Q/Q Q3 P | 0.30% | 0.40% | 0.60% | |
| 23:50 | JPY | GDP Deflator Y/Y Q3 P | 0.10% | 0.10% | -0.40% | |
| 00:30 | AUD | Wage Price Index Q/Q Q3 | 0.50% | 0.70% | 0.50% | |
| 04:30 | JPY | Industrial Production M/M Sep F | -1.00% | -1.10% | -1.10% | |
| 09:30 | GBP | Jobless Claims Change Oct | 1.1K | 2.4K | 1.7K | 2.6K |
| 09:30 | GBP | Claimant Count Rate Oct | 2.30% | 2.30% | ||
| 09:30 | GBP | Average Weekly Earnings 3M/Y Sep | 2.20% | 2.10% | 2.20% | |
| 09:30 | GBP | ILO Unemployment Rate 3M Sep | 4.30% | 4.30% | 4.30% | |
| 09:30 | GBP | Employment Change 3M/3M Sep | -14k | 50k | 94k | |
| 10:00 | EUR | Eurozone Trade Balance (EUR) Sep | 25.0B | 21.4B | 21.6B | 21.0B |
| 13:30 | USD | CPI M/M Oct | 0.10% | 0.10% | 0.50% | |
| 13:30 | USD | CPI Y/Y Oct | 2.00% | 2.00% | 2.20% | |
| 13:30 | USD | CPI Core M/M Oct | 0.20% | 0.20% | 0.10% | |
| 13:30 | USD | CPI Core Y/Y Oct | 1.80% | 1.70% | 1.70% | |
| 13:30 | USD | Empire State Manufacturing Nov | 19.4 | 25 | 30.2 | |
| 13:30 | USD | Advance Retail Sales M/M Oct | 0.20% | 0.00% | 1.60% | 1.90% |
| 13:30 | USD | Retail Sales Ex Auto M/M Oct | 0.10% | 0.20% | 1.00% | 1.20% |
| 15:00 | USD | Business Inventories Sep | 0.00% | 0.70% | ||
| 15:30 | USD | Crude Oil Inventories | 2.2M | |||
| 21:00 | USD | Net Long-term TIC Flows Sep | 34.6B | 67.2B |
GOLD: Bullish, Sets Up For More Recovery Higher
GOLD: The commodity now eyes further bull pressure after following though higher during early Wednesday trading today. On the downside, support comes in at the 1,280.00 level where a break will turn attention to the 1,270.00 level. Further down, a cut through here will open the door for a move lower towards the 1,260.00 level. Below here if seen could trigger further downside pressure towards the 1,250.00 level. Conversely, resistance resides at the 1,290.00 level where a break will aim at the 1,300.00 level. A turn above there will expose the 1,310.00 level. Further out, resistance stands at the 1,320.00 level. All in all, GOLD looks to strengthen further higher on correction.