Sample Category Title
Bank of Japan Expected to Raise Rates, Yen Calm
The Japanese yen is slightly lower on Thursday. In the European session, USD/JPY is trading at 156.25, down 0.16% on the day.
BoJ expected to hike rates
All eyes are on the Bank of Japan, which meets early on Friday. The BoJ is expected to raise interest rates by 25 basis points which would bring the cash rate to 0.50%. The BoJ has said that it will raise rates if it sees higher wage growth, which would indicate that inflation is sustainable. BoJ policymakers have expressed confidence that wages are moving higher and Deputy Governor Himino said last week that many firms plan to raise wages at least as much as last year.
Investors will be keeping a close eye on the BoJ’s rate statement. The tone of the statement could be dovish as BoJ policymakers are concerned about President Donald Trump’s threats to levy trade tariffs as early as Feb. 1, a move which could destabilize the financial markets. The BoJ will have to be cautious as it gauges the ‘Trump factor”.
Another factor supporting a rate hike is the poor performance of the Japanese yen, which has declined around 9% in the past three months. The Federal Reserve is sounding more hawkish and might raise rates only once or twice this year. If the BoJ stays on the sidelines again, the yen could fall further.
Overshadowed by the BoJ meeting, Japan releases December core CPI. Japan’s core inflation rate has been climbing higher and is expected to climb to 3% y/y, up from 2.7% in November which was a three-month high. The core rate, which is closely watched by the BOJ, has hovered above the central bank’s target of 2% for over two years.
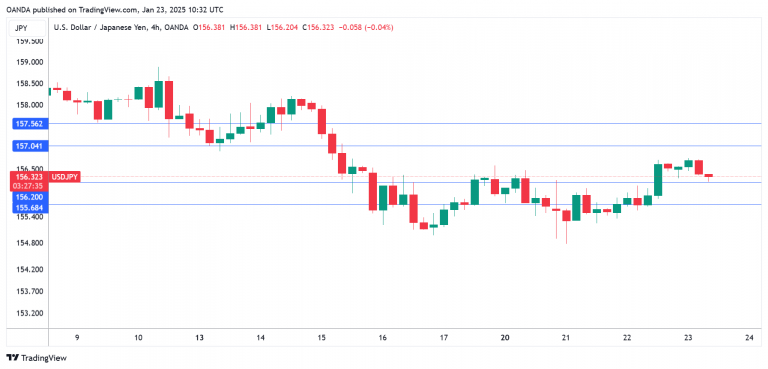
USD/JPY Technical
- USD/JPY is testing support at 156.20. Below, there is support at 155.68
- 157.04 and 157.56 are the next resistance lines
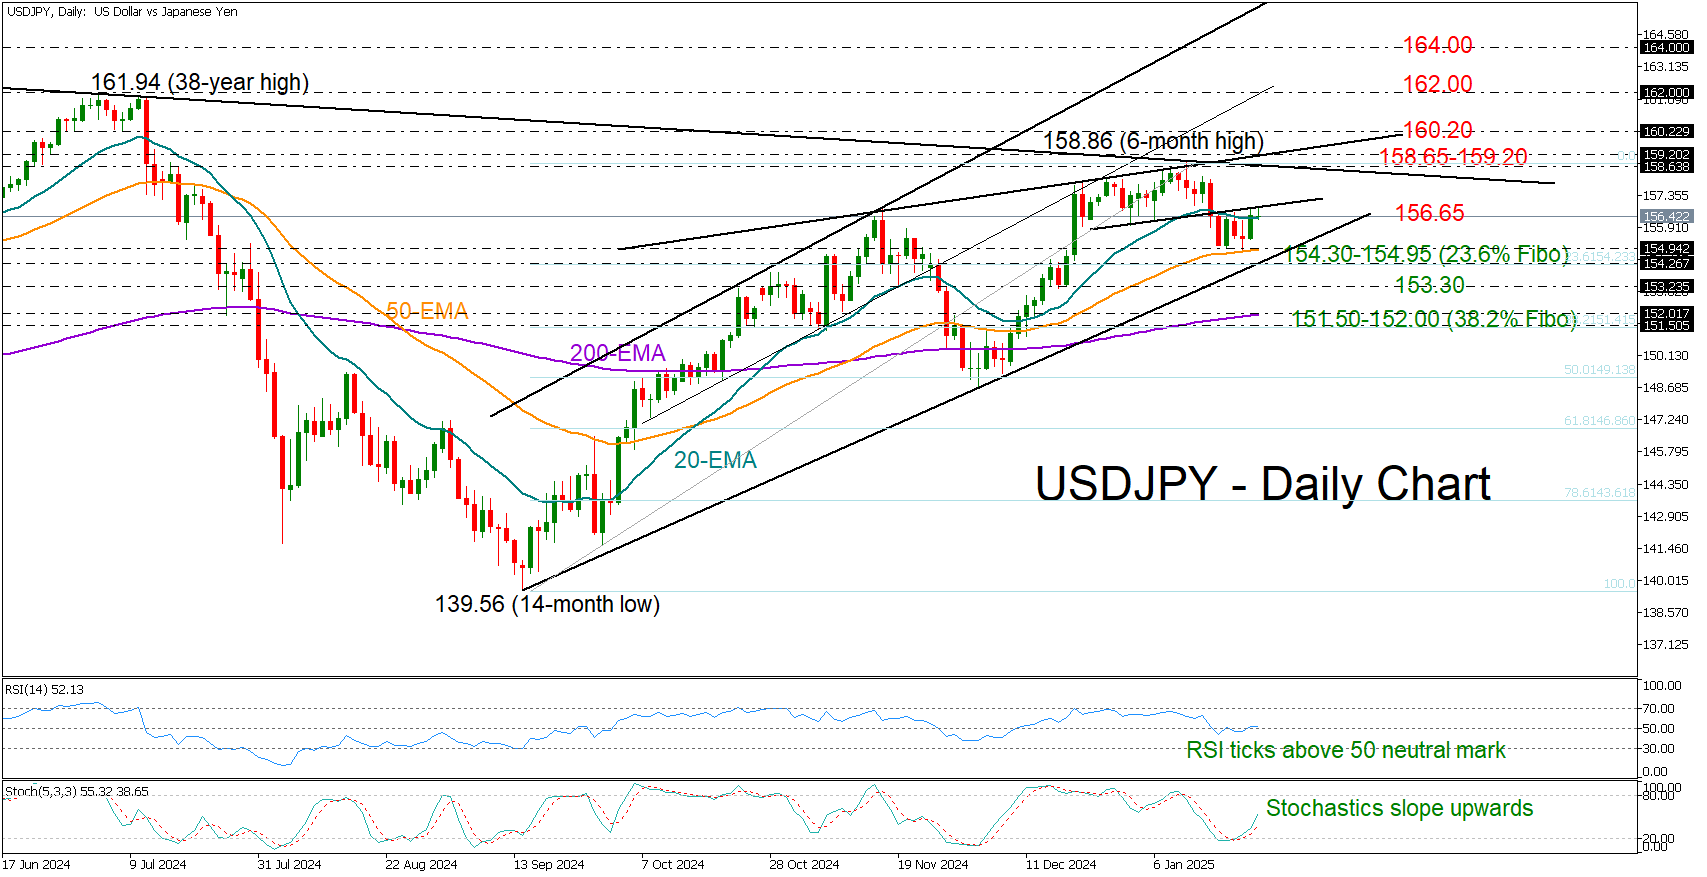
USD/JPY Stubbornly Tests 156.65 Barrier
- USD/JPY rebounds near 50-day EMA ahead of BoJ’s rate decision.
- Technical signals improve, but a close above 156.65 still needed.
USDJPY found fresh buying interest near its 50-day exponential moving average (EMA) around 154.70 and gently rose back to the key resistance area of 156.65 ahead of the Bank of Japan’s rate decision on Friday. Analysts expect a 25-bps rate hike to 0.50% - this will be the third increase since March 2024. Japan’s national CPI figures will also be out earlier in the day.
The technical indicators have started to look a bit more promising, with the RSI entering the bullish area above 50 and the stochastic oscillator starting a new positive cycle.
But for the bulls to get excited, the pair will need to knock down the wall around 156.65. If that proves to be the case, the price could advance straight to the 158.65-159.20 constraining territory, which has functioned as a ceiling recently. Beyond that, the rally could stretch toward the 160.20 handle, which was a key obstacle to price movements in April and July 2024, and then fight for the 162.00 level.
Should selling pressures resurface, with the price tumbling below the support trendline and the 23.6% Fibonacci retracement of the September-January upleg at 154.30, the 153.30 zone may attempt to pause the fall. If not, the decline could stretch toward the 200-day EMA at 152.00 and the 38.2% Fibonacci of 151.50. A deeper pullback could see a test near the 50% Fibonacci of 149.13.
In a nutshell, USDJPY has not overcome downside risks despite exhibiting improving technical signals. A close above 156.65 could be a good sign, but only a break above 158.65-159.20 would put the pair back in an uptrend.
Germany’s DAX 40 Stock Index Hits Record High
The country’s Finance Minister, Jörg Kukies, stated in an interview with CNBC that it is crucial for Germany to enter a period of economic growth, adding that structural deficiencies need to be addressed.
“We have just received another downward revision of growth forecasts from the IMF,” he said at the World Economic Forum in Davos. The International Monetary Fund (IMF) now projects Germany’s GDP growth at 0.3% in 2025 and 1.1% in 2026, according to the January update of its World Economic Outlook. This marks a sharp decline from the October forecast of 0.8% growth in 2025.
Germany’s annual gross domestic product contracted in both 2023 and 2024. Quarterly GDP figures were also modest, although the economy has so far avoided a technical recession.
Kukies also remarked that domestic German companies are “under stress” but continue to perform “very well” on the global market, seemingly referencing the rise of the DAX 40 stock index (Germany 40 mini on FXOpen). Indeed, yesterday the index surpassed the 21,300-point level for the first time in history.
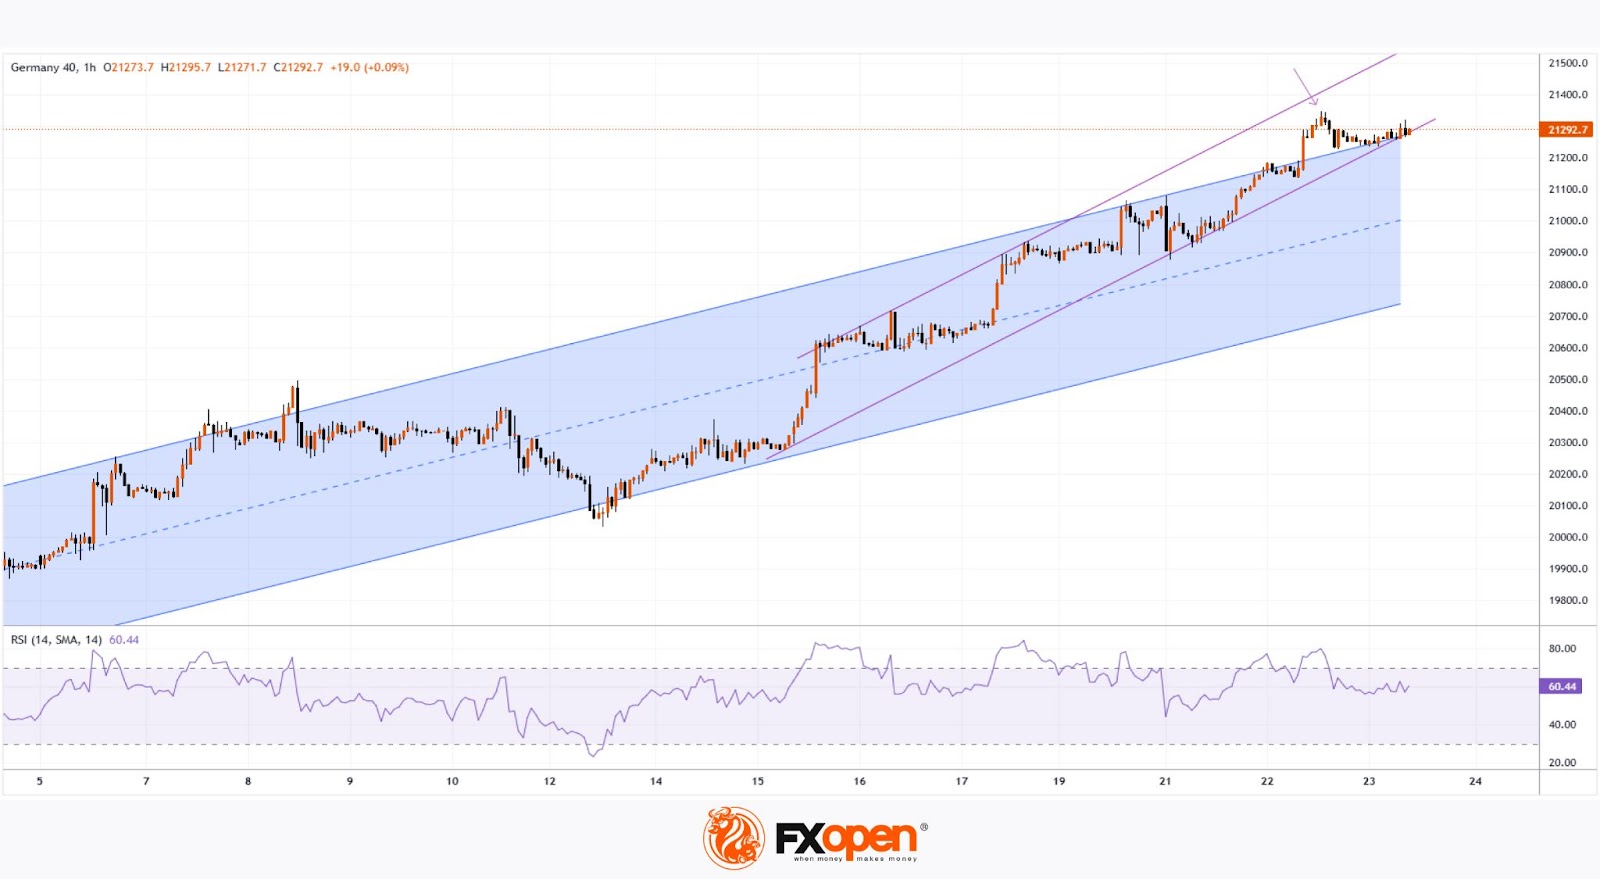
Technical analysis of the DAX 40 stock index chart (Germany 40 mini on FXOpen) indicates that the price is forming two ascending channels. While rising within the steeper purple channel, the price has exceeded the upper boundary of the blue channel.
However, given that the price has not yet reached the upper boundary of the purple channel (as indicated by the arrow), it is reasonable to suggest that bullish momentum may be waning. If so, a possible scenario could involve a correction with a bearish breakout of the lower purple line, leading the price back into the blue channel. It is also possible that there will be one more attempt to set a new record, accompanied by the formation of bearish divergence on the RSI indicator.
Trade global index CFDs with zero commission and tight spreads. Open your FXOpen account now or learn more about trading index CFDs with FXOpen.
This article represents the opinion of the Companies operating under the FXOpen brand only. It is not to be construed as an offer, solicitation, or recommendation with respect to products and services provided by the Companies operating under the FXOpen brand, nor is it to be considered financial advice.
GBP/JPY Daily Outlook
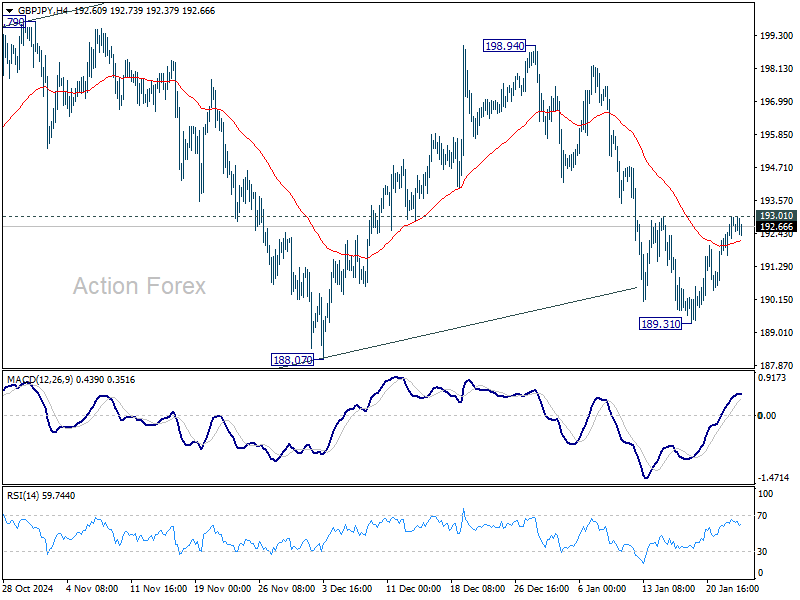
Daily Pivots: (S1) 191.97; (P) 192.49; (R1) 193.31; More...
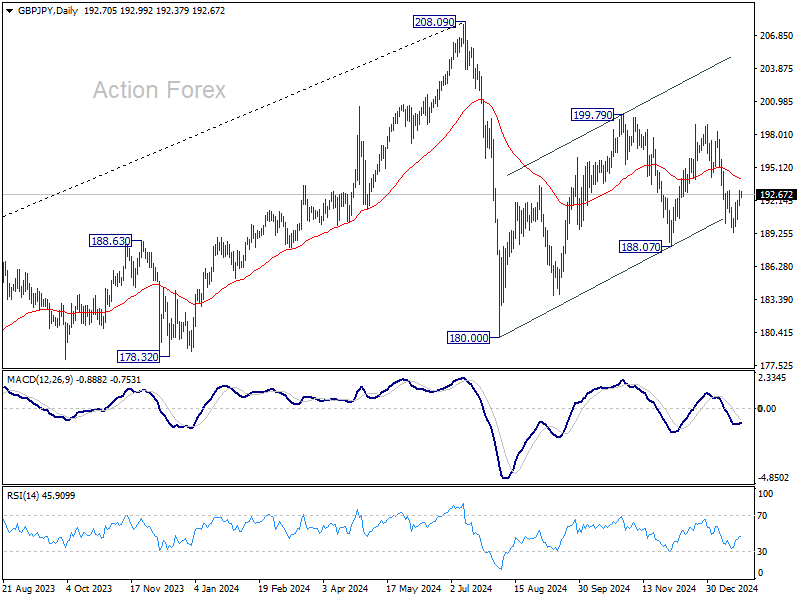
Intraday bias in GBP/JPY stays neutral at this point. Risk remains on the downside with 193.01 resistance intact. Break of 189.31 will target 188.07 support. Firm break there will argue that corrective pattern from 180.00 has finished too, and larger decline from 208.09 might be ready to resume. However, firm break of 193.01 will turn bias to the upside for stronger rebound.
In the bigger picture, price actions from 208.09 are seen as a correction to whole rally from 123.94 (2020 low). The range of consolidation should be set between 38.2% retracement of 123.94 to 208.09 at 175.94 and 208.09. However, decisive break of 175.94 will argue that deeper correction is underway.
EUR/JPY Daily Outlook
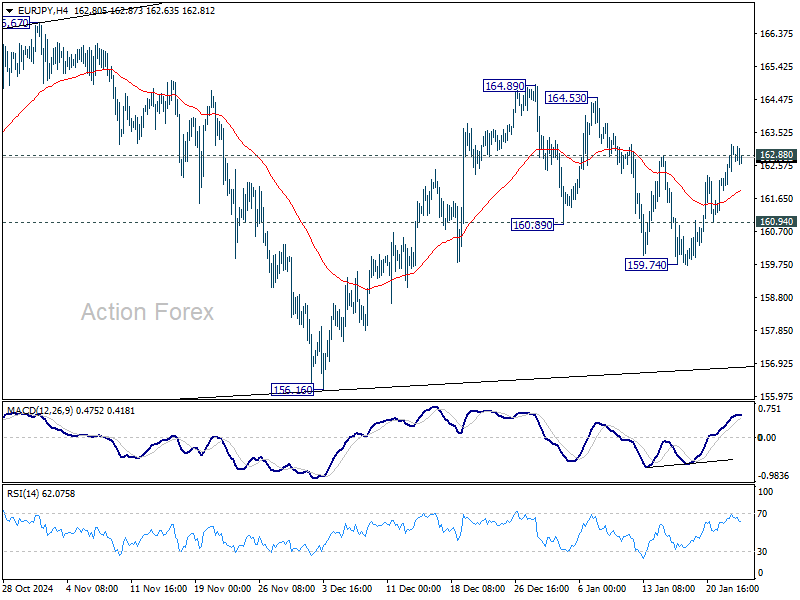
Daily Pivots: (S1) 161.98; (P) 162.60; (R1) 163.57; More...
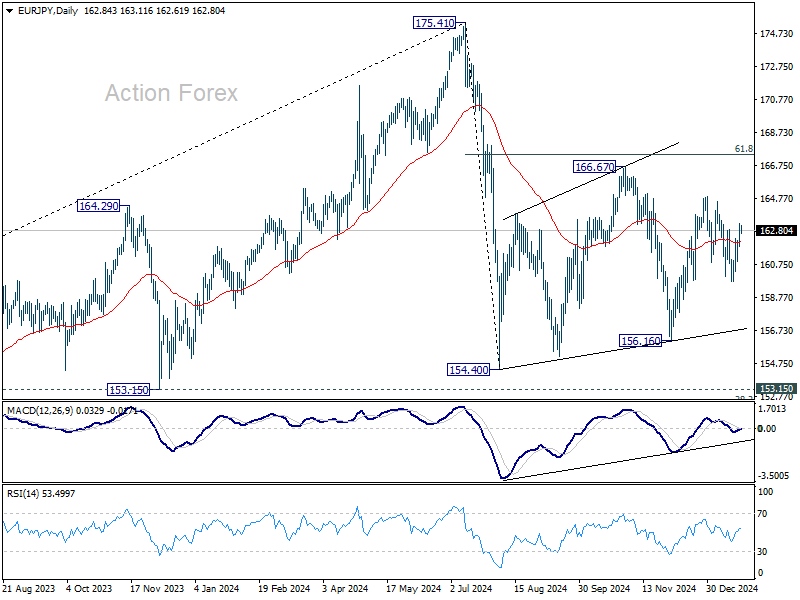
EUR/JPY breach of 162.88 minor resistance argues that corrective pull back from 164.89 has completed at 159.74. Intraday bias is back on the upside for 164.89 resistance. Firm break there will resume the rise from 156.16, as another leg of the corrective pattern from 154.40. On the downside, below 160.94 minor support will turn intraday bias back to the downside.
In the bigger picture, price actions from 175.41 are seen as correction to rally from 114.42 (2020 low). The range of consolidation should have been set between 38.2% retracement of 114.42 to 175.41 at 152.11 and 175.41 high. However, decisive break of 152.11 would argue that deeper correction is underway.
EUR/GBP Daily Outlook
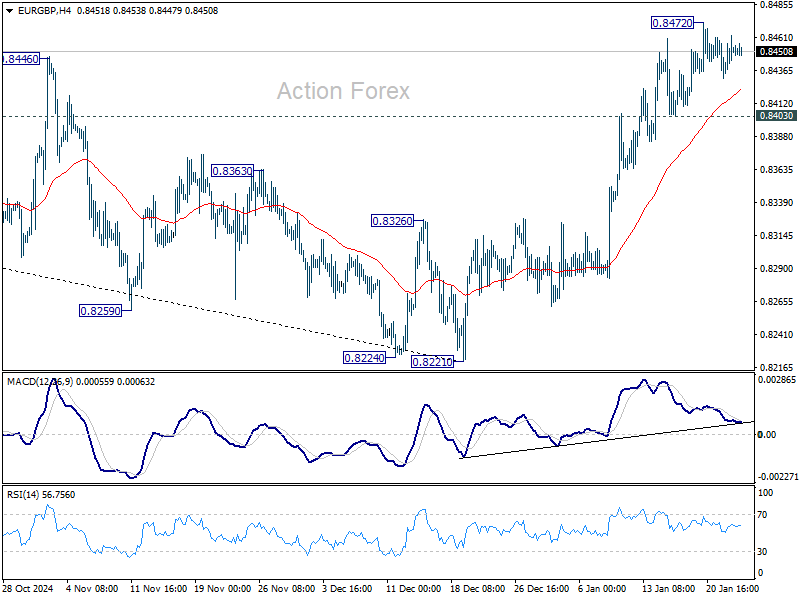
Daily Pivots: (S1) 0.8435; (P) 0.8449; (R1) 0.8467; More...
Intraday bias in EUR/GBP stays neutral for consolidations below 0.8472 temporary top. Outlook will stay bullish as long as 0.8403 support holds. Break of 0.8472 temporary top will resume the rally from 0.8221 to 0.8624 key cluster resistance zone next.
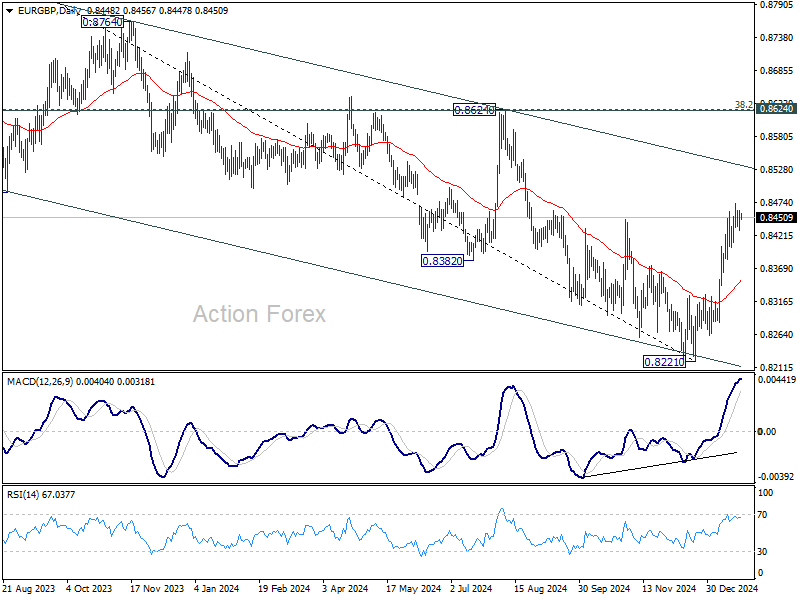
In the bigger picture, a medium term bottom was formed at 0.8221, just ahead of 0.8201 key support (2022 low). But outlook will be neutral as best as long as 0.8624 cluster resistance (38.2% retracement of 0.9267 to 0.8221 at 0.8621) holds. That is, larger down trend from 0.9267 (2022 high) might still extend lower. However, decisive break of 0.8621/4 should confirm trend reversal and turn outlook bullish.
EUR/AUD Daily Outlook
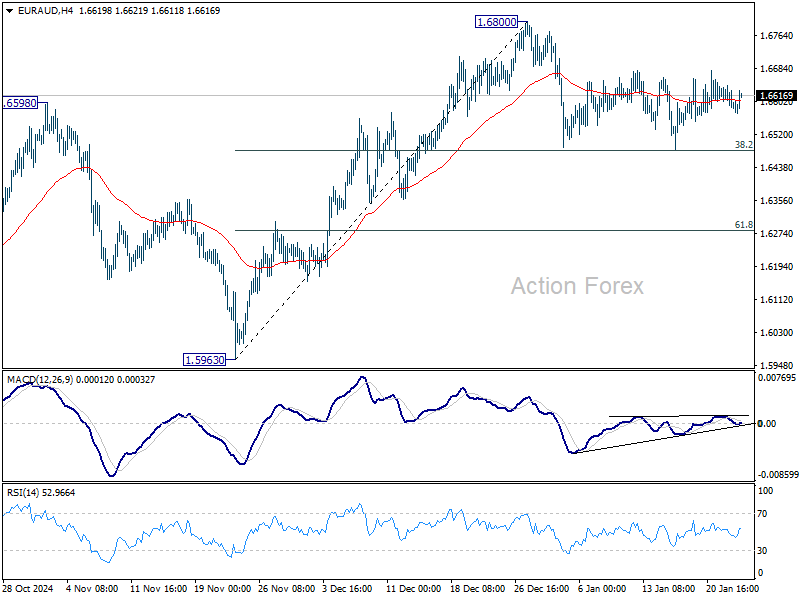
Daily Pivots: (S1) 1.6561; (P) 1.6618; (R1) 1.6652; More...
EUR/AUD is still extending the consolidation pattern below 1.6800 and intraday bias stays neutral. Strong support is still expected from 38.2% retracement of 1.5963 to 1.6800 at 1.6480 to contain downside. On the upside, firm break of 1.6800 will resume the rally from 1.5963. However, sustained break of 1.6480 will bring deeper correction 61.8% retracement at 1.6283 instead.
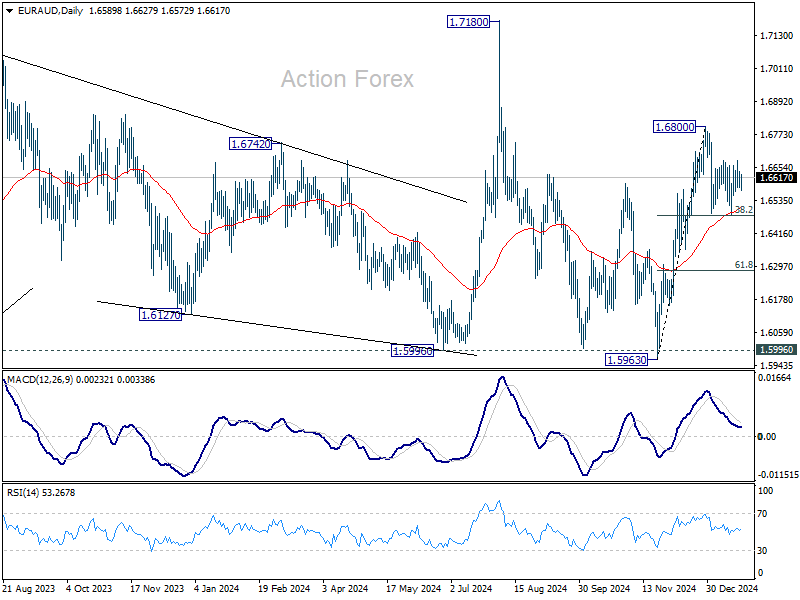
In the bigger picture, EUR/AUD is holding on to 1.5996 key support despite brief breach. Larger up trend from 1.4281 (2022 low) is still in favor to resume through 1.7180 at a later stage. Nevertheless, sustained break of 1.5995 will indicate that such up trend has completed and deeper decline would be seen.
EUR/CHF Daily Outlook
Daily Pivots: (S1) 0.9426; (P) 0.9441; (R1) 0.9452; More....
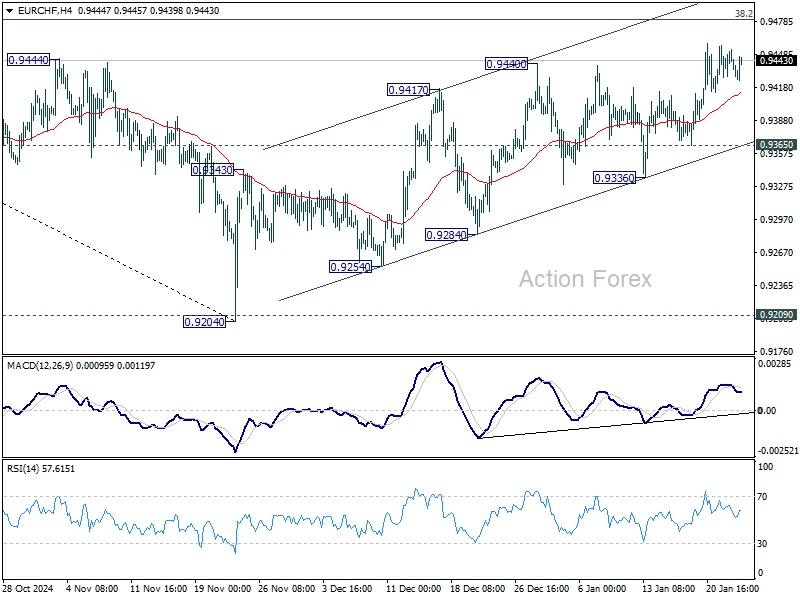
While EUR/CHF's corrective rebound from 0.9204 might extend higher, strong resistance is expected from 0.9481 fibonacci level to finish it. On the downside, below 0.9365 minor support will turn bias to the downside for 0.9336 support first. Firm break of 0.9336 will argue that the correction has completed.
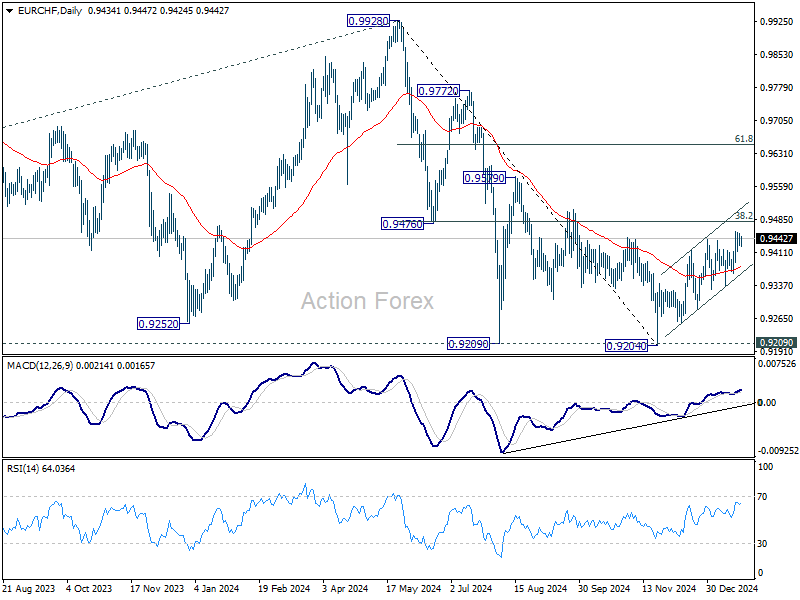
In the bigger picture, while corrective rebound from 0.9204 might extend higher, strong resistance could be seen from 38.2% retracement of 0.9928 to 0.9204 at 0.9481 to limit upside. Down trend from 0.9928 (2024 high) is still in favor to resume through 0.9204/9 support zone at a later stage. However, strong break of 0.9481 will raise the chance of medium term bottoming, and bring further rally back to 61.8% retracement at 0.9651.
EUR/USD Daily Outlook
Daily Pivots: (S1) 1.0383; (P) 1.0420; (R1) 1.0447; More...
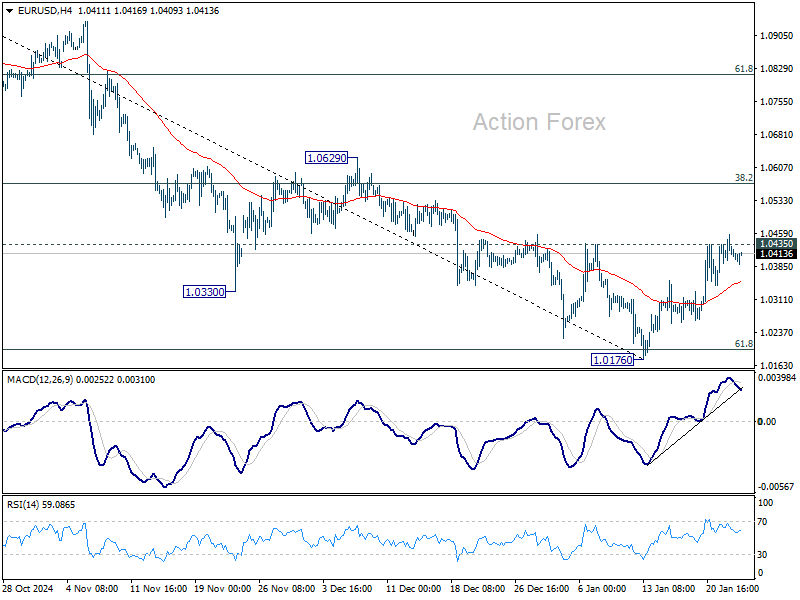
Intraday bias in EUR/USD remains neutral for the moment. On the upside, firm break of 1.0435 will extend the rebound from 1.0176 to 38.2% retracement of 1.1213 to 1.0176 at 1.0572. Rejection by 1.0435 will keep the correction from 1.0176 relatively short. Firm break of 1.0176 will resume whole fall from 1.1213.
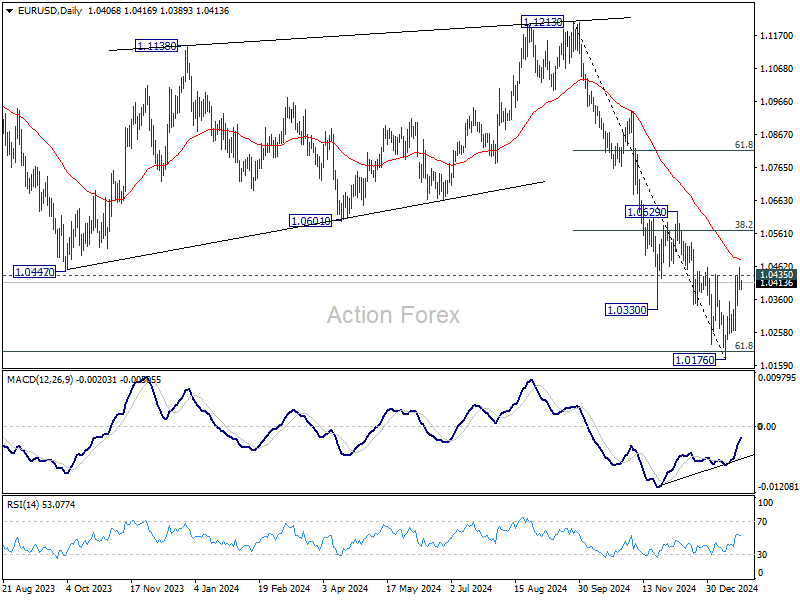
In the bigger picture, fall from 1.1274 (2023 high) should either be the second leg of the corrective pattern from 0.9534 (2022 low), or another down leg of the long term down trend. In both cases, sustained break of 61.8 retracement of 0.9534 to 1.1274 at 1.0199 will pave the way back to 0.9534. For now, outlook will stay bearish as long as 1.0629 resistance holds, even in case of strong rebound.
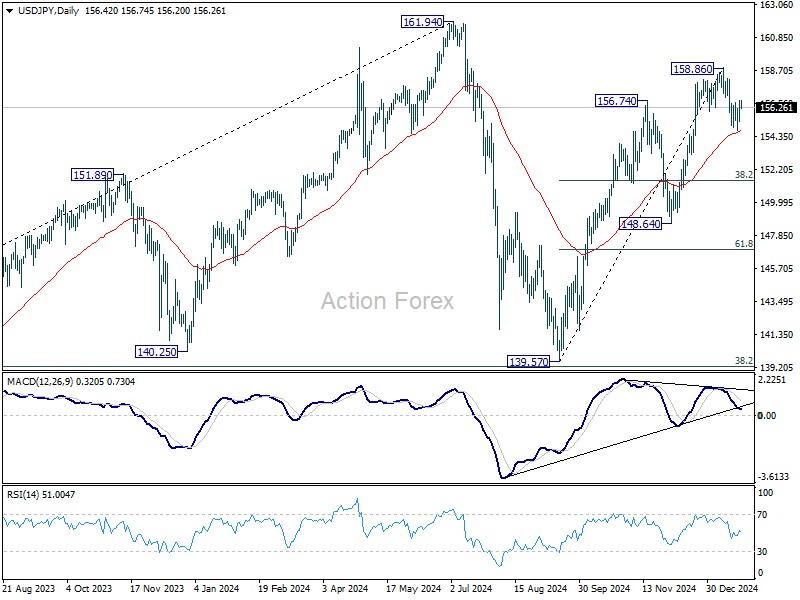
USD/JPY Daily Outlook
Daily Pivots: (S1) 155.68; (P) 156.20; (R1) 157.04; More...
Intraday bias in USD/JPY remains neutral for the moment. Sustained trading below 55 D EMA (now at 154.73) will extend the correction from 158.86 to 38.2% retracement of 139.57 to 158.86 at 151.49 next. However, firm break of 158.86 will resume the whole rally from 139.67 to retest 161.94 high.
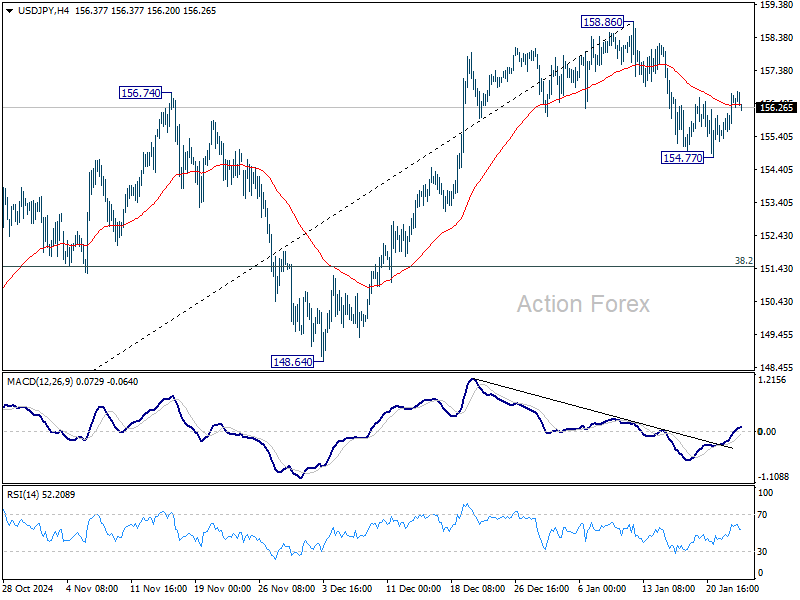
In the bigger picture, price actions from 161.94 are seen as a corrective pattern to rise from 102.58 (2021 low). The range of medium term consolidation should be set between 38.2% retracement of 102.58 to 161.94 at 139.26 and 161.94. Nevertheless, sustained break of 139.26 would open up deeper medium term decline to 61.8% retracement at 125.25.