
Sample Category Title
Europe Faces ‘Peak Pessimism’
In focus today
Today, we receive the January PMI index for both the euro area and the US. This index has recently significantly impacted financial markets especially in Europe as attention has shifted to growth amid continued lower inflation momentum. In the euro area, we anticipate a slight rise in the composite PMI to 50.0, with slow growth in the service sector and manufacturing gradually moving back up towards 50, indicating an ongoing but slower decline.
In Sweden, December PPI and Labour Force Survey are released.
Economic and market news
What happened overnight
In Japan, the Bank of Japan hiked its policy rate by 25bp to 0.50% in a long-anticipated move. The decision followed just a couple of hours after December CPI inflation (excluding fresh food) was released with a 0.3 percentage point increase to 3.0%, driven by a removal of government energy subsidies. The BoJ also adjusted its inflation forecast 0.5 percentage points higher to 2.4% in the fiscal year 2025 (starting in April). The move dragged USD/JPY about 0.5% lower to 155.
Next, investors will look at the press conference later this morning to get an idea of the BoJ's next move. We expect Ueda to signal a cautious stance, where further hikes will depend on the upcoming wage negotiations and global market sentiment. We think, the BoJ will find room for another two rate hikes this year once continued wage growth has been confirmed.
What happened yesterday
In the US, President Trump used his speech at the World Economic Forum to insist global companies should manufacture their products in the US or face significant tariffs. He also called on Saudi Arabia and OPEC to lower oil prices to help end the war in Ukraine. With oil prices lowered, Trump would push for interest rates around the world to drop immediately.
In the euro area, European Central Bank President Christine Lagarde stated that Europe's "existential crisis" outlook is not pessimistic, on the back of Europe's vulnerability to a new 'America First' dynamic in the US relationship.
In a slightly more positive light, consumer confidence rose to -14.2 (cons: -14.1) in January from -14.5 in December. The rise in January gives some relief to the growth outlook as the downward movement we saw in November and December stopped. Consumer confidence is important for the growth outlook as private consumption is expected to be the main driver of growth this year.
In Norway, Norges Bank kept rates unchanged this morning at 4.5% and firmly guided towards March as the most likely time for the first rate cut. The market reaction was close to non-existent amid very little news.
Equities: Global equities were higher yesterday, rising for the eighth consecutive day. Gains were fairly broad-based, with defensives performing as well as cyclicals, while tech underperformed. In Europe, the advances were driven by banks, continuing their strong run from last year as both macroeconomic factors and earnings continue to support the sector. In the US yesterday, the Dow was up by 0.9%, the S&P 500 by 0.5%, the Nasdaq by 0.2%, and the Russell 2000 by 0.5%. Most Asian markets are higher this morning, led by China, in what appears to be a bit of trade war relief as the worst-case scenario seems less likely with the latest comments from Trump. Japanese equities are flat following the rate hike from the Bank of Japan, a strong yen, and higher yields across the curve. European futures are in the green this morning, while US futures are marginally lower.
FI: Global rates sold off from the long end yesterday, led yet-again by the US treasury market, in a steepening move. 10y UST rose 3bp to 4.64%. It was a day without significant news as markets await the euro PMIs out this morning, and the important central bank meetings week next week, where we have both the ECB and the Fed meeting
FX: USD lost some ground against the most of G10 yesterday, while GBP, AUD and NZD were top performers, as US President Trump spoke in Davos, but in the big picture his speech did not move the market. NOK was about unchanged following the Norges Bank's decision to keep interest rates unchanged.
USD/JPY Increase on Hold: Here’s Why The Pair Could Struggle
Key Highlights
- USD/JPY started a fresh increase above the 155.80 resistance.
- It cleared a connecting bearish trend line with resistance at 156.35 on the 4-hour chart.
- EUR/USD started a consolidation phase below the 1.0465 resistance.
- GBP/USD could face hurdles near the 1.2400 and 1.2420 levels.
USD/JPY Technical Analysis
The US Dollar found support at 154.80 against the Japanese Yen. USD/JPY surpassed 155.50 and 155.80 to enter a positive zone.
Looking at the 4-hour chart, the pair was able to clear the 38.2% Fib retracement level of the downward move from the 158.87 swing high to the 154.77 low. It cleared the 200 simple moving average (green, 4-hour) and traded close to the 100 simple moving average (red, 4-hour).
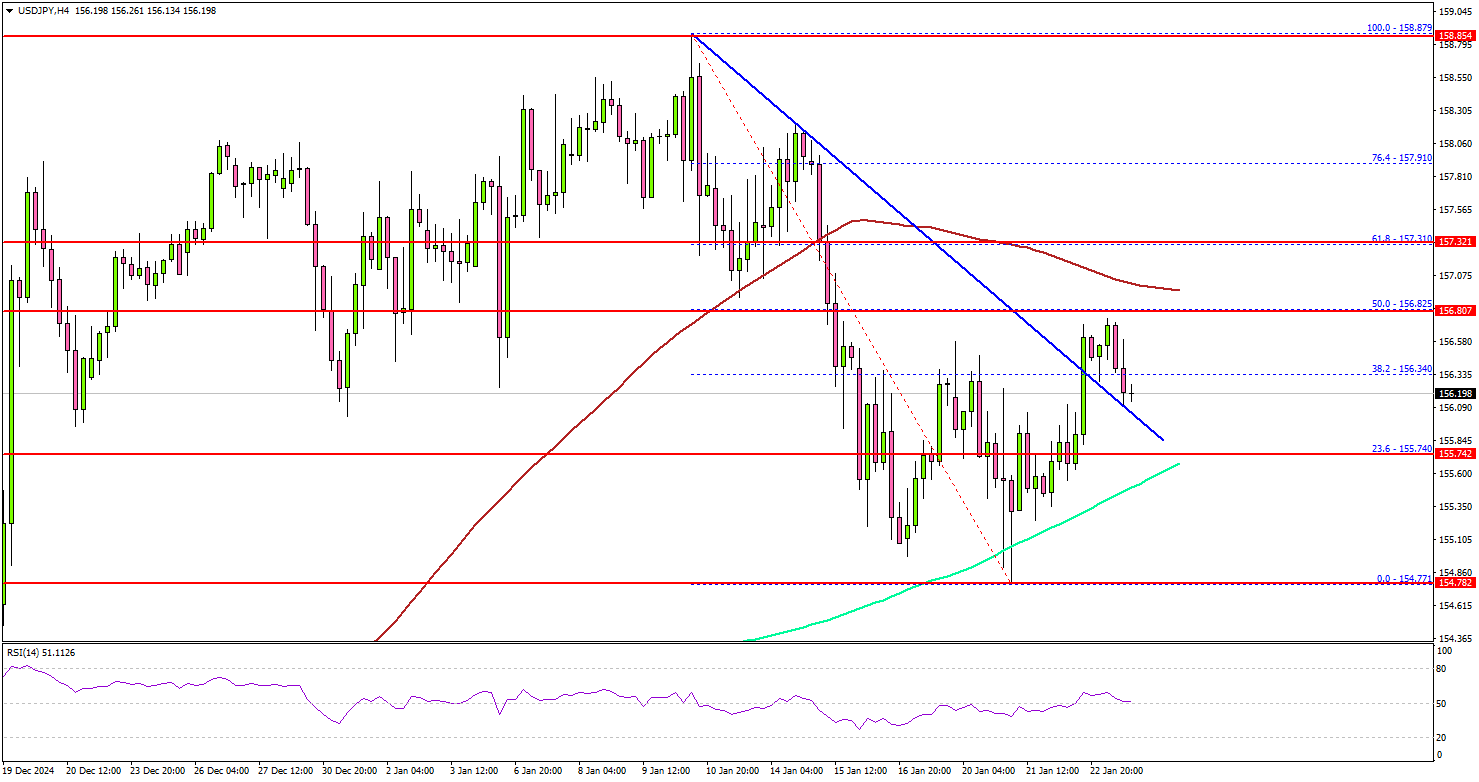
On the upside, the pair seems to be facing hurdles near the 156.80 level. It is close to the 50% Fib retracement level of the downward move from the 158.87 swing high to the 154.77 low.
The next major resistance is near the 157.30 level. A close above the 157.30 level could set the tone for another increase. In the stated case, the pair could even clear the 158.00 resistance.
On the downside, immediate support sits near the 155.80 level. The next key support sits near the 155.50 level. Any more losses could send the pair toward the 155.00 level.
Looking at GBP/USD, the pair started a short-term recovery wave but the bears might remain active near the 1.2400 resistance.
Upcoming Economic Events:
- Euro Zone Manufacturing PMI for Jan 2025 (Preliminary) – Forecast 45.3, versus 45.1 previous.
- Euro Zone Services PMI for Jan 2025 (Preliminary) – Forecast 51.6, versus 51.6 previous.
- US Manufacturing PMI for Jan 2025 (Preliminary) – Forecast 49.6, versus 49.4 previous.
- US Services PMI for Jan 2025 (Preliminary) – Forecast 56.5, versus 56.8 previous.
Elliott Wave View on DAX Nesting Higher in Impulsive Structure
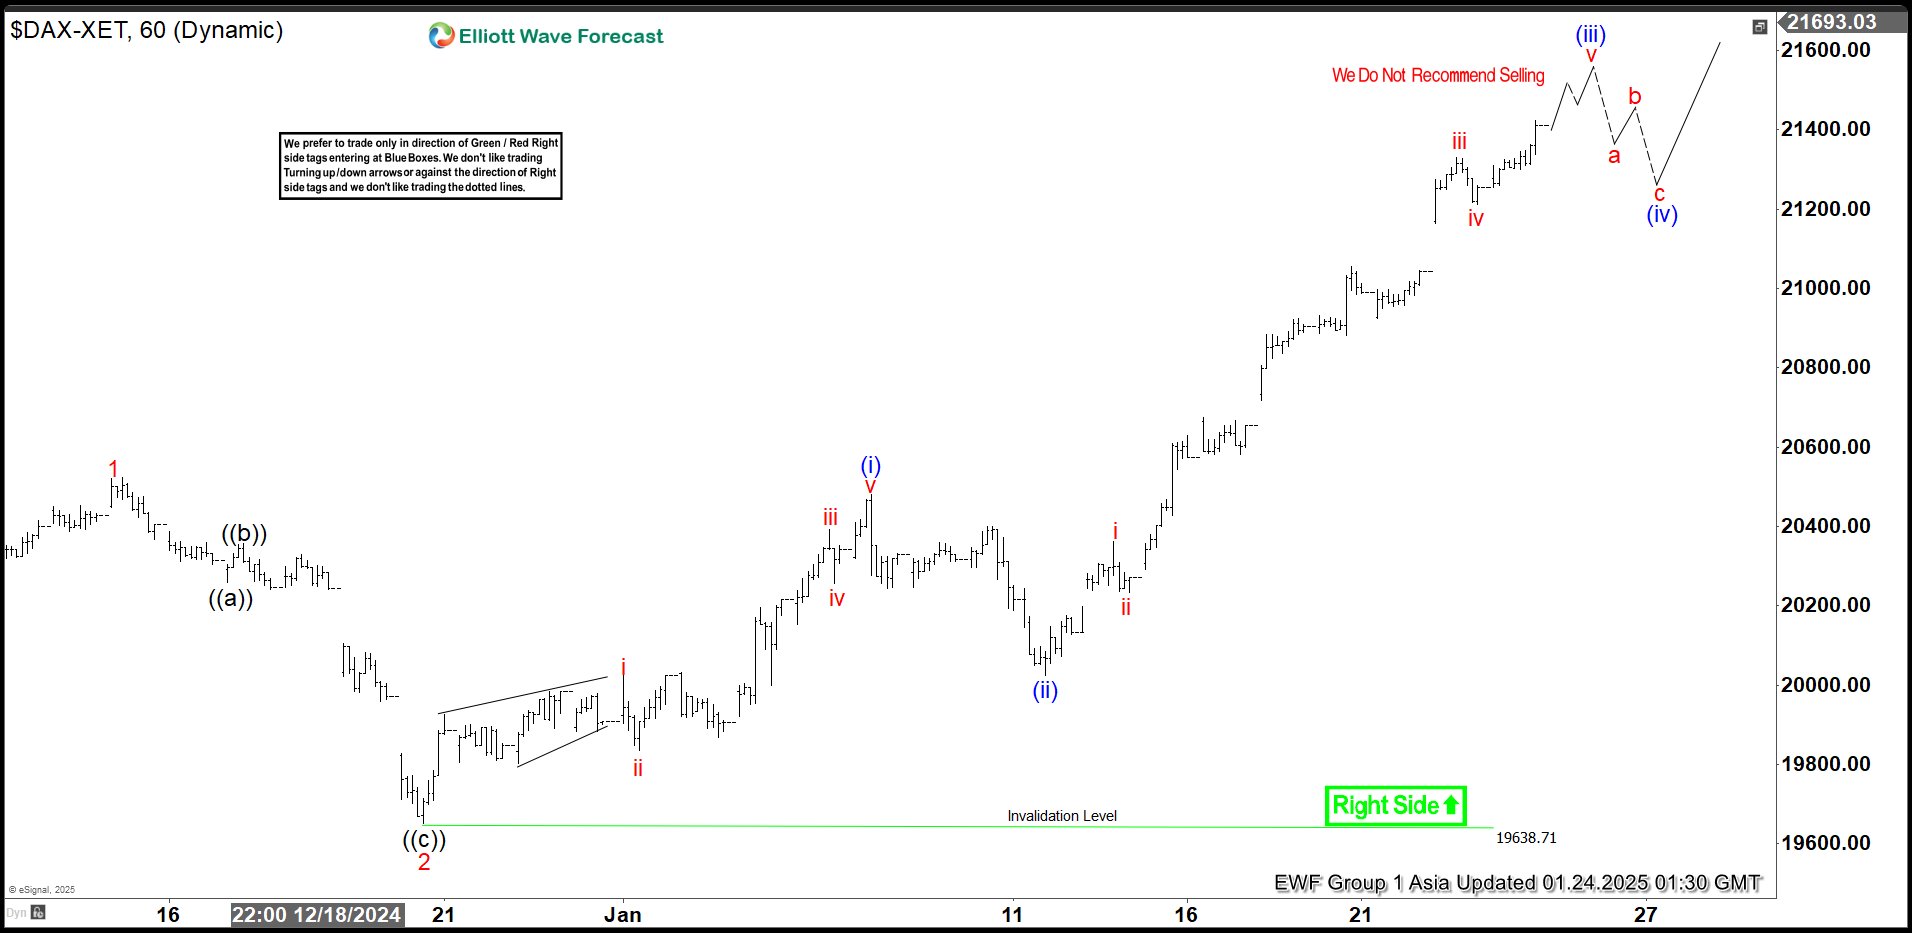
Short Term Elliott Wave View in DAX shows that the Index breaks to new all-time high confirming the right side remains bullish. The rally from 11.19.2024 low looks to be nesting in an impulsive structure. Up from 11.19.2024 low, wave 1 ended at 20522.82 and pullback in wave 2 ended at 19649.87. The Index resumed higher from there in wave 3 in a nest.
Up from wave 2, wave i ended at 20024.79 and wave ii pullback ended at 19833.82. The Index resumed higher in wave iii which ended at 20391.17. Pullback in wave iv ended at 20255.85. The final leg wave v ended at 20480.49 which also completed wave (i) in higher degree. Index then pullback in wave (ii) which ended at 20025.28. Index has resumed higher again. Up from wave (ii), wave i ended at 20362.59 and pullback in wave ii ended at 20234.26. Wave iii higher ended at 21330.87 and pullback in wave iv ended at 21212.25. Expect wave v to end soon and this should complete wave (iii) in higher degree. Afterwards, pullback in wave (iv) should find support in 3, 7, or 11 swing for further upside.
DAX 60 Minutes Elliott Wave Chart
DAX Elliott Wave Video
https://www.youtube.com/watch?v=Ck_1vh-w78w
WTI crude oil Wave Analysis
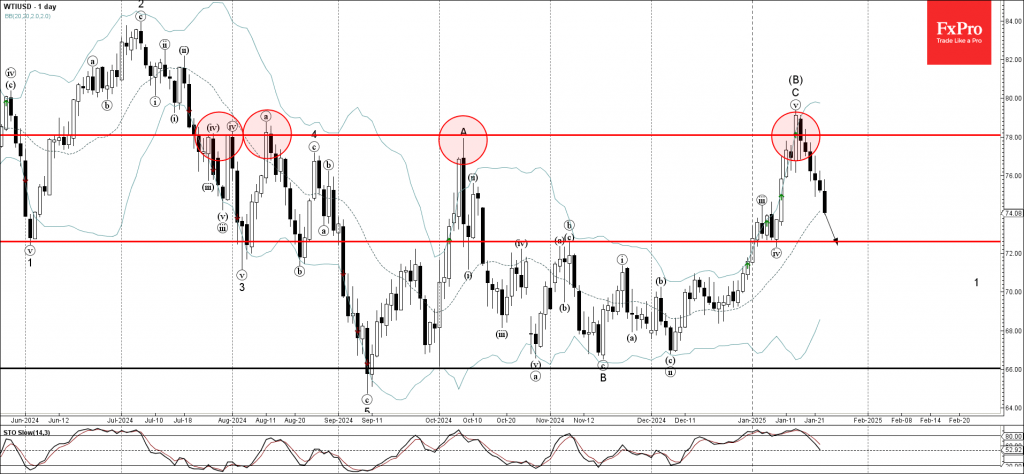
- WTI crude oil reversed from resistance level 78.00
- Likely to fall to support level 72.60
WTI crude oil recently reversed down from the major resistance level 78.00 (has been repeatedly reversing the price from July, as can be seen from the daily WTI chart below)
The downward reversal from the resistance level 78.00 started the active intermediate impulse wave (3).
WTI crude oil can be expected to fall toward the next support level 72.60 (low of the previous short-term correction iv from the start of this month).
AUDCAD Wave Analysis
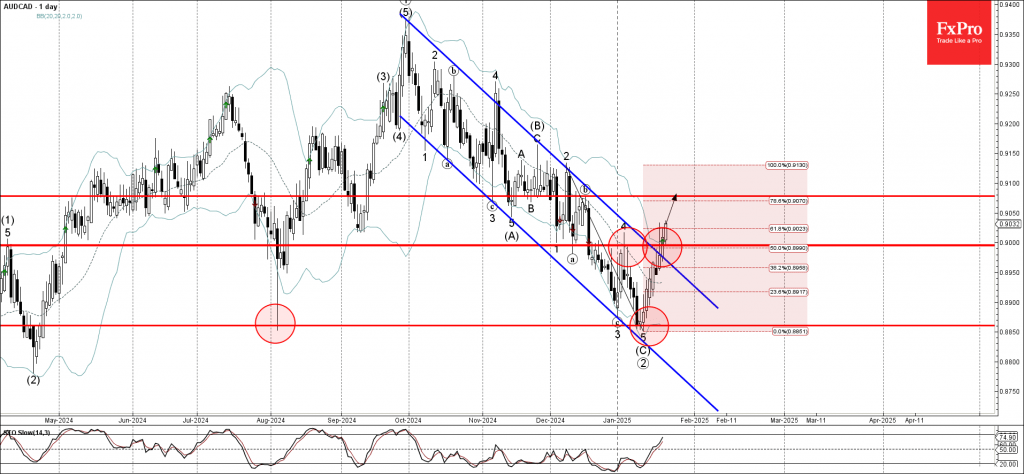
- AUDCAD broke round resistance level 0.9000
- Likely to rise to resistance level 0.9080
AUDCAD currency pair recently broke the round resistance level 0.9000 (which stopped the previous wave 4 at the start of January)
The breakout of the resistance level 0.9000 coincided with the breakout of the 50% Fibonacci correction of the previous downward impulse from December and the daily down channel from September – which accelerated the active impulse wave 1.
AUDCAD currency pair can be expected to rise toward the next resistance level 0.9080 (top of wave b from the middle of December).
Bitcoin (BTC/USD) Volatility Measures are Tightening Up. Is it Time for Another Major Move?
- Bitcoin’s price has been range-bound since reaching a fresh all-time high on inauguration day.
- The upcoming FOMC meeting may serve as a catalyst for Bitcoin’s price.
- Volatility measures suggest that a major price move is incoming.
- Bitcoin’s technical analysis shows a messy daily timeframe and a breakout of a symmetrical triangle pattern on the H2 timeframe.
Bitcoin has struggled to push on since printing a fresh high on inauguration day of around 109356. Since then the world’s largest cryptocurrency has been struggling to kick on with profit taking and caution likely to be the major factors.
There has been some positive news for the crypto industry under the new US administration. President Donald Trump chose Mark Uyeda, a Republican, to be the temporary head of the Securities and Exchange Commission. Uyeda will probably be the acting chair until Trump’s pick, Paul Atkins, is confirmed by the Senate to replace Gensler.
Both Ueda and President Trump’s pick Paul Atkins have both advocated for a business friendly approach to crypto and are seen as positive for the industry. The Securities and Exchange Commission followed this with an announcement that acting Chair Mark Uyeda has started a “crypto task force” to create clear rules for crypto assets.
Despite many of these positive developments from Tuesday onward, Bitcoin has failed to prin a new high. It begs the question, is the bull run over or what will the next catalyst be?
Crypto Heatmap, January 23, 2025
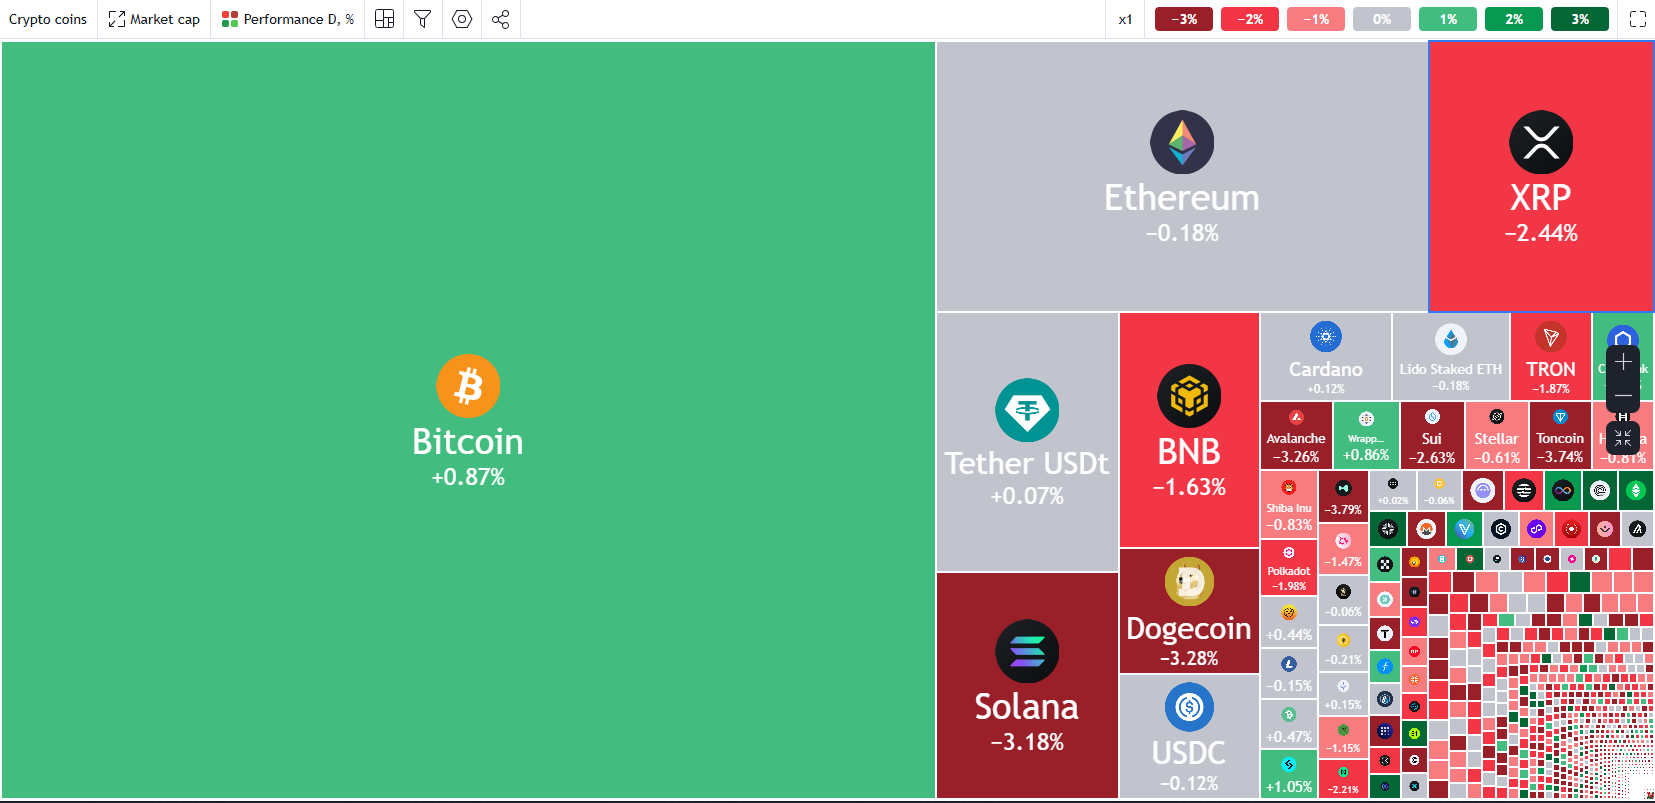
Source: TradingView (click to enlarge)
FOMC Meeting to Serve as the Catalyst?
Now that Donald Trump has taken his seat at the White House and most of the immediate crypto appointments out of the way, markets will likely shift attention to next week’s Federal Reserve meeting.
Monetary policy remains a hot topic and as we have seen in the past, lower rates do tend to help cryptomarkets as a whole. Lower rates usually means more disposable income especially for the retail crowd.
However, as things stand, the Fed are likely to maintain a slightly hawkish stance at the upcoming FOMC on January 29. The tariff proposals by President Trump that may start on February 1 coupled with encouraging data of late is likely to see the Fed remain cautious.
This may not bode particularly well for Bitcoin as higher rates means less disposable income and higher yields from traditional investments, like savings etc. which could be another challenge for crypto prices.
Volatility Measures Hint at the Potential for a Major Move
Glassnode’s recent on-chain weekly report has shed light on interesting developments around the recent Bitcoin price action and what it could mean. According to the data, both on-chain models and the narrow 60-day price range show a strong connection, helping investors anticipate periods of increased volatility.
By looking at the percentage difference between the highest and lowest prices over the last 60 days, we can track market volatility. The chart below shows times when the 60-day price range was tighter than it is now. These instances often happened before major volatility spikes, usually at the start of bull markets or before big drops in bear markets.
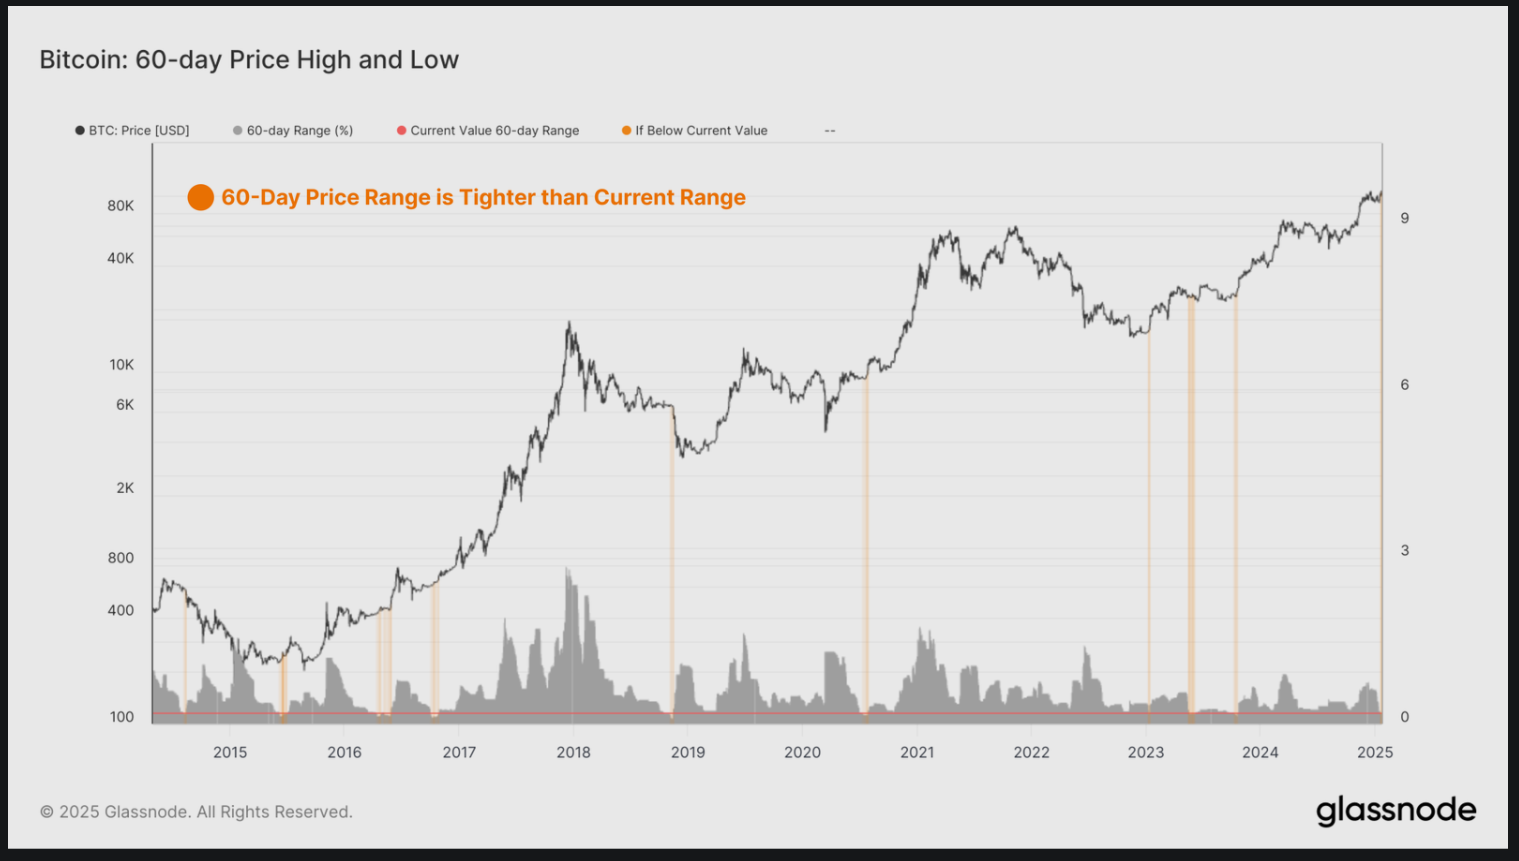
Source: Glassnode (click to enlarge)
Based on this chart, one could say that a major move is incoming. The Fed are scheduled to remain somewhat hawkish coupled with the news above and we could be in for a breakout which could favor the downside. Opposition to this could come if we do have any other crypto related posts from US President Donald Trump, which could see a rise in positive sentiment once more.
ETF Flows Remain Positive
Bitcoin ETF flows were strong in the days leading up to January 20 and have stayed strong since. This steady flow of money shows that investors are increasingly confident and interested in Bitcoin ETFs, indicating a positive outlook as the year progresses.
However despite flows of around $802 million on January 21 and $248.7 million yesterday Bitcoin continued its descent toward the 100k mark once more.
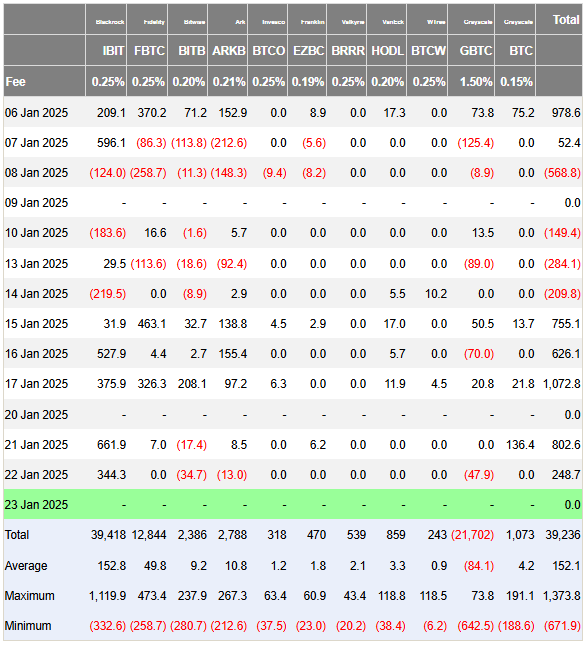
Source: Farside Investors (click to enlarge)
Looking at all the elements discussed above, there is a strong chance that the range between 100000 and 109356 remains intact over the coming days. The longer prices continue to coil in such a manner the more likely it is that an aggressive breakout will occur. The direction for now though remains up in the air.
There is another school of thought which may be key as well. Bitcoin has in many cases of late been seen as a hedge of sorts against uncertainty, almost a ‘digital gold’ if you will. Thus with more and more announcements by President Donald Trump and uncertainties increasing, this could work in Bitcoins favor and propel the Crypto to fresh highs. Something worth bearing in mind moving forward.
Technical Analysis BTC/USD
Bitcoin (BTC/USD) from a technical standpoint on the daily timeframe sees price stuck in the range between the psychological 100000 handle and the all-time highs around 109356.
We have been noticing quite a bit of whipsaw price action within the range with today’s price action being a prime example. Bitcoin hit a daily low around 101233 before bouncing aggressively to a daily high of 106848, a daily range of around $5000.
The daily timeframe being as messy as it is means a visit of a lower timeframe like the two-hour chart may be necessary.
Bitcoin (BTC/USD) Daily Chart, January 23, 2024
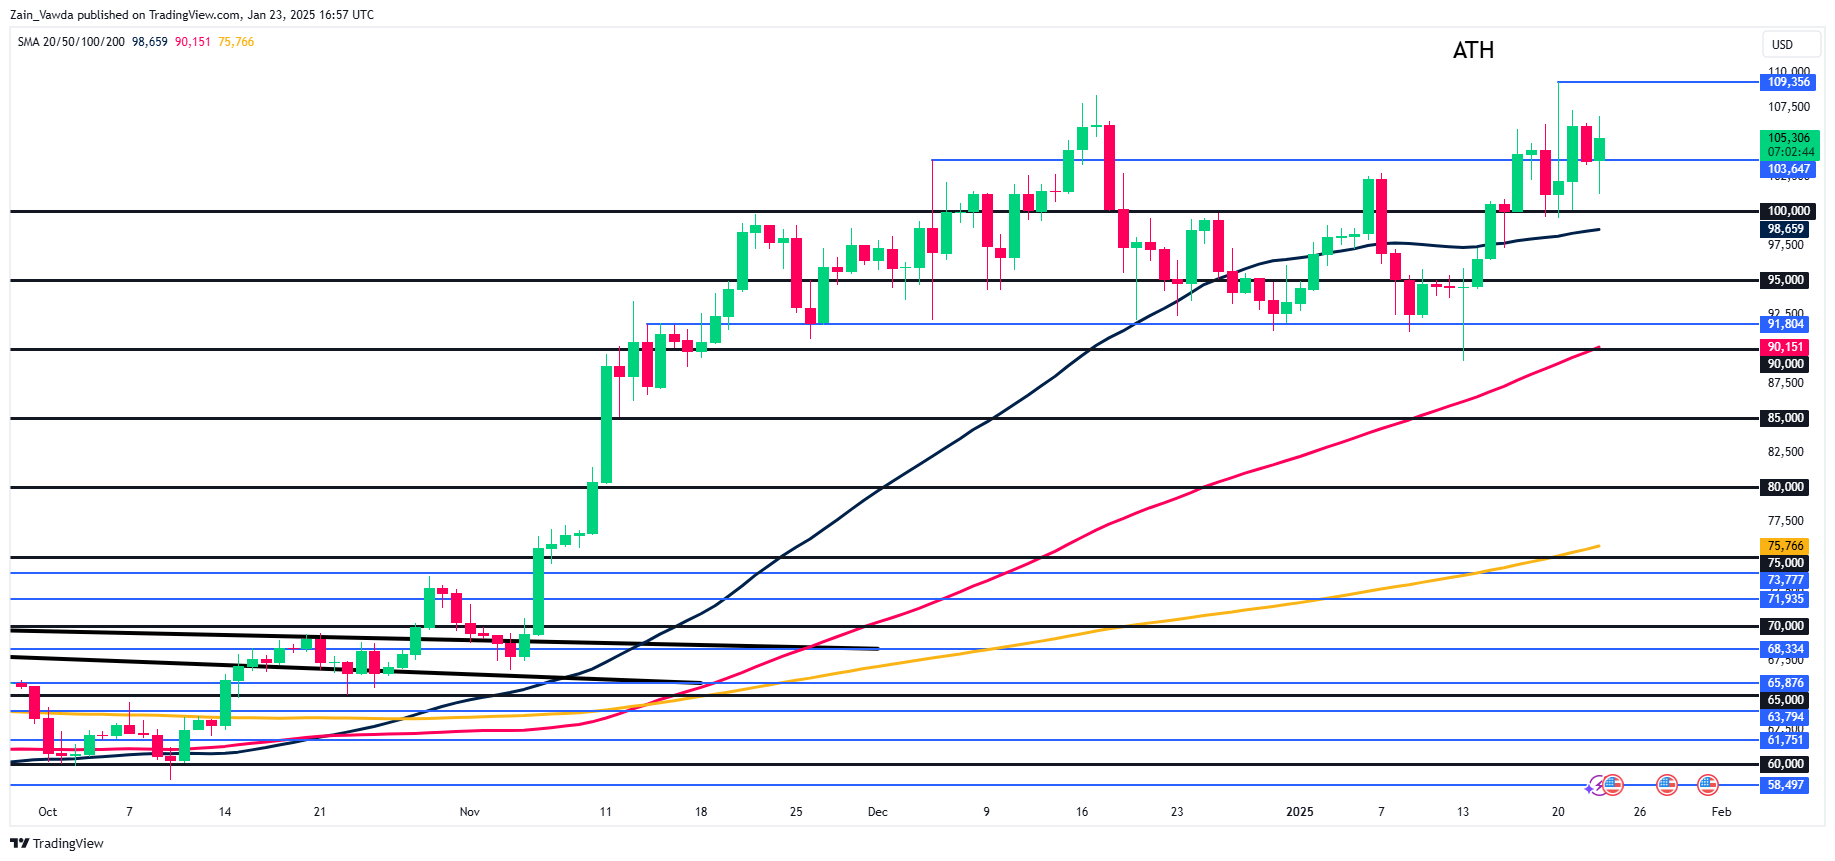
Source: TradingView.com (click to enlarge)
Dropping down to a H2 chart and as you can see below price action has also been messy with a series of lower highs and higher lows sending contradictory messaging.
We have had a breakout of the symmetrical triangle pattern in play on the H2 timeframe. Such a move should in theory lead to a rally to the upside.
The triangle mouth measures around $10,000 which would mean a rally of around $10,000 to the upside which could see Bitcoin prices reach the 115000 mark should the pattern play out.
However, with so many narratives at play there is no guarantee that such a move will play out.
Currently price is pulling back on the H2 timeframe, with immediate support provided by the 50 and 100-day MAs resting at 104062 and 103054 respectively. A break below this could open a retest of the 100000 handle.
Alternatively, should bulls take charge, immediate resistance rests at the 105000 handle before the swing high at 107000 comes into focus.
Bitcoin (BTC/USD) Two-Hour (H2) Chart, January 23, 2024
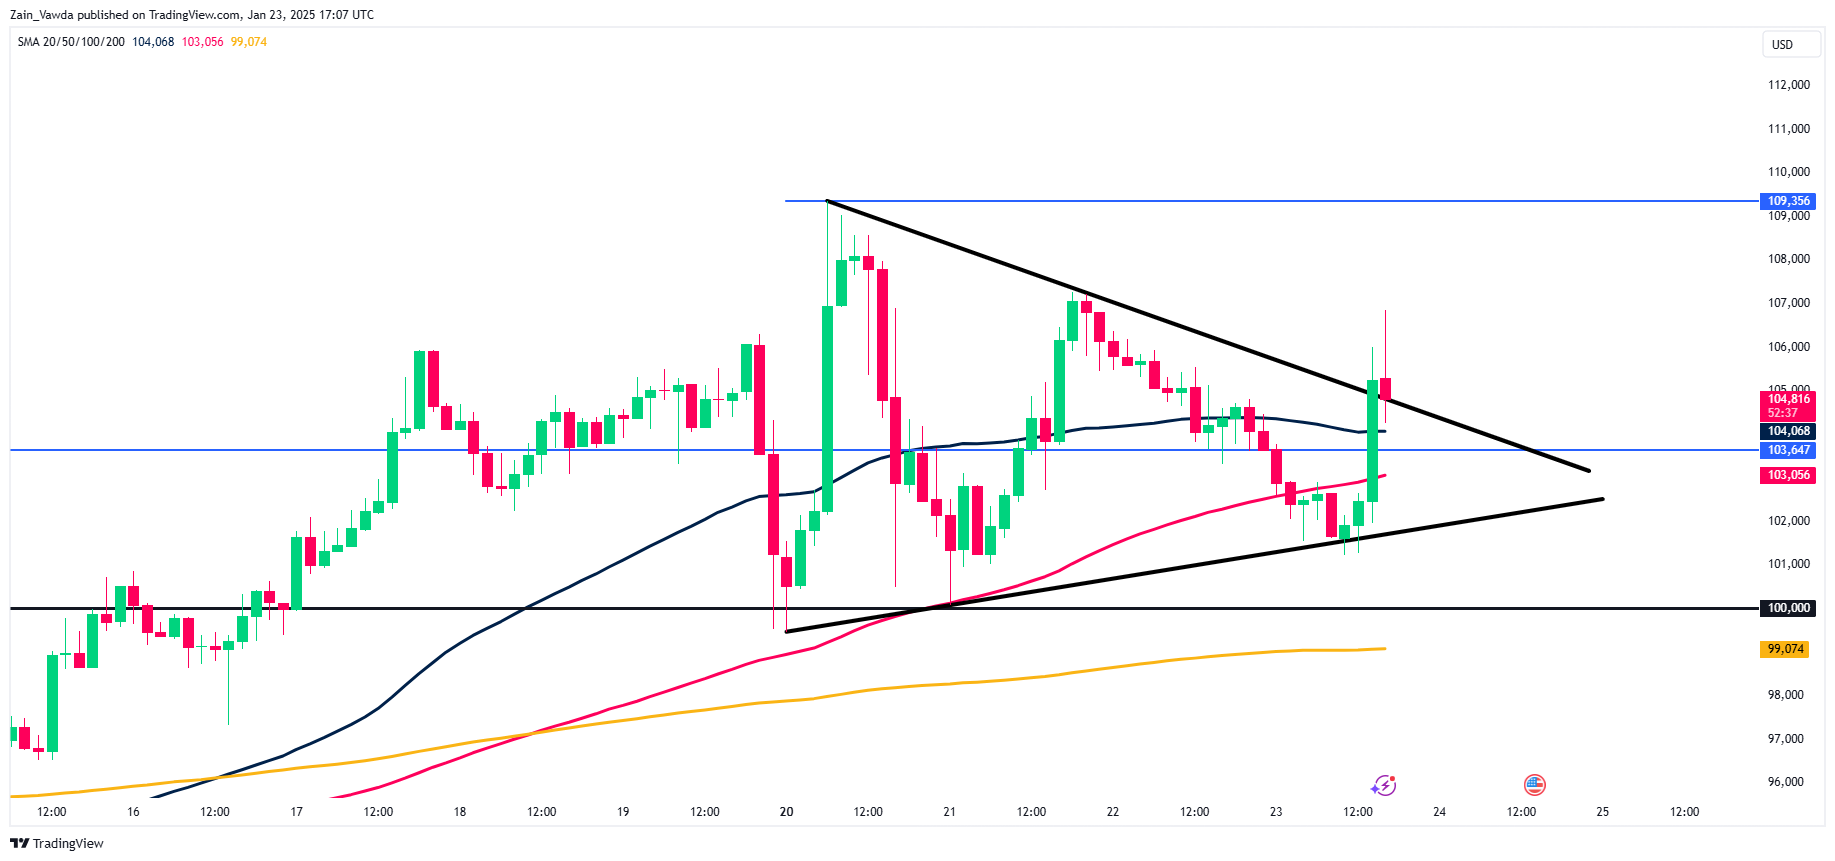
Source: TradingView.com (click to enlarge)
Support
- 104067
- 103054
- 100000
Resistance
- 105000
- 107000
- 109356
Fed Preview: Not Stealing the Spotlight
- We expect the Federal Reserve to maintain the Fed Funds Rate unchanged at 4.25-4.50% in the January meeting, in line with wide consensus and market pricing.
- The Fed communicated back in December that the January meeting would very likely mark a pause in the easing cycle. We still believe in the next cut in the following March meeting, but do not expect to hear strong forward guidance yet.
- Upcoming fiscal and trade policies are already playing a role in the participants’ projections, and Powell will remain cautious in his remarks amid the current high uncertainty. We think risks are skewed towards higher EUR/USD over the coming month, but do not expect strong reaction around the rate decision.
Incoming data has provided Powell with no reason to deviate from the course outlined in December. After reducing restraint by 100bp and as downside risks to economic growth have eased, the Fed will pause its cutting cycle in January to evaluate incoming data and not least the upcoming fiscal and trade policies from the new administration.
Trump has so far announced a likely 10% increase to tariffs against China alongside 25% for Canada and Mexico. While we believe more tariff hikes will eventually be in the pipeline, markets have found comfort in Trump avoiding more erratic changes for now. Importantly, we still have little detailed information on the other items on the fiscal policy agenda, such as the upcoming tax reform. Hence, while the December minutes revealed that some participants have already made preliminary assumptions on the policies, Powell will likely refrain from strong forward guidance for now.
We still doubt tariff hikes alone will lead to persistent boost to inflation unless they are coupled with significant easing to domestic tax policies. For now, the current level of interest rates continues to have a restrictive effect on credit growth, which is evident in low mortgage application volumes (chart 1) and weak business loan demand in the Fed’s latest SLOOS survey. Aggregate bank lending growth has stabilized close to 2.5% y/y, still clearly below the typical 5% pace observed before the pandemic.
As such, we think current rates remain somewhat above neutral. As realized inflation data has continued moderating, we think the Fed can continue cutting rates when the next round of economic forecasts is released in the March meeting. We continue to forecast quarterly 25bp cuts until the policy rate target reaches 3.00-3.25% level in March of 2026 (chart 2). We will also continue monitoring any comments about QT towards the spring, although we do not expect any exact guidance quite yet. The government debt ceiling became binding again from the start of the year, which forces the Treasury to draw down its cash balance at the Fed to fund the ongoing deficits. This will counteract most of the liquidity tightening effect from QT for next few months, but we think either tapering or even ending QT might become timely sometime during the 2nd half of 2025.
For the time being though, the Fed has little reason to shake the markets. We continue to see near-term (1-3M) downside risks to UST yields and upside risks to EUR/USD but have no strong convictions for the Wednesday evening.
ECB Preview: No New Signals
- When the ECB meets next week, the policy decision is essentially already guided, namely another 25bp cut which brings the policy rate to 2.75%. This is a unanimous expectation among analysts and markets. With the near-term uncertainties prevailing from the Trump administration as well as continuing domestic economic resilience we do not expect new signals on the policy rate outlook. Thus we expect the three-tiered reaction function to prevail (inflation outlook, underlying inflation and strength of monetary policy transmission) and the data dependency to be reiterated.
- Markets are pricing virtually another 100bp worth of rate cuts this year. While we expect the ECB to cut more than this, we see the risk of a December repeat of an initial hawkish market reaction due to Lagarde not committing to the end point of this cutting cycle may play out again.
Markets price 100bp worth of rate cuts this year
The ECB’s framework in recent quarters, focusing on data dependency and not data point dependency using its three-tiered reaction function, has led markets to trade its own narrative, as the ECB has chosen not to signal the policy outlook beyond the very near term. While it does not want to be data-point dependent, we find it difficult for the ECB not to weigh timely incoming data due to the elevated uncertainty surrounding the labour market and growth outlook. We saw it most recently in the fall last year where the weakness in European data in September / October made the ECB change the otherwise “hold guidance” to “cut guidance”, and ultimately deliver a rate cut.
Under-appreciated risk as policy level approaches neutral
During the press conference following the December meeting, Lagarde said that they didn't discuss the neutral rate level, which means they did not discuss the end point of this cutting cycle. She did, however, say that the discussion would take place once they come closer to that neutral rate level. During that occasion she repeatedly referenced the study from earlier 2024 that pointed to a range of neutral real rates between -0.5% and 0%. Lagarde also said that the conventional wisdom suggests that the neutral rate is probably a little higher than before. Assuming a 2% inflation target, that means that they would only be at neutral in June this year, if they cut 25bp at each of the four upcoming meetings. This consecutive rate cutting cycle seems to be getting a wide backing, particularly by the doves for the coming 3-4 cuts of 25bp. Villeroy, Kazimir alluded to this while Vujcic said that he is not uncomfortable with the current market pricing. Knot said he is comfortable with the market pricing for the coming two meetings but needs to see further data for decisions after that. He is not convinced that they need to go into stimulative territory. While it’s tangible for financial markets to discuss a yield level of where the cutting cycle ends, we find the key discussion to be had is what kind of policy stance is ultimately needed? We have only had limited guidance from GC members on this, with either guidance of a neutral stance or guidance of not being convinced to go into stimulative mode, however we expect this discussion to intensify in the GC after the March meeting.
Front end volatility to pick up as ECB approaches neutral rate
Looking ahead to the spring 2025 meetings we identify an under-appreciated risk to front end volatility as we discussed in COTW: The battle for April, 17.1.2025. In short, while the following claim is difficult to validate, we still argue that once you are further away from the assumed terminal rate, you will have less volatility, and this is what we have seen in the past couple of quarters with declining volatility. However, as you approach the level of the neutral rate, front-end volatility will start to pick up again. The question now becomes, at what level / distance to neutral will volatility start to pick up again?
Assuming the current SOFR pricing vs. neutral rate pricing is any guidance, the level where volatility may pick up may be about 50bp from current levels. Coincidentally, this aligns well with our view of the January and March policy rate decisions from the ECB being rather straightforward - as, after that, we are at a 2.5% policy rate, prompting a bigger battle and divergence of views for the policy decisions. This is simply due to the probability the outcome space will not be as one-sided anymore as it will be in the next two months. As a result, we expect April will be the next key battleground for policy decisions - and markets price this as well.
Lower momentum in underlying inflation continues
Since the December meeting, data has come out largely in line with the ECB’s narrative of the economy. Growth is weak but not collapsing, the labour market is resilient, and underlying inflation continues to ease. The PMIs in December rebounded partially from the significant decline in November which likely provided some relief in the ECB. In December, the composite PMI rose to 49.6 from 48.3, signalling a stagnant but not collapsing economy, driven by a larger-than-expected bounce back in services, which increased to 51.6 from 49.5, bringing services PMI back to the same level as in October. On Friday, the January PMI will be released, which is ahead of next week’s meeting, and thus will contain new information.
Headline inflation rose to 2.4% y/y from 2.2% as expected in December due to base effects on energy inflation, while the more important momentum in underlying inflation continued to move lower. Services momentum fell to 2.6% and core was below 2% for the second consecutive month at 1.8% in the 3m/3m annualised measure. Hence, December’s data confirmed the narrative of weakening momentum in underlying inflation as momentum in services is coming in lower while goods remain very low. December’s inflation figures resulted in the 2024Q4 average being marginally lower than the ECB staff predictions (0.1pp).
Labour market will be key for the ECB, but hard data is still strong
The ECB faces ongoing uncertainty regarding the labour market as survey indicators have softened in previous months. Unemployment expectations in the consumer survey jumped to a two-year high in December, and this indicator has previously led changes in the unemployment rate. However, hard data continues to show a solid labour market with rising employment in Q3 and the unemployment rate remaining at a record-low of 6.3% in November. Hence, the labour market remains very strong but forward-looking soft indicators point to risks of a deterioration.
Eventful week ahead for EUR/USD, but not because of the ECB
Next week could be another eventful one for EUR/USD. Not because of the ECB meeting since we do not expect any surprises here. (As an aside, the FOMC meeting the day before should not be a big market mover either, in our view.) But implied volatility in EUR/USD is high, because the market is anxious about what US President Trump will deliver in terms of key policies for the FX market, e.g. trade policies. He has already threatened to impose new tariffs on Canada, Mexico and China, possibly from 1 February – two days after the ECB meeting. Hence, there is a good chance that the news flow from the Trump administration will overshadow the ECB meeting, when it comes to EUR/USD. We expect EUR/USD to trade around 1.04-1.05 in the short term as we think Trump will under-deliver on some of his policy promises, but also because we think the recent US economic outperformance will fade a little.
Sunset Market Commentary
Markets
More lackluster, low volatility range trading across most major markets today. For now, visibility on the impact of the Trump policy on (global and US) growth and inflation remains too low, causing (FX and FI) investors to hold to a guarded wait-and-see approach. It is probably also too early to expect any directional guidance from the Fed when Powell comments at the press conference after next week’s policy decision. Aside from the lack of visibility on the global US-dominated picture, economic data are few and mostly second tier. Even US weekly jobless claims (223k) were too close to expectations to even trigger an small intraday move. In technical trading, US yields show a tentative steepening with the 2-y unchanged while the 30-y is adding 4.0 bps. A voluntaristic US (fiscal) policy probably put a floor for (US) yields. The digital address of US President Trump to the World Economic Forum in Davos still remains a wildcard for global markets. German yields are 2-3 bps higher in daily perspective. This week’s equity upleg, pushing (some) US and European equity indices near record levels also stalls. Investors ponder how much ‘good news’ is discounted with the issue of tariffs still looming and the Trump’s announcement of the Stargate AI project also still subject to a higher degree of uncertainty. The EuroStoxx 50 trades almost unchanged. The Nasdaq is ceding 0.3%, but the all-time top stays within reach. Low volatility trading also dominates the price action in the major (USD) cross rates. At 108.25, the USD DXY index is holding an intra-day range of less than 0.5%. EUR/USD is locked near the 1.04 big figure. The yen (USD/JPY 156.4) slightly outperforms as investors are looking forward to the BOJ taking another step in its process of policy normalization tomorrow morning. In the UK, the CBI monthly orders’ report confirmed a poor state of the manufacturing industry with the orders’ subindex holding at a low level. UK firms at the same time see rising cost pressures as higher social contributions from the UK budget are filtering through. The quarterly business optimism gauge declined to the lowest level since Q4 2022. The impact on sterling is limited. EUR/GBP hovers near recent ST top (EUR/GBP 0845 area). Among the CE currency, the zloty extends its ascent with EUR/PLN testing the early 2020 pre-covid low (EUR/PLN 4.20 area) as the NBP is expected to hold its policy rate unchanged at 5.75% still during most of this year.
News & Views
The Norges Bank kept its policy rate unchanged at 4.5%, but governor Ida Wolden Bache confirmed as expected that it will likely be reduced in March, when new growth and inflation forecasts are available. The Committee’s assessment is that a restrictive monetary policy is still needed to stabilise inflation around target, but that the time to begin easing monetary policy is soon approaching. There is substantial uncertainty about the outlook for both the global and Norwegian economy, but a rapid rise in business costs risks stoking price pressures ahead. The central bank therefore remains concerned with the risk of lowering the policy rate too quickly as it might imply inflation staying above target for even longer. The Norwegian krone is going nowhere withing the 11.50-12.00 trading band in place since August.
Turkey lowered its policy rate for a second consecutive meeting by 250 bps, from 47.50% to 45.00%. Indicators for Q4 2024 suggest that domestic demand stands at disinflationary levels. While inflation expectations and pricing behavior tend to improve, they continue to pose risks to the disinflation process. The underlying trend of inflation decreased in December but services items will likely trigger an increase in January because of time-dependent pricing and backward indexation. Core goods inflation will remain relatively low. The CBRT will maintain a tight monetary stance until price stability is achieved, suggesting that follow-up rate cuts won’t immediately increase in size. The central bank’s restrictive monetary policy managed to end the TRY-depreciation trend from the beginning of Q4 2024, but for the moment it is still trying to find a bottom rather than really recovering. EUR/TRY currently changes hands around 37.15.