Sample Category Title
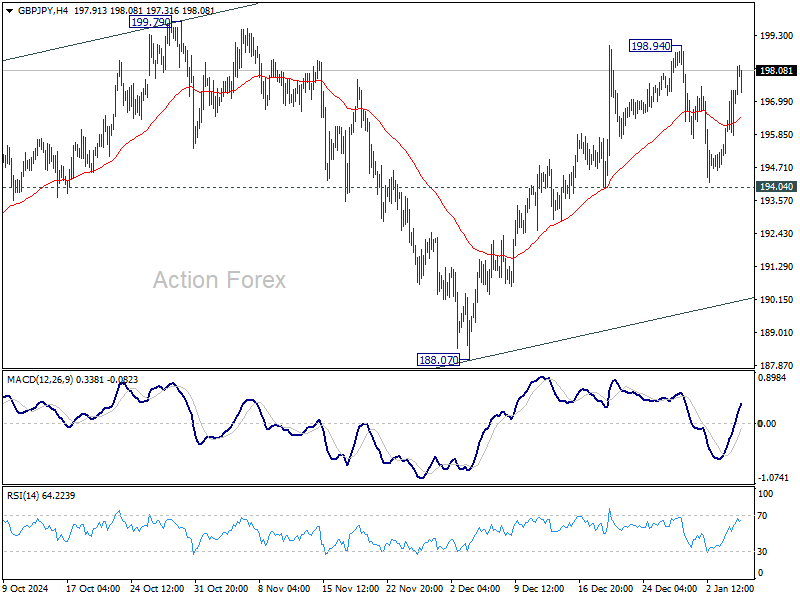
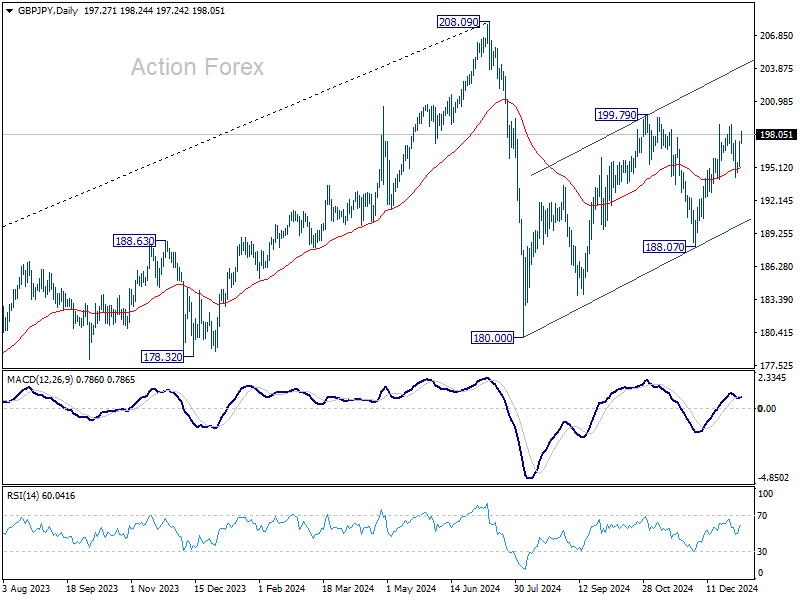
GBP/JPY Daily Outlook
Daily Pivots: (S1) 195.87; (P) 196.65; (R1) 198.14; More...
Intraday bias in GBP/JPY remains neutral and further rally is expected with 194.04 support intact. Break of 198.94 will resume the rise from 188.07, as a leg of the corrective pattern from 180.00, and target channel resistance (now at 203.90). However, firm break of 194.04 will turn bias to the downside for 188.07 support instead.
In the bigger picture, price actions from 208.09 are seen as a correction to whole rally from 123.94 (2020 low). The range of consolidation should be set between 38.2% retracement of 123.94 to 208.09 at 175.94 and 208.09. However, decisive break of 175.94 will argue that deeper correction is underway.
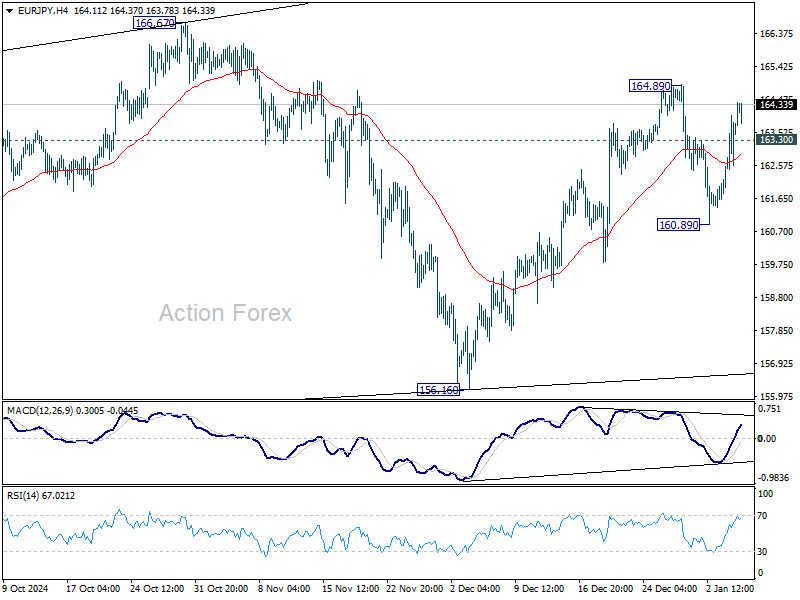
EUR/JPY Daily Outlook
Daily Pivots: (S1) 162.31; (P) 163.17; (R1) 164.64; More...
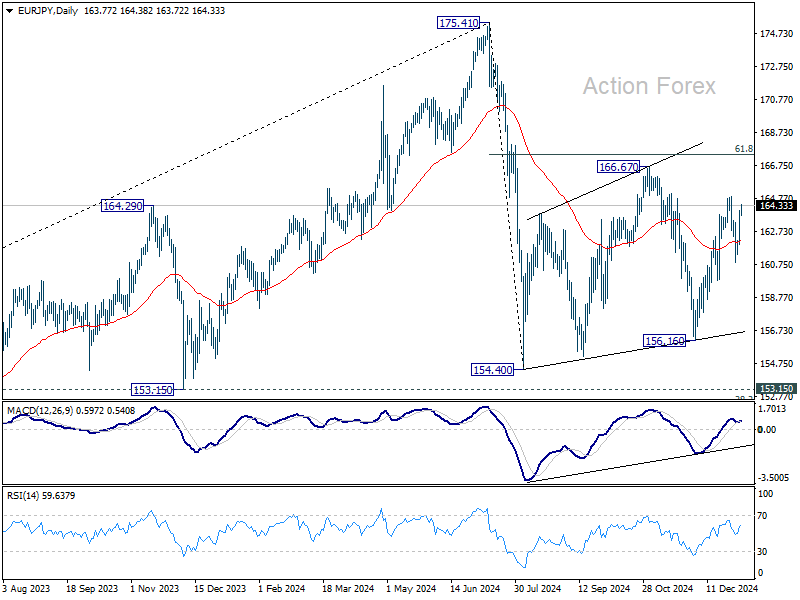
EUR/JPY's break of 163.30 minor resistance suggests that pull back from 164.98 has completed at 160.89 already. Intraday bias is back on the upside. Firm break of 164.89 will resume the rally from 156.16, as a leg of the corrective pattern from 154.40, and target 166.67. This will now remain the favored case as long as 160.89 support holds.
In the bigger picture, price actions from 175.41 are seen as correction to rally from 114.42 (2020 low). The range of consolidation should have been set between 38.2% retracement of 114.42 to 175.41 at 152.11 and 175.41 high. However, decisive break of 152.11 would argue that deeper correction is underway.
EUR/GBP Daily Outlook
Daily Pivots: (S1) 0.8284; (P) 0.8301; (R1) 0.8316; More...
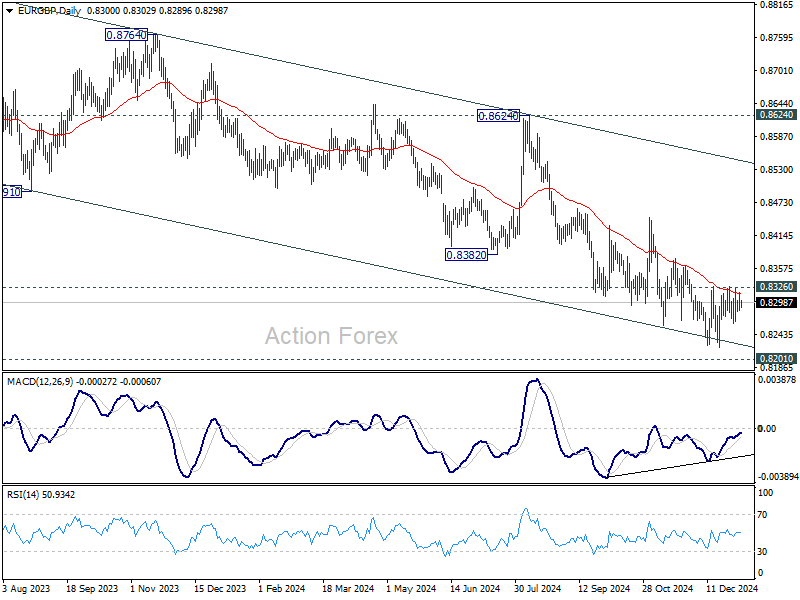
No change in EUR/GBP's outlook as range trading continues. On the upside, firm break of 0.8326 resistance will confirm short term bottoming at 0.8221, ahead of 0.8201 key support. Intraday bias will be turned back to the upside for 0.8446 structural resistance next.
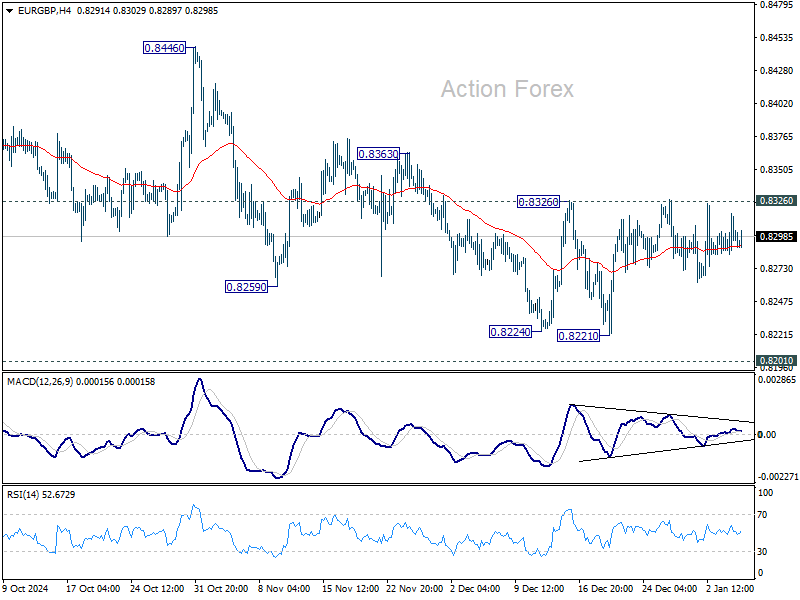
In the bigger picture, focus remains on whether 0.8201 key support (2022 low) is strong enough to complete the whole down trend from 0.9267 (2022 high). In any case, medium term outlook will be neutral at best until decisive break of 0.8624 key resistance. Risk will stay on the downside even in case of strong rebound.
EUR/AUD Daily Outlook
Daily Pivots: (S1) 1.6555; (P) 1.6604; (R1) 1.6685; More...
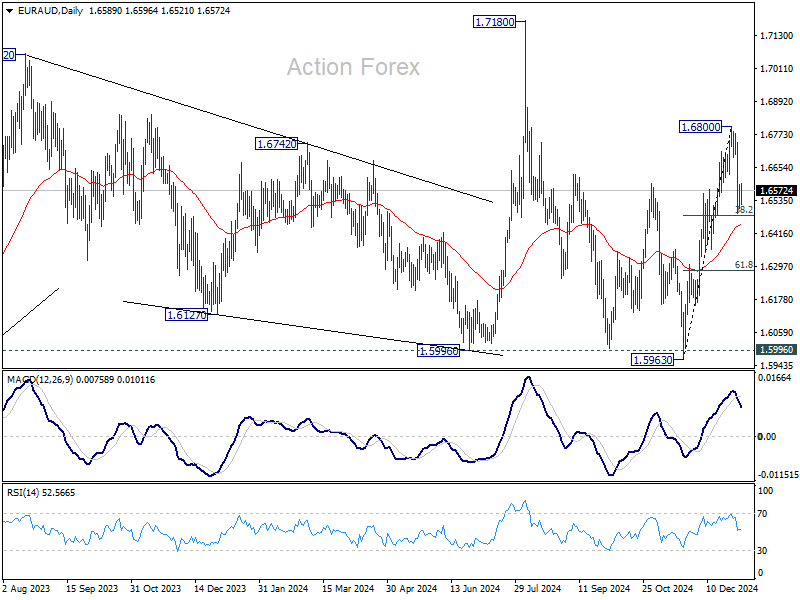
Intraday bias in EUR/AUD is turned neutral with current recovery. Corrective pattern from 1.6800 could extend further. But strong support could be seen from 38.2% retracement of 1.5963 to 1.6800 at 1.6480 to bring rebound. But near term risk will stay mildly on the downside as long as 1.6800 resistance holds, in case of extended recovery. Firm break of 1.6480 will bring deeper correction 61.8% retracement at 1.6283.
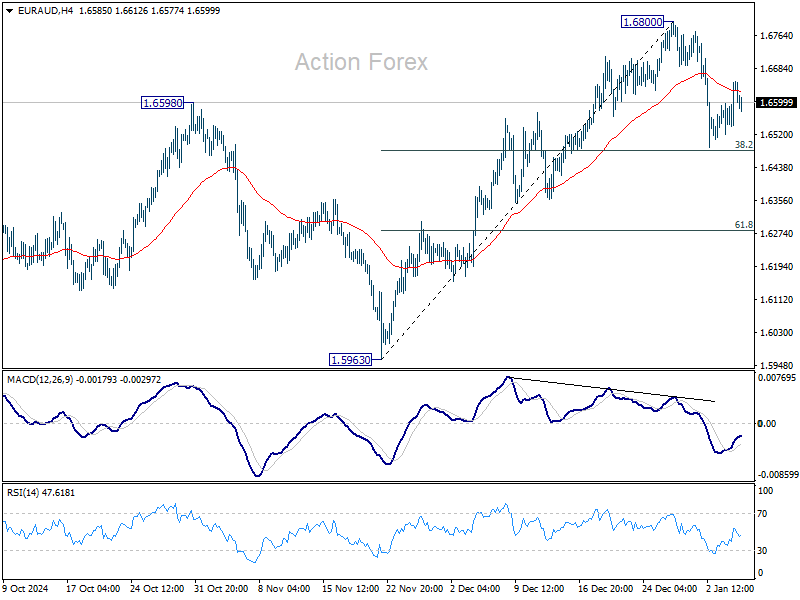
In the bigger picture, EUR/AUD is holding on to 1.5996 key support despite brief breach. Larger up trend from 1.4281 (2022 low) is still in favor to resume through 1.7180 at a later stage. Nevertheless, sustained break of 1.5995 will indicate that such up trend has completed and deeper decline would be seen.
EUR/CHF Daily Outlook
Daily Pivots: (S1) 0.9366; (P) 0.9388; (R1) 0.9420; More....
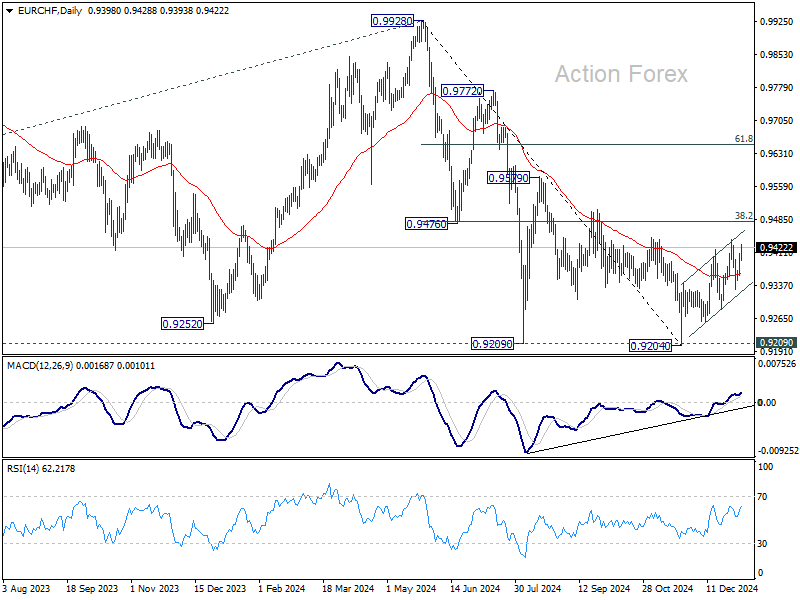
EUR/CHF's corrective rebound from 0.9204 could still extend higher through 0.9440. But upside should be limited by 0.9481 fibonacci resistance. On the downside, firm break of 0.9329 support will argue that the correction has completed, and bring retest of 0.9204 low.
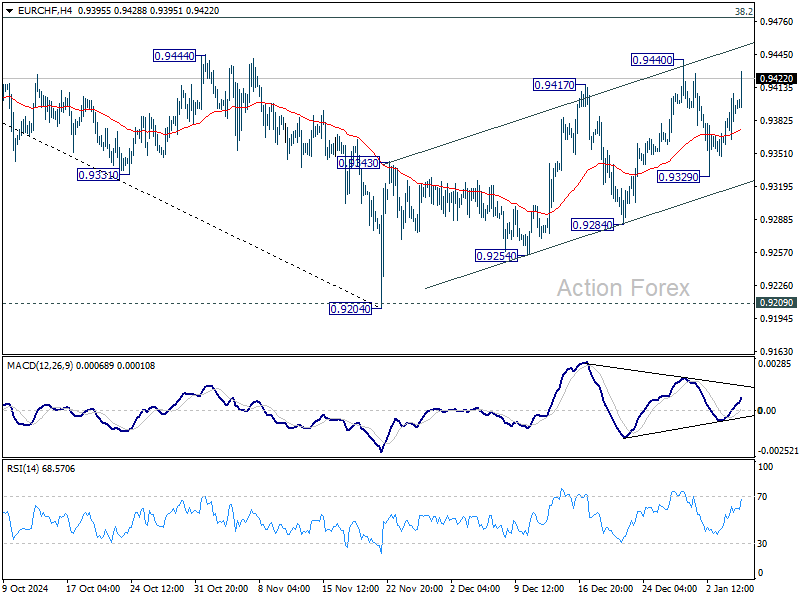
In the bigger picture, while rebound from 0.9204 might extend higher, strong resistance could be seen from 38.2% retracement of 0.9928 to 0.9204 at 0.9481 to limit upside. Down trend from 0.9928 (2024 high) is still in favor to resume through 0.9204/9 support zone at a later stage.
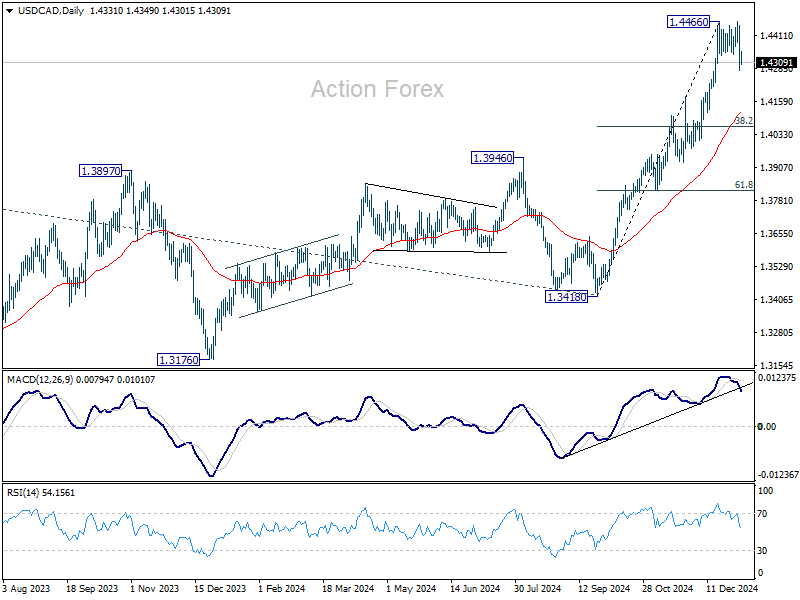
USD/CAD Daily Outlook
Daily Pivots: (S1) 1.4257; (P) 1.4355; (R1) 1.4429; More...
Intraday bias in USD/CAD remains on the downside for the moment. Pull back from 1.4466 short term top could extend lower to 55 D EMA (now at 1.4120). But downside should be contained by 38.2% retracement of 1.3418 to 1.4466 at 1.4066 to bring rebound. For now, risk of more consolidations remains as long as 1.4466 holds, in case of recovery.
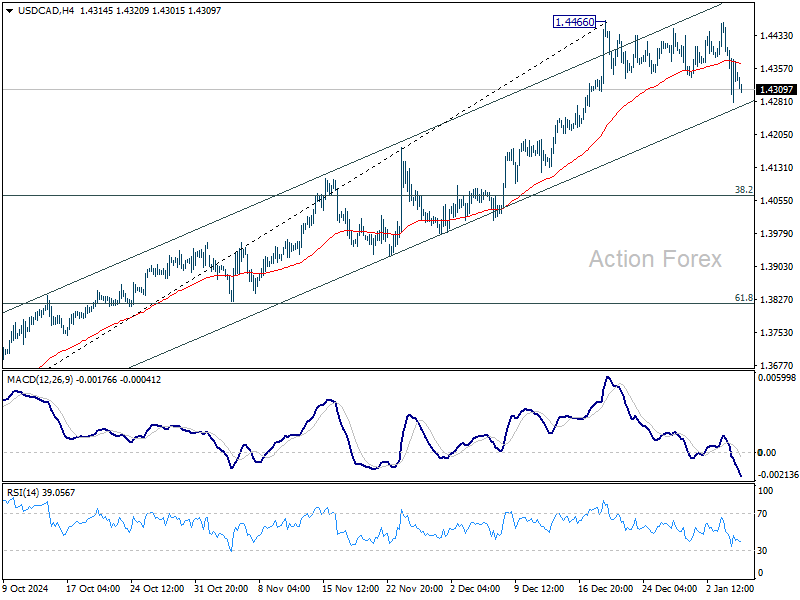
In the bigger picture, up trend from 1.2005 (2021) is in progress for retesting 1.4667/89 key resistance zone (2020/2015 highs). Medium term outlook will remain bullish as long as 1.3976 resistance turned holds (2022 high), even in case of deep pullback.
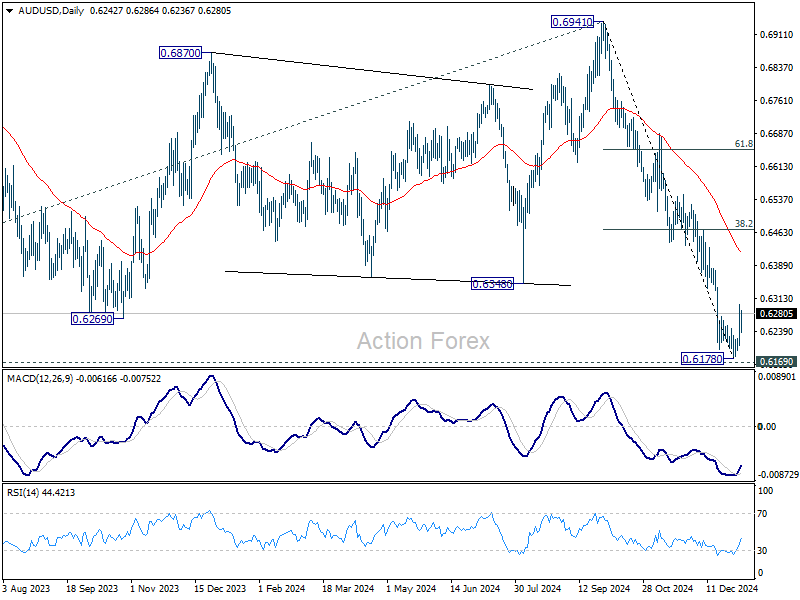
AUD/USD Daily Report
Daily Pivots: (S1) 0.6201; (P) 0.6251; (R1) 0.6296; More...
Intraday bias in AUD/USD stays mildly on the upside for the moment, and further rebound would be seen to 55 D EMA (now at 0.6418). But near term outlook will stay bearish as long as 38.2% retracement of 0.6941 to 0.6178 at 0.6469. For now, more consolidation is in favor in the near term as long as 0.6178 holds, in case of retreat.
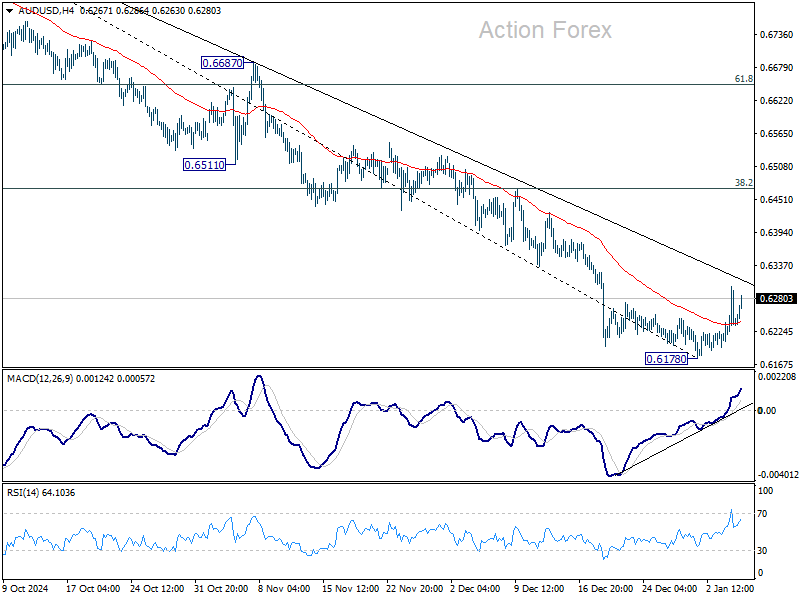
In the bigger picture, price actions from 0.6169 (2022 low) are seen as a medium term consolidation to the down trend from 0.8006, and could have completed at 0.6941 already. Firm break of 0.6169 support will confirm down trend resumption for 61.8% projection of 0.8006 to 0.6169 from 0.6941 at 0.5806 next. In any case, outlook will stay bearish as long as 55 W EMA (now at 0.6587) holds.
GBP/USD Recovers as EUR/GBP Starts Consolidation
GBP/USD is attempting a recovery wave above the 1.2500 resistance. EUR/GBP is consolidating and might aim for a fresh increase above 0.8320.
Important Takeaways for GBP/USD and EUR/GBP Analysis Today
- The British Pound is attempting a fresh increase above 1.2420.
- There was a break above a key bearish trend line with resistance at 1.2455 on the hourly chart of GBP/USD at FXOpen.
- EUR/GBP is trading in a bearish zone below the 0.8330 pivot level.
- There is a short-term contracting triangle forming with resistance near 0.8305 on the hourly chart at FXOpen.
GBP/USD Technical Analysis
On the hourly chart of GBP/USD at FXOpen, the pair declined after it failed to clear the 1.2600 resistance. As mentioned in the previous analysis, the British Pound even traded below the 1.2500 support against the US Dollar.
Finally, the pair tested the 1.2350 zone and is currently attempting a fresh increase. The bulls were able to push the pair above the 50-hour simple moving average and 1.2450. The pair even climbed above the 1.2500 level.
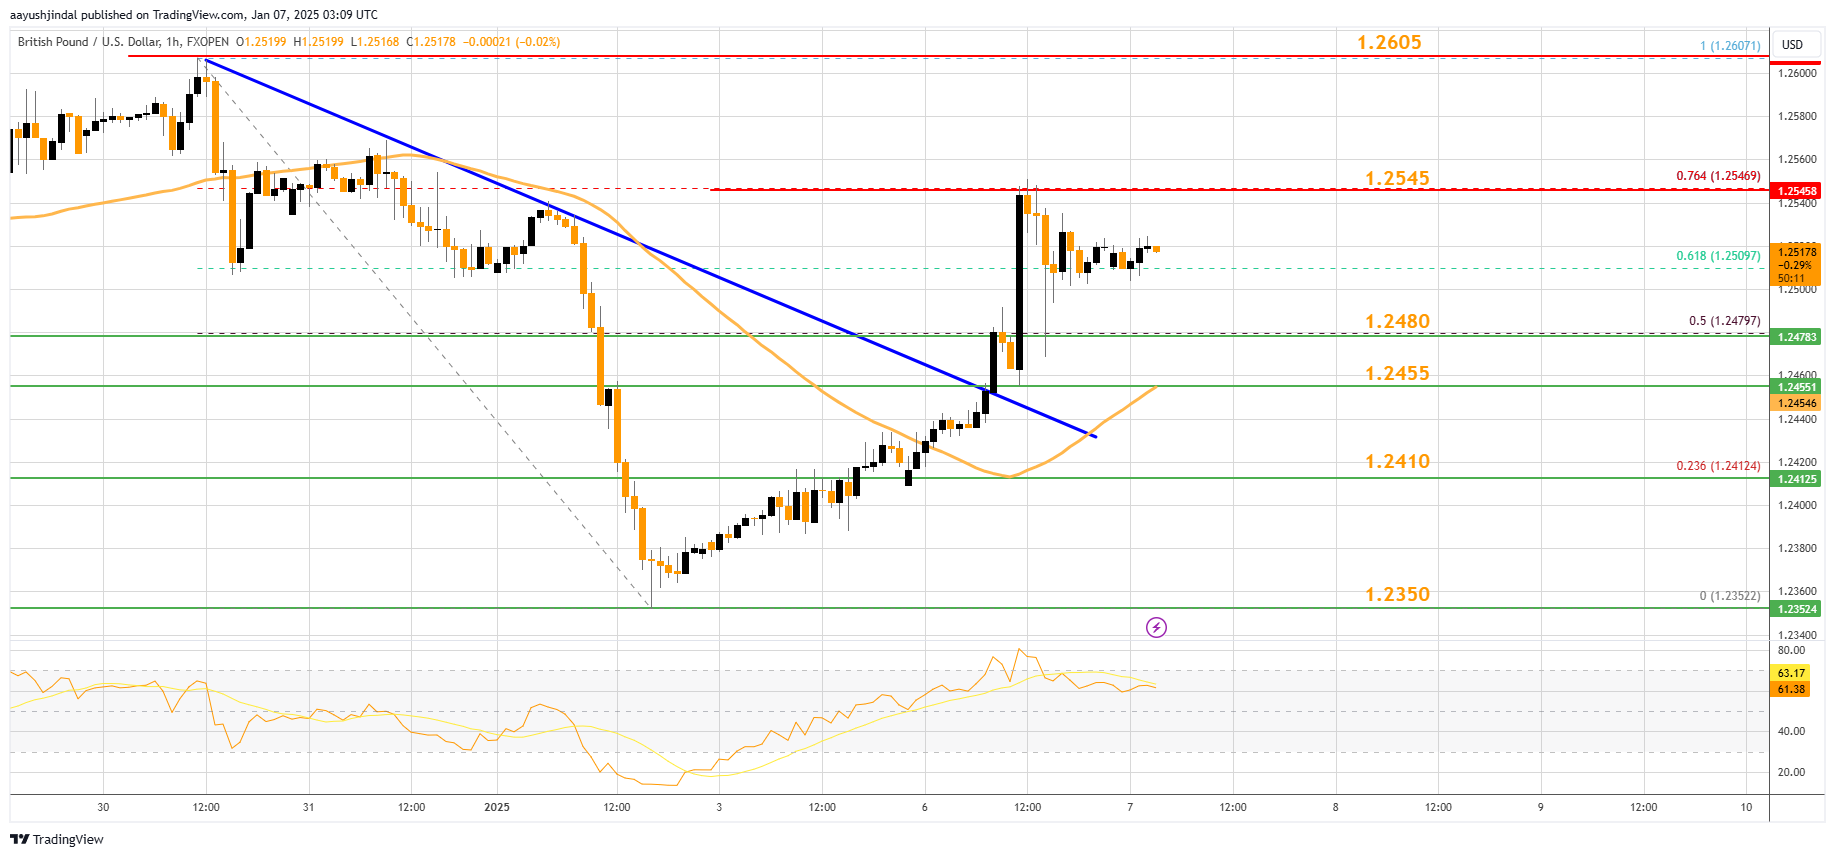
There was a break above a key bearish trend line with resistance at 1.2455. The pair climbed above the 50% Fib retracement level of the downward move from the 1.2607 swing high to the 1.2352 low.
On the upside, the GBP/USD chart indicates that the pair is facing resistance near 1.2545 or the 76.4% Fib retracement level of the downward move from the 1.2607 swing high to the 1.2352 low. The next major resistance is near 1.2605.
A close above the 1.2605 resistance zone could open the doors for a move toward 1.2650. Any more gains might send GBP/USD toward 1.2750.
On the downside, there is decent support forming at 1.2480. If there is a downside break below 1.2480, the pair could accelerate lower. The first major support is near the 1.2455 level. The next key support is seen near 1.2410, below which the pair could test 1.2350. Any more losses could lead the pair toward the 1.2220 support.
EUR/GBP Technical Analysis
On the hourly chart of EUR/GBP at FXOpen, the pair started a consolidation phase after it failed to surpass 0.8330. The Euro traded below the 0.8320 and 0.8300 support levels against the British Pound.
The EUR/GBP chart suggests that the pair even declined below the 50% Fib retracement level of the upward move from the 0.8275 swing low to the 0.8317 high. It is now consolidating losses and trading below the 50-hour simple moving average.
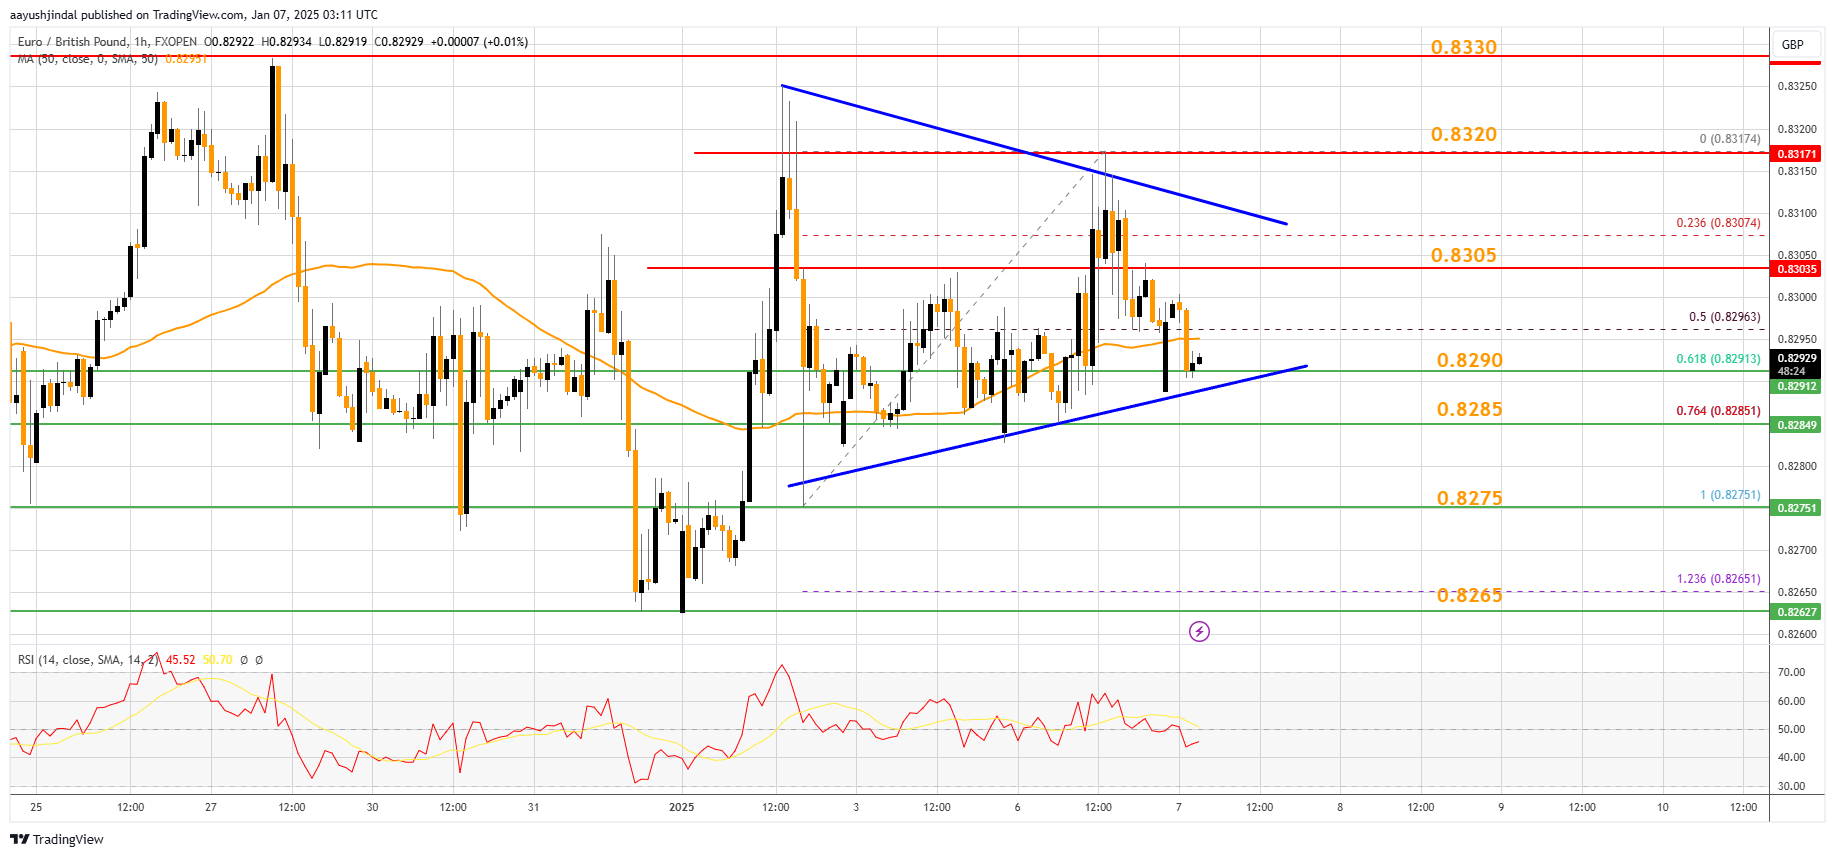
The pair is now facing resistance near the 0.8305 level. There is also a short-term contracting triangle forming with resistance near 0.8305.
The next major resistance could be 0.8320. The main resistance is near the 0.8330 zone. A close above the 0.8330 level might accelerate gains. In the stated case, the bulls may perhaps aim for a test of 0.8380. Any more gains might send the pair toward the 0.8400 level.
Immediate support sits near 0.8290. The next major support is near 0.8285 or the 76.4% Fib retracement level of the upward move from the 0.8275 swing low to the 0.8317 high.
A downside break below the 0.8285 support might call for more downsides. In the stated case, the pair could drop toward the 0.8265 support level.
Trade over 50 forex markets 24 hours a day with FXOpen. Take advantage of low commissions, deep liquidity, and spreads from 0.0 pips. Open your FXOpen account now or learn more about trading forex with FXOpen.
This article represents the opinion of the Companies operating under the FXOpen brand only. It is not to be construed as an offer, solicitation, or recommendation with respect to products and services provided by the Companies operating under the FXOpen brand, nor is it to be considered financial advice.
Crypto Climbing
Market Picture
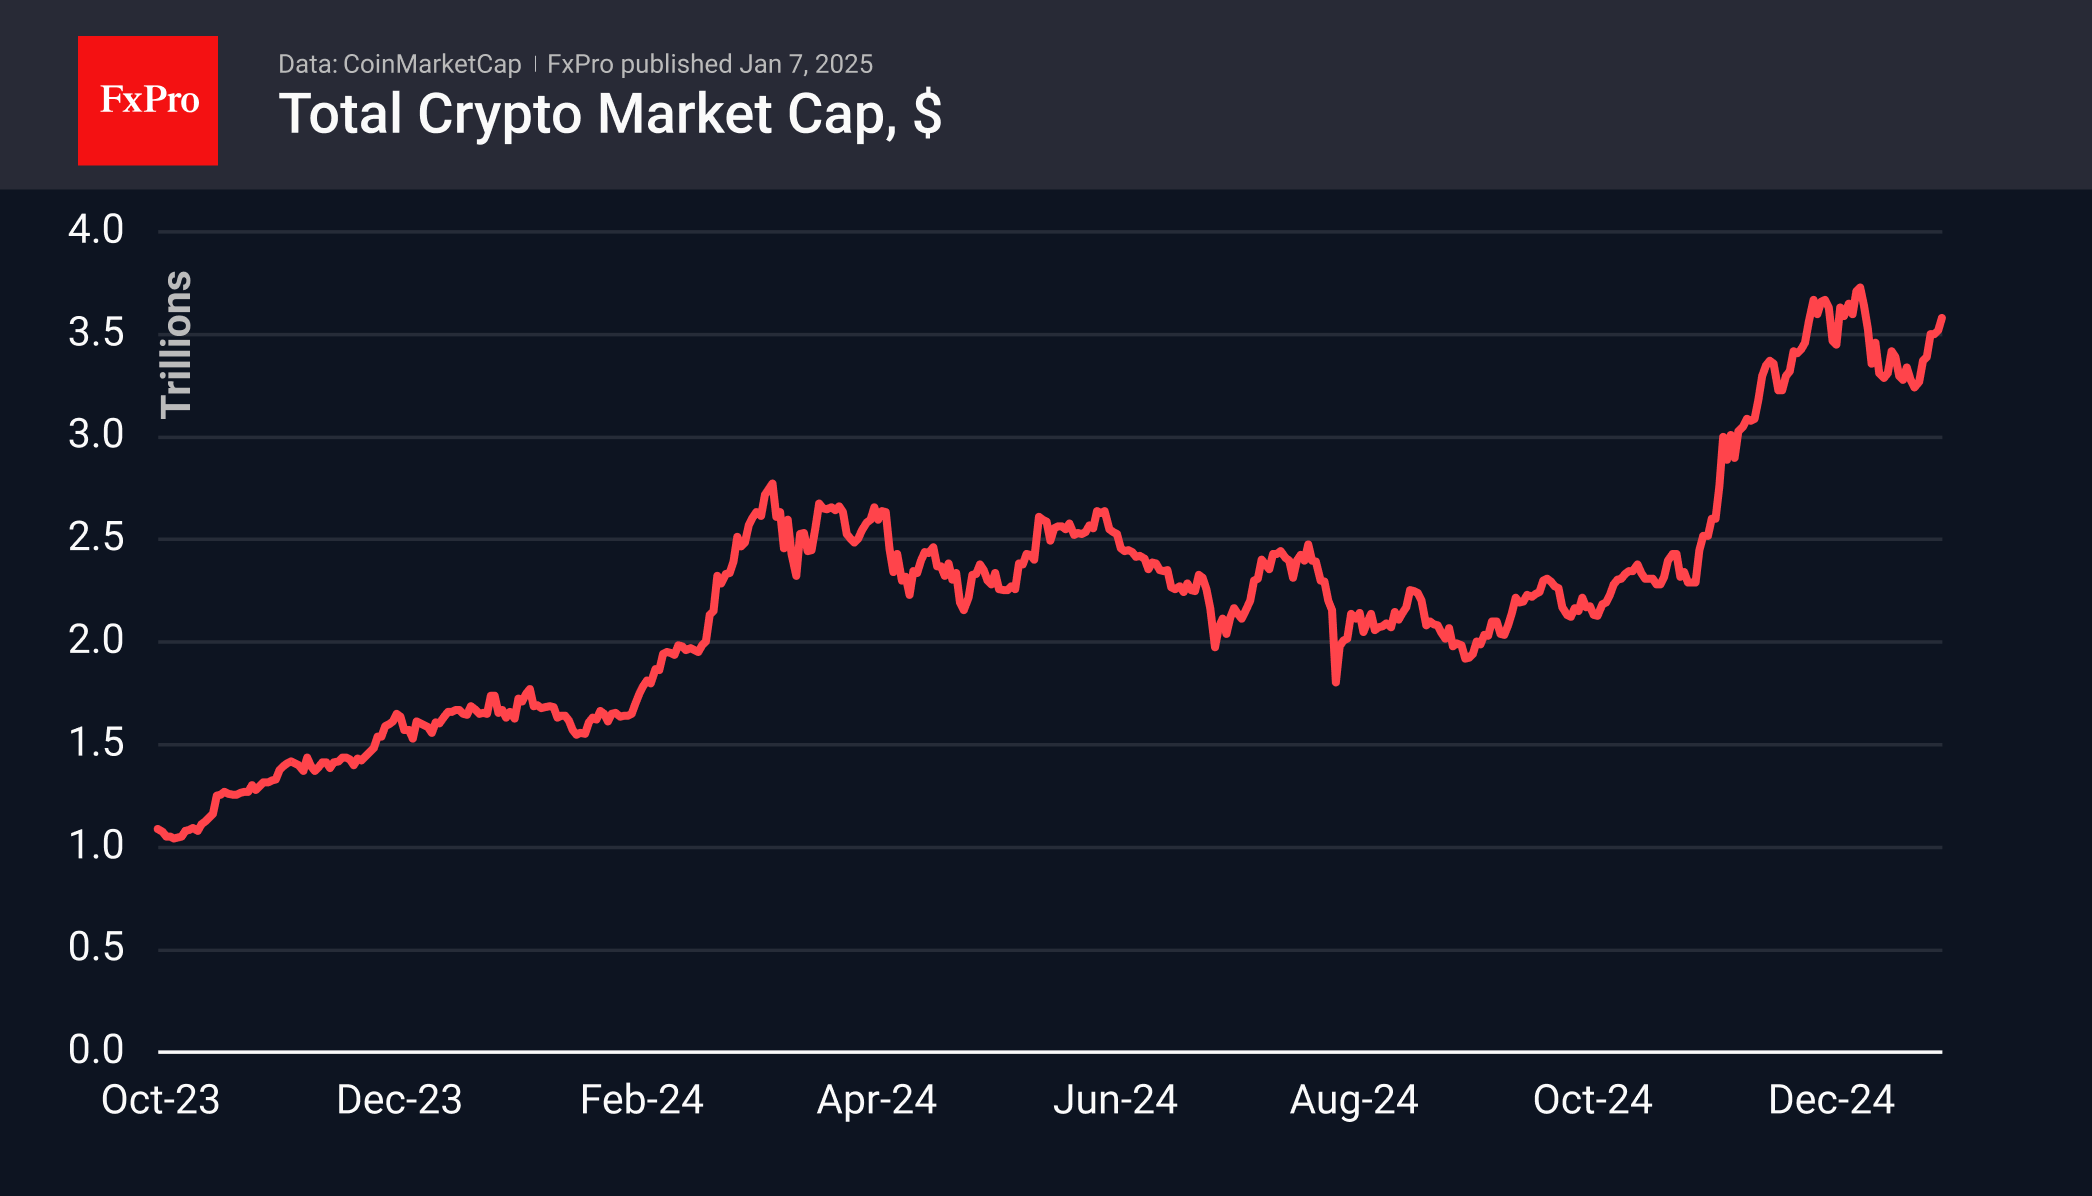
The crypto market has been on the rise since the beginning of the year. The 1.25% gain on the last day brought the gain since the beginning of January to 10%. At the current level of $3.58 trillion, the market has recovered around two-thirds of the losses since peaking at around $3.80 in mid-December. Interestingly, the market is not currently being held back by growing expectations of tighter monetary policy from the Fed.
The cryptocurrency Fear and Greed Index is back in extreme greed territory at 78. That’s high enough to indicate active buying interest but not too hot, leaving room for upside.
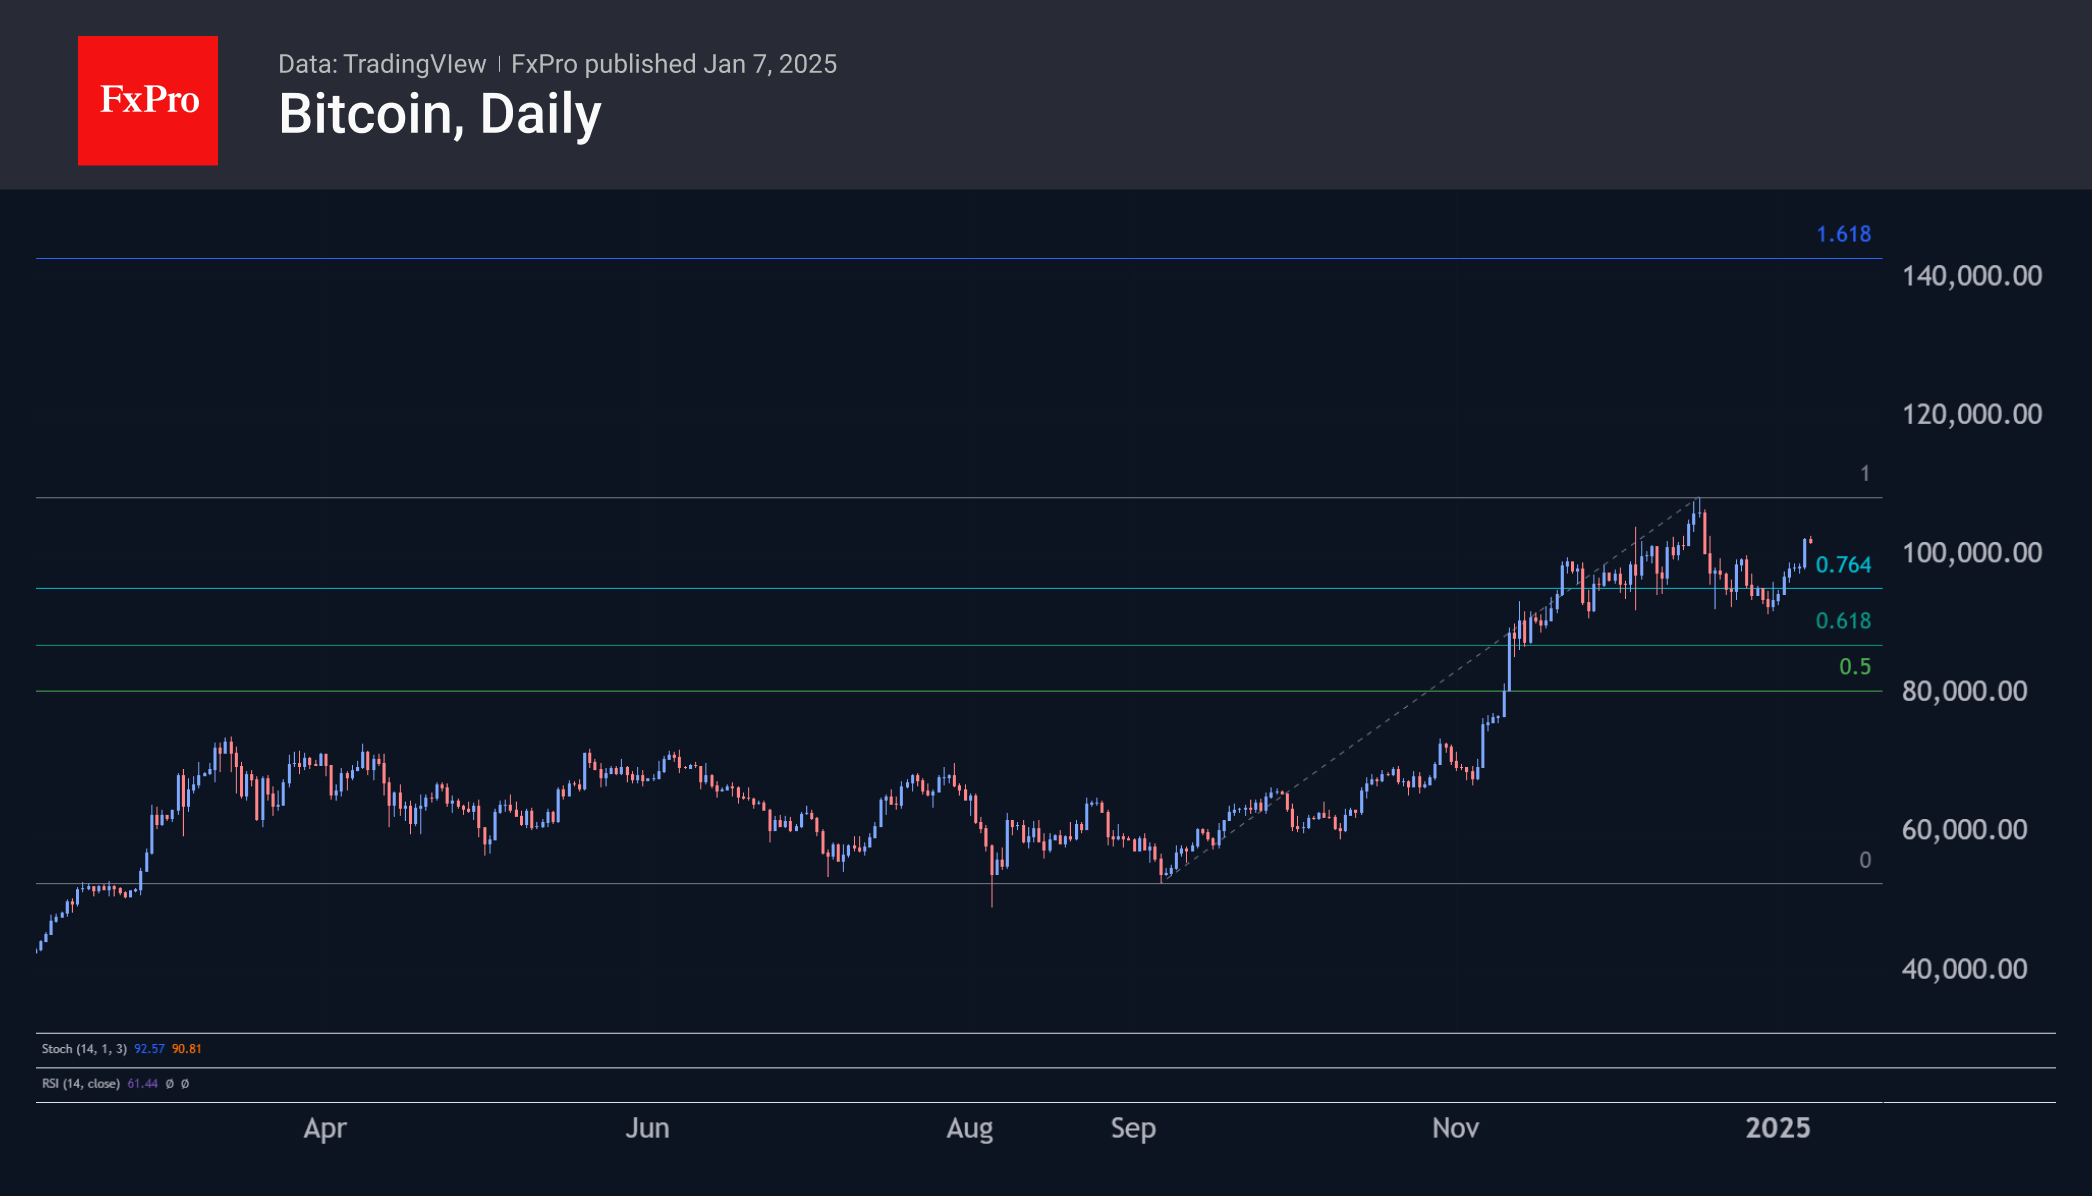
Bitcoin passed the $100K mark and climbed above $102K late on Monday. After rallying since early November, the first cryptocurrency completed a classic Fibonacci retracement and returned to growth. A break above the $110K level will initiate an expansion pattern with an upside potential of $134K.
News Background
According to CoinShares, global investment in crypto funds reached a record $44.2 billion in 2024, almost four times the previous record set in 2021. Bitcoin investment grew by $38 billion over the year and Ethereum by $4.9 billion.
Among other altcoins, $438 million went into XRP funds, $69 million into Solana and $53 million into Litecoin.
MicroStrategy bought 2,138 BTC for $209 million last week at an average price of around $97,837 per coin. The company holds 446,400 BTC on its balance sheet at an average price of $62,428.
Traders are focusing on call options with a strike price of $120,000. Key market catalysts are Trump’s inauguration on the 20th and the Fed’s rate decision on the 29th.
Miner MARA directed 7,377 BTC, or 16.4% of its bitcoin reserves, to cryptocurrency lending services to generate ‘modest’ additional income. The expected return on the contracts does not exceed 10% per year.
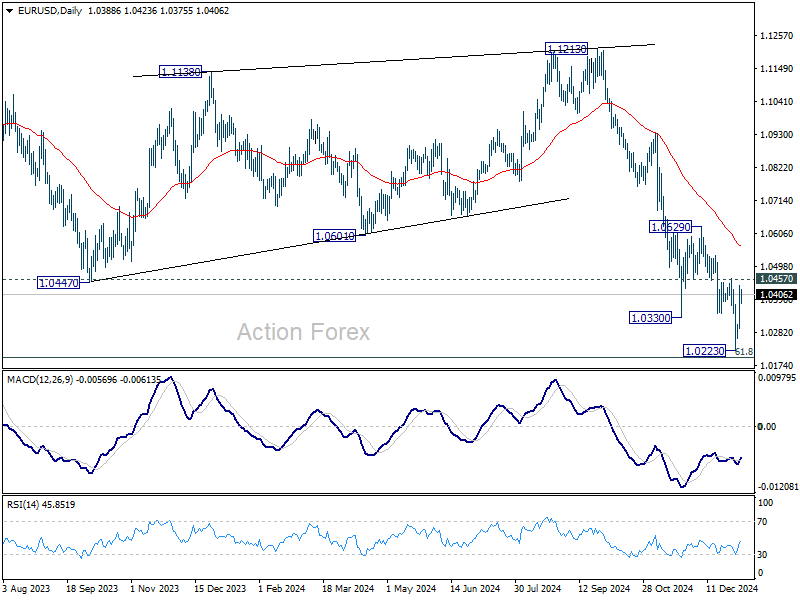
EUR/USD Daily Outlook
Daily Pivots: (S1) 1.0312; (P) 1.0374; (R1) 1.0453; More...
Intraday bias in EUR/USD remains neutral and some more consolidations could be seen above 1.0223. But further decline remains in favor as long as 1.0457 resistance holds. Firm break of 1.0223 will resume the fall from 1.1213 to 61.8% projection of 1.1213 to 1.0330 from 1.0629 at 1.0083. However, sustained break of 1.0457 will confirm short term bottoming, and turn bias to the upside for 55 D EMA (now at 1.0562).
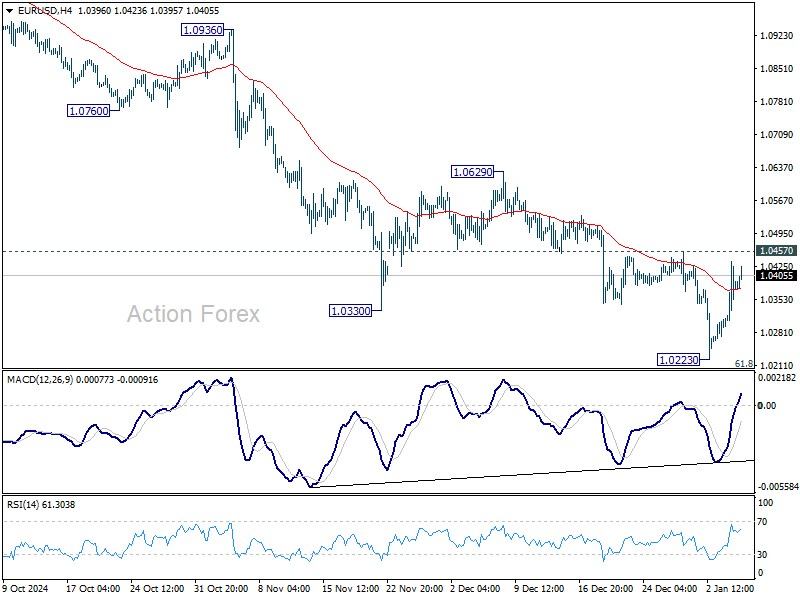
In the bigger picture, fall from 1.1274 (2023 high) should either be the second leg of the corrective pattern from 0.9534 (2022 low), or another down leg of the long term down trend. In both cases, sustained break of 61.8 retracement of 0.9534 to 1.1274 at 1.0199 will pave the way back to 0.9534. For now, outlook will stay bearish as long as 1.0629 resistance holds, even in case of strong rebound.