Sample Category Title
XBR/USD Analysis: Brent Oil Price Soars After Attack on Israel
Following Israel's military operation in Lebanon, Iran launched a missile strike on Israel on October 1. Financial markets reacted sharply as soon as the first reports of the attack emerged:
→ U.S. stock indices dropped significantly, and Bitcoin also fell, with BTC/USD nearing the psychological $60,000 mark at yesterday's low.
→ Gold surged to $2670, though supply forces have since curbed the panic buying, and XAU/USD has dropped back below $2650.
Oil prices also spiked. Unlike other financial assets, there has been no correction on the XBR/USD chart today, despite the end of the missile strike on Israel. This highlights oil's heightened sensitivity to Middle Eastern tensions.
According to today’s technical analysis of XBR/USD:
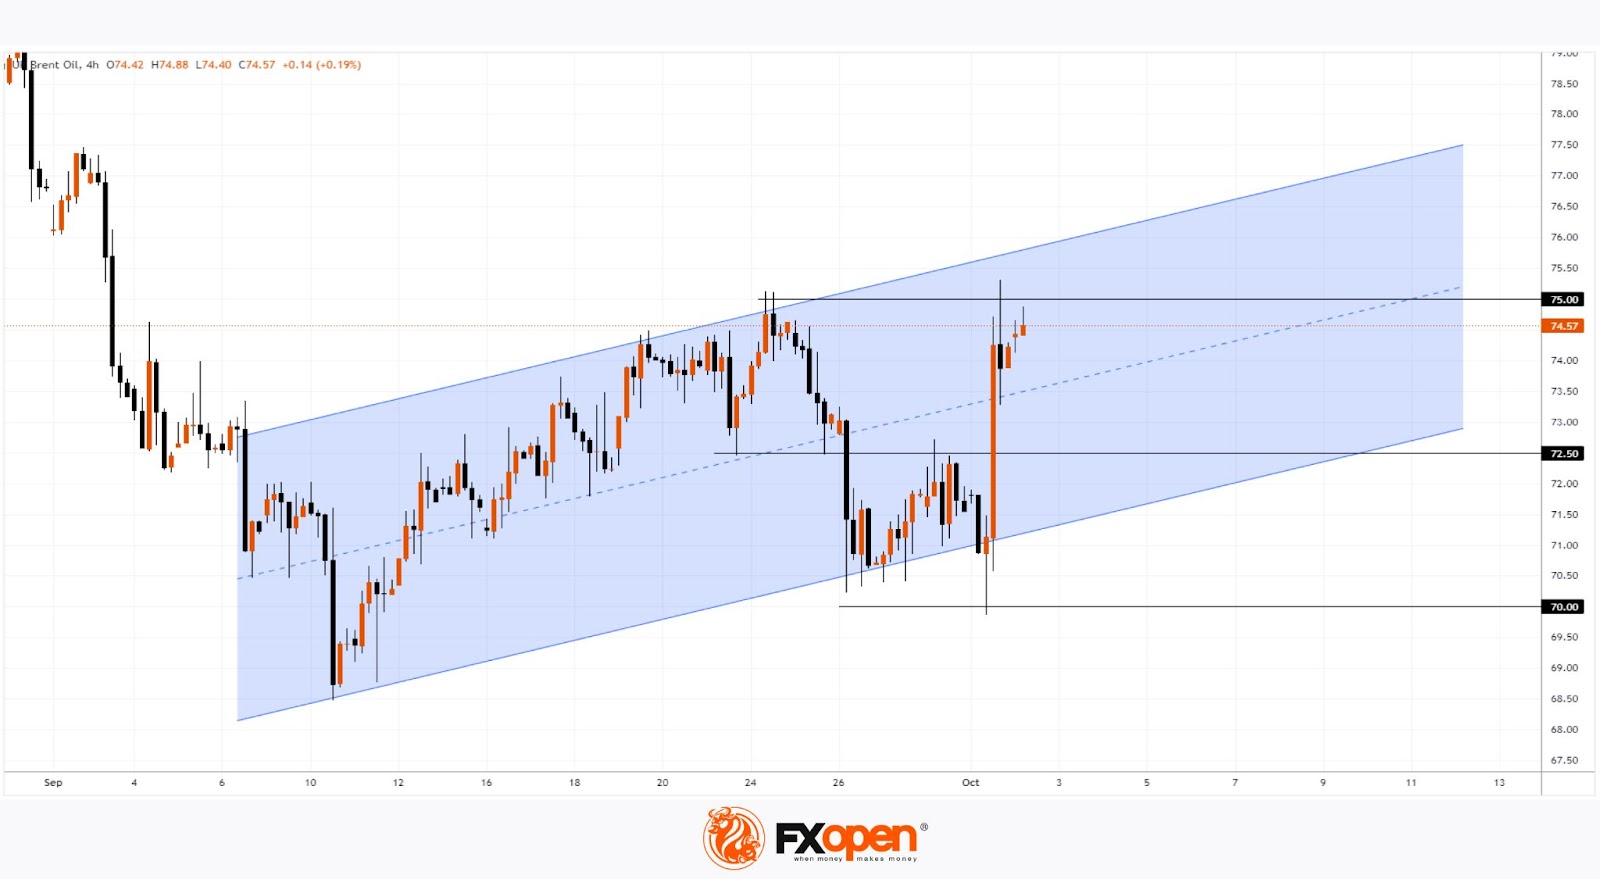
→ Brent oil price movements have formed an upward channel (shown in blue), beginning in early September. Following the news of the missile attack, the price has climbed into the upper half of the channel.
→ Interestingly, just before this surge, the price had hit a multi-week low with a false bearish breakout below the psychological $70 per barrel level.
Given Israel’s vow to retaliate for Iran's strike, it’s reasonable to assume that oil demand may remain high, potentially pushing XBR/USD towards the upper boundary of the channel, surpassing the current resistance at $75.
Brent oil could find support at the median line of the blue channel and the $72.50 level.
Start trading commodity CFDs with tight spreads. Open your trading account now or learn more about trading commodity CFDs with FXOpen.
This article represents the opinion of the Companies operating under the FXOpen brand only. It is not to be construed as an offer, solicitation, or recommendation with respect to products and services provided by the Companies operating under the FXOpen brand, nor is it to be considered financial advice.
Market Analysis: EUR/USD Trims Gains, USD/JPY Eyes Fresh Increase
EUR/USD declined from the 1.1200 resistance and corrected gains. USD/JPY is rising and might gain pace above the 144.65 resistance.
Important Takeaways for EUR/USD and USD/JPY Analysis Today
- The Euro started a fresh decline below the 1.1150 support zone.
- There is a connecting bearish trend line forming with resistance at 1.1070 on the hourly chart of EUR/USD at FXOpen.
- USD/JPY climbed higher above the 142.50 and 143.40 levels.
- There is a connecting bullish trend line forming with support at 143.45 on the hourly chart at FXOpen.
EUR/USD Technical Analysis
On the hourly chart of EUR/USD at FXOpen, the pair struggled to clear the 1.1200 resistance zone. The Euro started a fresh decline and traded below the 1.1150 support zone against the US Dollar.
The pair declined below 1.1125 and tested the 1.1100 zone. A low was formed near 1.1045 and the pair is now consolidating losses. There was a minor recovery wave above the 1.1060 level. On the upside, the pair is now facing resistance near a connecting bearish trend line at 1.1070.
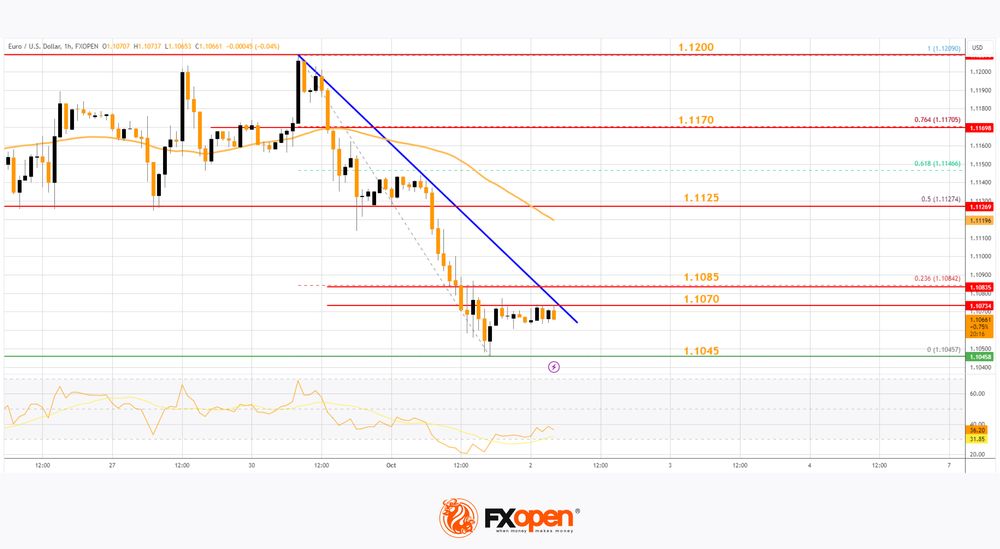
The trend line is close to the 23.6% Fib retracement level of the recent decline from the 1.1209 swing high to the 1.1045 low. The next key resistance is near the 50-hour simple moving average at 1.1125.
The main resistance is near the 76.4% Fib retracement level of the recent decline from the 1.1209 swing high to the 1.1045 low at 1.1170. A clear move above the 1.1170 level could send the pair toward the 1.1200 resistance.
An upside break above 1.1200 could set the pace for another increase. In the stated case, the pair might rise toward 1.1250.
If not, the pair might resume its decline. The first major support on the EUR/USD chart is near 1.1045. The next key support is at 1.1020. If there is a downside break below 1.1020, the pair could drop toward 1.1000. The next support is near 1.0965, below which the pair could start a major decline.
USD/JPY Technical Analysis
On the hourly chart of USD/JPY at FXOpen, the pair started a fresh upward move from the 141.65 zone. The US Dollar gained bullish momentum above 142.80 against the Japanese Yen.
It even cleared the 50-hour simple moving average and 143.00. The bulls pushed the pair above the 143.50 and it tested the 50% Fib retracement level of the downward move from the 146.49 swing high to the 141.65 low.
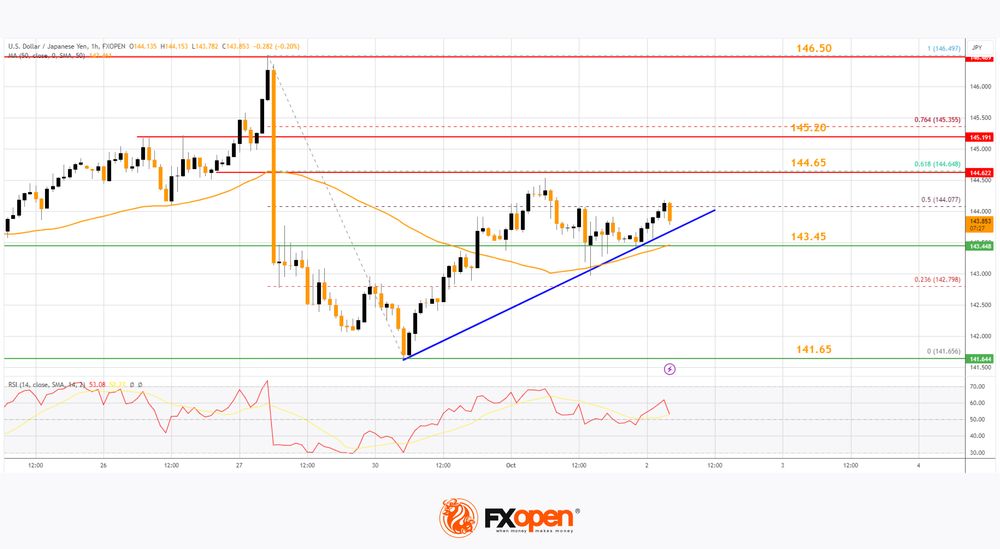
The current price action above the 143.20 level is positive. Immediate resistance on the USD/JPY chart is near 144.65 and the 61.8% Fib retracement level of the downward move from the 146.49 swing high to the 141.65 low.
The first major resistance is near 145.20. If there is a close above the 145.20 level and the RSI moves above 60, the pair could rise toward 146.50. The next major resistance is near 148.00, above which the pair could test 150.00 in the coming days.
On the downside, the first major support is near a connecting bullish trend line with support at 143.45 and the 50-hour simple moving average, below which the bears could gain strength.
The next major support is visible near the 141.65 level. If there is a close below 141.65, the pair could decline steadily. In the stated case, the pair might drop toward the 140.00 support zone. The next stop for the bears may perhaps be near the 138.00 region.
Trade over 50 forex markets 24 hours a day with FXOpen. Take advantage of low commissions, deep liquidity, and spreads from 0.0 pips. Open your FXOpen account now or learn more about trading forex with FXOpen.
This article represents the opinion of the Companies operating under the FXOpen brand only. It is not to be construed as an offer, solicitation, or recommendation with respect to products and services provided by the Companies operating under the FXOpen brand, nor is it to be considered financial advice.
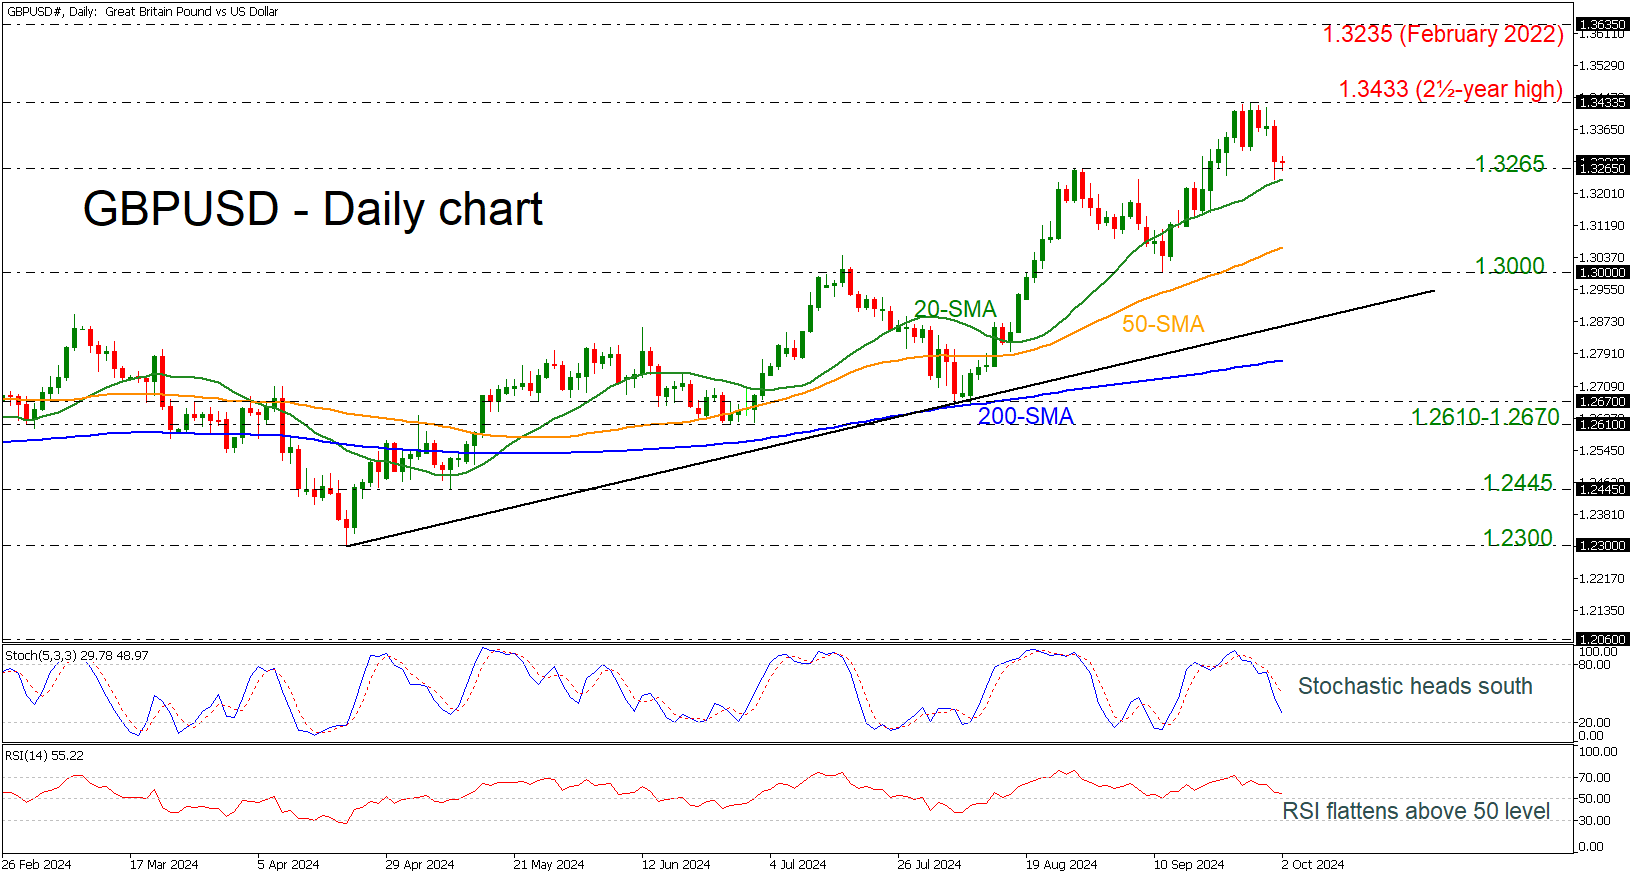
GBPUSD Slips Near Strong Support of 1.3265
- GBPUSD remains above 20-day SMA
- Stochastic and RSI reflect latest downside move.
GBPUSD is notably retreating from the two-and-a-half-year high of 1.3433, meeting the 20-day simple moving average (SMA) at 1.3235. Furthermore, the pair is still hovering above the strong support of 1.3265, but the technical oscillators mirror the latest downside move.
The stochastic oscillator is heading south from the overbought region with strong momentum, while the RSI is moving horizontally above the neutral threshold of 50.
As long as the price remains above 1.3265, it may challenge the 1.3433 resistance level before running towards the February 2022 high of 1.3635.
Otherwise, a significant drop beneath the 20-day SMA may send the market towards the 50-day SMA at 1.3060, ahead of the 1.3000 key level. Steeper losses could pave the way for a test of the medium-term ascending trend line at 1.2910.
All in all, GBPUSD has been in an upward trend since April, and only a decline beneath the 200-day SMA, which stands near 1.2770, may switch the outlook to bearish.
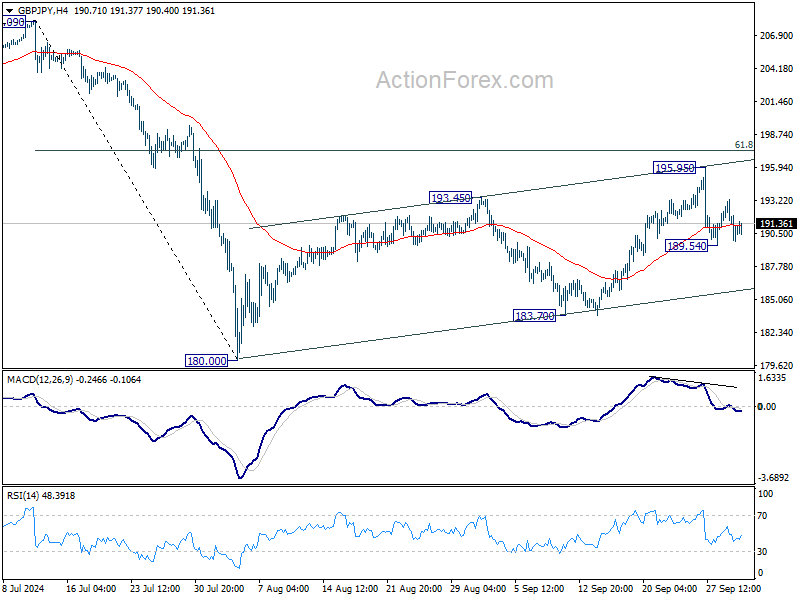
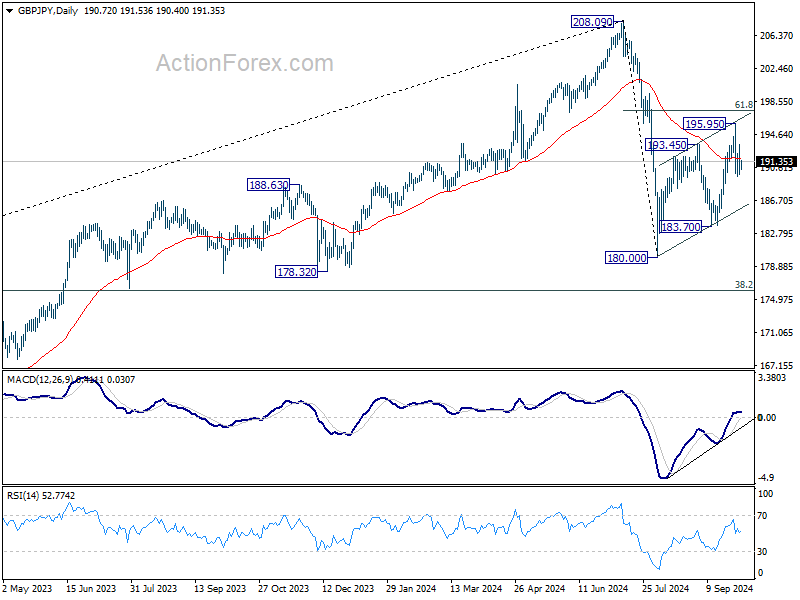
GBP/JPY Daily Outlook
Daily Pivots: (S1) 189.27; (P) 191.31; (R1) 192.78; More...
Intraday bias in GBP/JPY remains neutral and outlook is unchanged. Corrective rebound from 180.00 might have completed with three waves up to 195.95. Risk will stay on the downside as long as 195.95 resistance holds. Below 189.54 will target 183.70 support. However, break of 195.95 will resume the rebound form 180.00 instead.
In the bigger picture, price actions from 208.09 are seen as a correction to whole rally from 123.94 (2020 low). The range of consolidation should be set between 38.2% retracement of 123.94 to 208.09 at 175.94 and 208.09. However, decisive break of 175.94 will argue that deeper correction is underway.
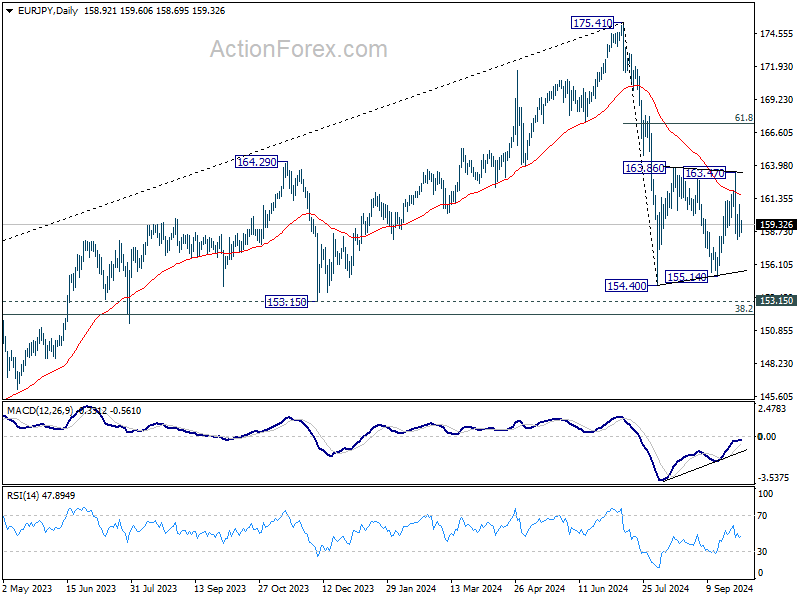
EUR/JPY Daily Outlook
Daily Pivots: (S1) 157.87; (P) 159.39; (R1) 160.41; More....
Intraday bias in EUR/JPY remains neutral and outlook is unchanged. Corrective pattern from 154.40 might have completed with three waves to 163.47 already. Risk will stay mildly on the downside as long as 163.47 resistance holds. Below 158.09 will target 154.40/155.14 support zone.
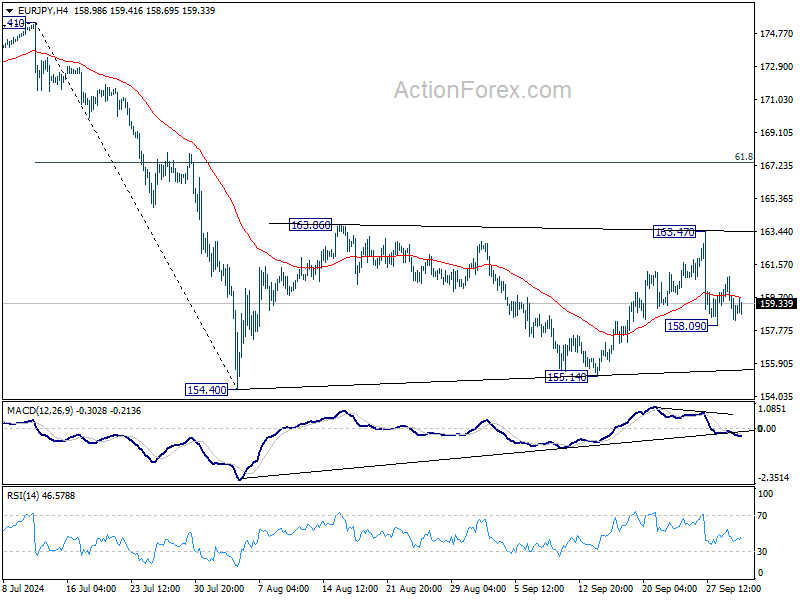
In the bigger picture, price actions from 175.41 are seen as correction to rally from 114.42 (2020 low). The range of consolidation should have been set between 38.2% retracement of 114.42 to 175.41 at 152.11 and 175.41 high. However, decisive break of 152.11 would argue that deeper correction is underway.
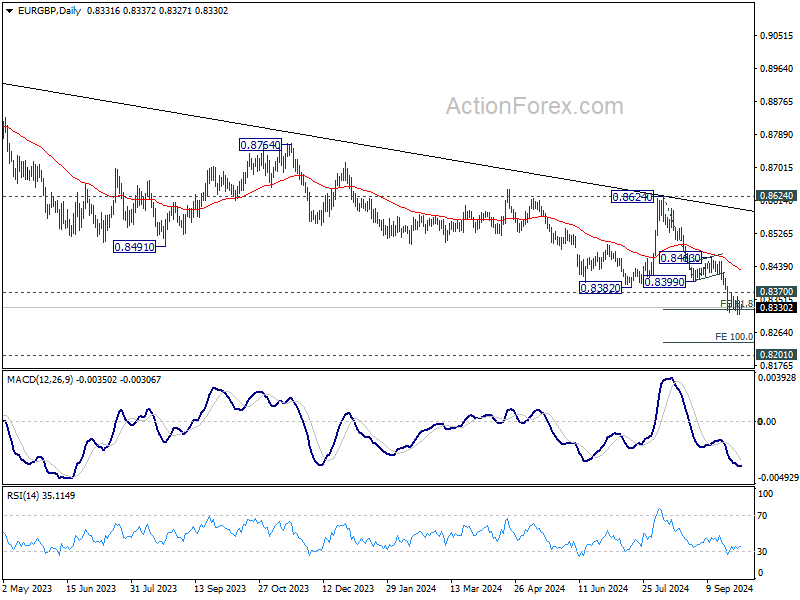
EUR/GBP Daily Outlook
Daily Pivots: (S1) 0.8313; (P) 0.8329; (R1) 0.8347; More...
Intraday bias in EUR/GBP stays on the downside for the moment. Fall from 0.8624 would target 100% projection of 0.8624 to 0.8399 from 0.8463 at 0.8237 next. On the upside, though, above 0.8370 minor resistance will turn bias back to the upside for stronger recovery.
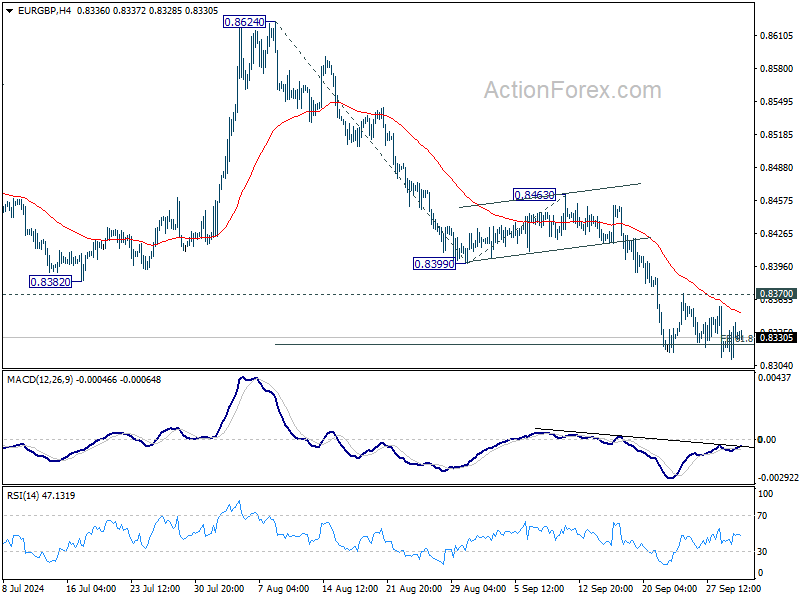
In the bigger picture, down trend from 0.9267 (2022 high) is in progress. Next target is 0.8201 (2022 low), but strong support should be seen there to bring rebound. However, outlook will remain bearish as long as 0.8624 resistance holds even in case of strong rebound.
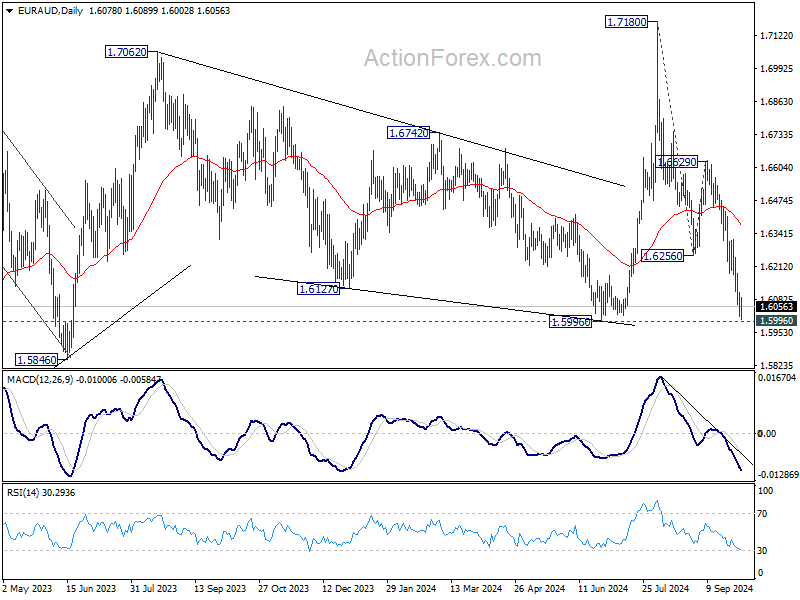
EUR/AUD Daily Outlook
Daily Pivots: (S1) 1.6027; (P) 1.6072; (R1) 1.6126; More...
Intraday bias in EUR/AUD is turned neutral first with 4H MACD crossed above signal line. Strong rebound from 1.5996 support, followed by 1.6184 minor resistance, will indicate short term bottoming. Intraday bias will be turned back to the upside for stronger rebound. However, decisive break of 1.5996 will carry larger bearish implications. Next target will be 100% projection of 1.7180 to 1.6256 from 1.6629 at 1.5705.
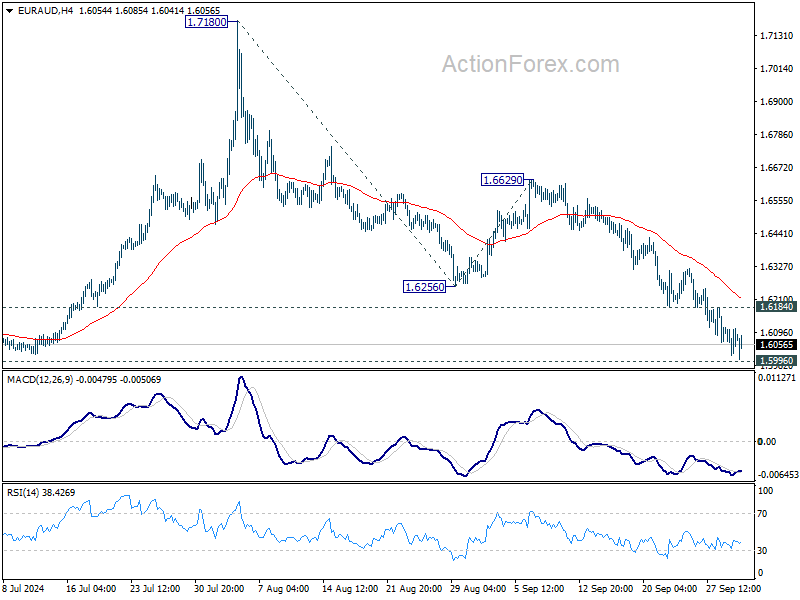
In the bigger picture, outlook is mixed up by the deeper than expected fall from 1.7180. Yet as long as 1.5996 support holds, up trend from 1.4281 (2022 low) is still in favor to resume at a later stage. However, decisive break of 1.5996 will argue that the medium term trend has reversed.
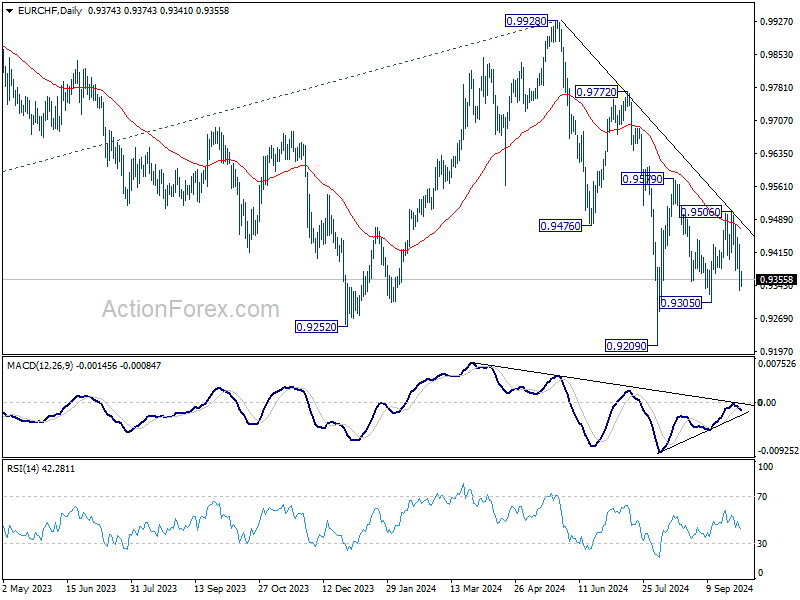
EUR/CHF Daily Outlook
Daily Pivots: (S1) 0.9324; (P) 0.9379; (R1) 0.9424; More....
Intraday bias in EUR/CHF remains neutral for the moment. On the downside, break of 0.9305 will resume the fall from 0.9579 to retest 0.9209 low. On the upside, above 0.9506 will resume the rebound from 0.9305 to 0.9579 resistance.
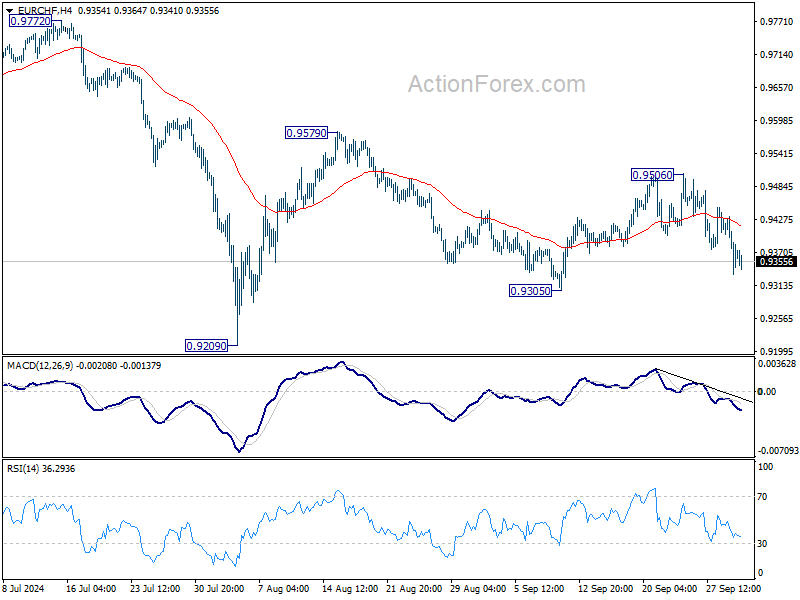
In the bigger picture, medium term corrective pattern from 0.9407 (2022 low) might have completed with three waves to 0.9928. Decisive break of 0.9252 (2023 low) will confirm long term down trend resumption. Next target will be 61.8% projection of 1.1149 to 0.9407 from 0.9928 at 0.8851. For now, outlook will stay bearish as long as 0.9928 resistance holds, even in case of strong rebound.
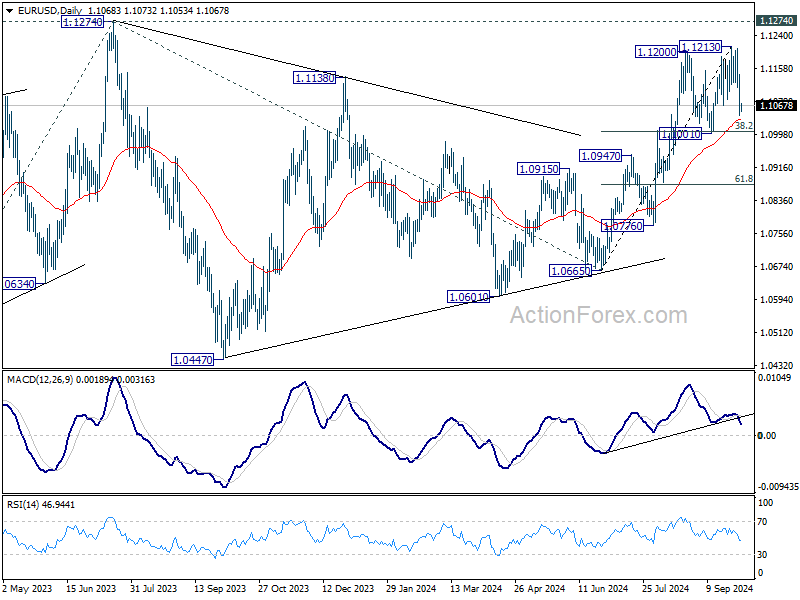
EUR/USD Daily Outlook
Daily Pivots: (S1) 1.1028; (P) 1.1086; (R1) 1.1127; More....
Intraday bias in EUR/USD remains neutral first and more consolidations would be seen below 1.1213 short term top. Nevertheless, further rally is still expected 1.1001 cluster support holds (38.2% retracement of 1.0665 to 1.1213 at 1.1004). Break of 1.1213 will target 1.1274 high. However, decisive break of 1.1001/4 will confirm near term bearish reversal.
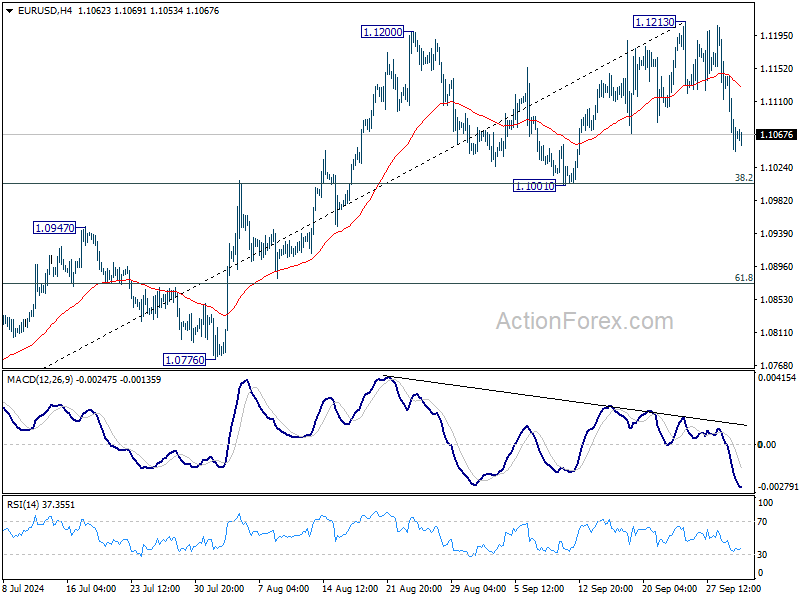
In the bigger picture, corrective pattern from 1.1274 should have completed at 1.0665 already. Decisive break of 1.1274 (2023 high) will confirm resumption of whole up trend from 0.9534 (2022 low). Next target will be 61.8% projection of 0.9534 to 1.1274 from 1.0665 at 1.1740. This will now be the favored case as long as 1.1001 support holds.
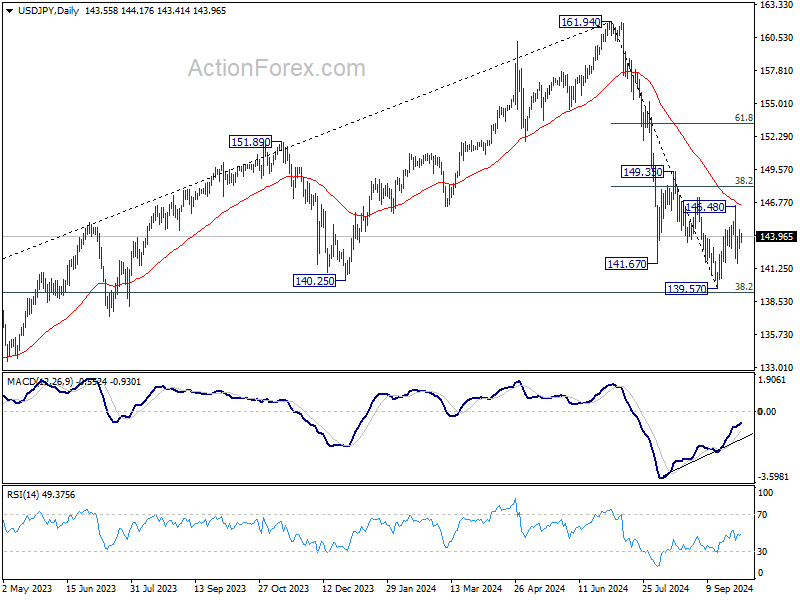
USD/JPY Daily Outlook
Daily Pivots: (S1) 142.85; (P) 143.69; (R1) 144.41; More...
Intraday bias in USD/JPY stays neutral and outlook is unchanged. On the downside, below 141.63 will target 139.57 low. But strong support could be seen again from 139.26 fibonacci level to bring rebound. On the upside, above 146.48 will resume the rebound from 139.57 to 38.2% retracement of 161.94 to 139.57 at 148.11. However, firm break of 139.26 will carry larger bearish implications.
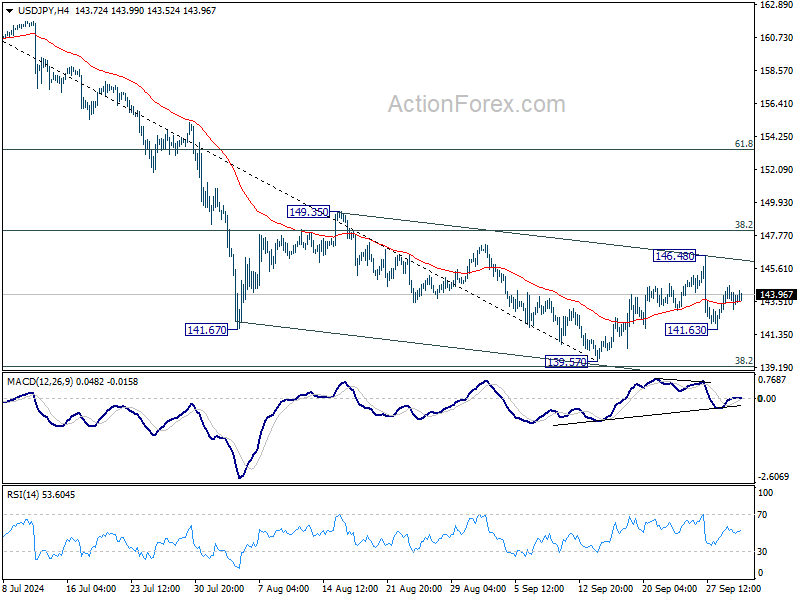
In the bigger picture, fall from 161.94 medium term top is seen as correcting whole up trend from 102.58 (2021 low). Strong support could be seen from 38.2% retracement of 102.58 to 161.94 at 139.26 to contain downside, at least on first attempt. But in any case, risk will stay on the downside as long as 149.35 resistance holds. Sustained break of 139.26 would open up deeper medium term decline to 61.8% retracement at 125.25.