Sample Category Title
EURJPY Wave Analysis
- EURJPY approaching strong resistance level 171.55
- Likely to correct down from 171.55
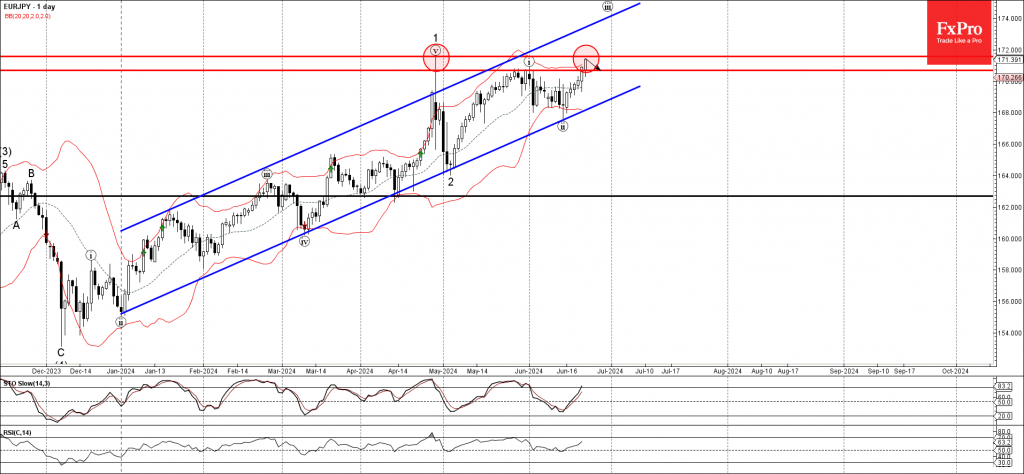
EURJPY currency pair approaching the strong resistance level 171.55 (which stopped the previous sharp upward impulse wave 1 at the end of April, as you can see below).
The resistance level 171.55 is further strengthened by the upper daily Bollinger Band.
Given the strength of the resistance level 171.55 and the overbought reading on the daily Stochastic indicator, EURJPY currency pair can be expected to reverse down from the resistance level 171.55 – when it reaches it.
USD Weekly Analysis: USDX and EURUSD
Fundamental Analysis
This week we will have a few high-impact data releases from the economic calendar. Still, the focus will be on several speeches by Fed officials, with five out of eight appearances scheduled featuring hawkish members. This will drive a strong pushback against market expectations of two rate cuts this year. This hawkish stance is expected to bolster the strength of the dollar, adding momentum to its already strong performance in the first half of the year.
Additionally, the dollar could benefit from European political risks ahead of the French elections; Le Pen's advantage over Macron and weak June PMI data in Europe increase investor anxiety.
This week we will have the following USD-related releases from the economic calendar:
- CB Consumer Confidence (June). Tuesday 25
- New Home Sales (May). Wednesday 26
- Durable Goods Orders (monthly) (May). Thursday 27
- Final Q1 GDP. Thursday 27
- Unemployment Claims. Thursday 27
- PCE Price Index (May). Friday 28.
PCE data is expected to be lower than last month, so to cause a more aggressive downward reaction, a significantly lower PCE is needed to shift the market trend of speculating on two rate cuts this year and signalling an imminent cut for September.
Technical Analysis
Dollar Index (DXY), H4
- Supply Zones (Sells): 105.85 and 106.21
- Demand Zones (Buys): 105.96, 105.42, 104.88
The dollar's bearish correction came to an end after reaching a new higher high last week at 105.52. The opening correction towards the last uncovered point of control (POC) at 105.06, which is a demand zone for buying, will likely be defended by buyers. This defense could trigger a rally towards the opening at 105.44 and the Asian supply zone. We will then evaluate the strength of the ascent and price behaviour in that zone, as the next price action depends on it.
With a stronger rally breaking the Asian supply zone indicated at the opening, we will see an impulse seeking to break the May 9 resistance, the uncovered POC at 106.04, and only after its breakout consider the weekly target at the May resistance of 106.33.
On the other hand, a decisive break of the POC at 105.06 may encourage a retracement towards the area near the 104.69 support, observing a possible bullish rebound towards the opening sell zone at 105.43, and after its breakout extend buys towards 106.04.
EURUSD, H3
- Supply Zones (Sells): 1.0745 / 1.0806
- Demand Zones (Buys): 1.0691
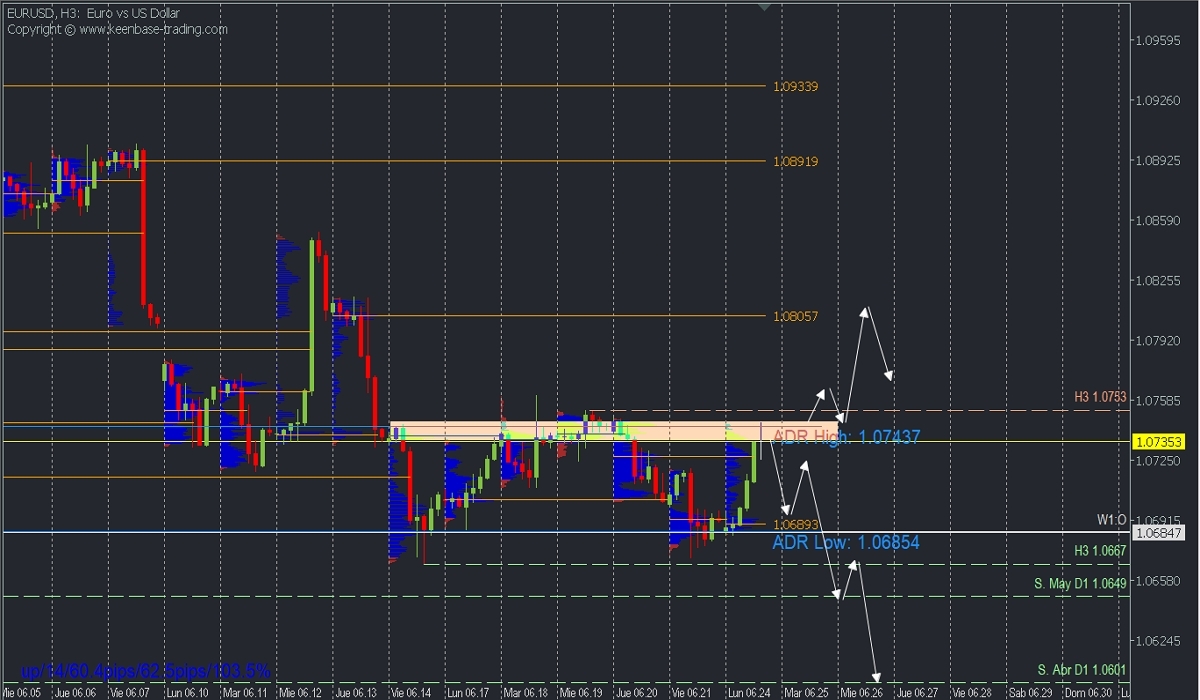
After reaching the average daily range high (ADR High) and a weekly supply zone, a retracement towards the Asian POC at 1.0691 is expected, from where new buys will be considered. The extension of the bullish correction will be observed with quotes decisively breaking the supply zone between 1.0750 and 1.0633, confirming the intraday bullish reversal with a weekly target at 1.08.
However, failure to break above 1.0750 and a quick descent below 1.0691 will indicate renewed bearish strength of the pair towards May support at 1.0649 and 1.0624 more extended.
*Uncovered POC: POC = Point of Control: It is the level or zone where the highest concentration of volume occurred. If previously, a bearish movement originated from it, it is considered a sell zone and forms a resistance zone. Conversely, if previously, an upward impulse originated from it, it is considered a buy zone, usually located at lows, forming support zones.
Fed’s Goolsbee optimistic on inflation improvement
In a CNBC interview today, Chicago Fed President Austan Goolsbee expressed cautious optimism about inflation in the US, describing himself as "closet optimistic" that there will be improvement on the inflation front.
Goolsbee refrained from commenting on the timing of rate cuts but emphasized the need for policymakers to consider whether the current high level of interest rates is appropriate for an economy showing signs of cooling beyond just inflation metrics.
He noted that factors such as rising unemployment claims, slightly increasing unemployment rate, and other indicators returning to pre-pandemic levels should prompt Fed to think more about balancing its dual mandates of controlling inflation and maintaining employment.
Sunset Market Commentary
Markets
It was a slow but constructive start of the week. The economic calendar had little to offer with the exception of the German Ifo indicator. Confidence fell in June from May with the headline series easing from 89.3 to 88.6. Both the current assessment (88.3) and the expectations (89.0) component fell short of expectations. More or less confirming last week’s (skewed) PMI’s, markets quickly set the downside surprise aside. A mildly constructive atmosphere dominated instead, lifting European equities about 0.80% higher. There’s a noteworthy outperformance of the car sector (> 2%). It followed news over the weekend that the EU and China have agreed to start talks over the bloc’s recently announced EV tariffs. It eases concerns for Chinese retaliatory measures against European carmakers. Core bond yields trade more or less flat, Bunds marginally underperforming Treasuries. German yields rise <2 bps across the curve. Both peripheral and the French spread vs Germany’s 10-yr yield ease a few basis points ahead of the June 30 snap elections (first round). Treasury yields change less than 1 bp in a daily perspective.
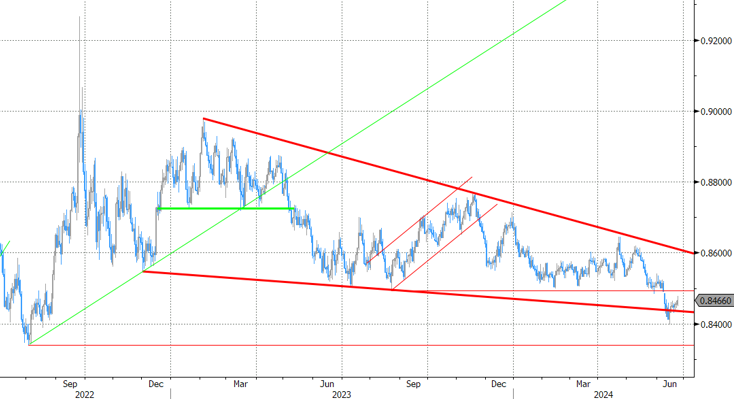
The Japanese yen drew most attention on currency markets. Ongoing JPY weakness triggered FX interventions around USD/JPY 160 end April and the beginning of May. Less than two months later, the pair is again closing in on these levels, with the latest acceleration coming on the back of dollar strength. Japan’s finance (vice-)minister this morning reiterated readiness to act again. USD/JPY today suddenly dropped from around 159.8 to 158.8 for no particular reason. We do recall a move out of thin air happening on Friday, April 26 as well (though it was a larger one back then). On Monday, April 29, the first round of interventions took place. The difference, for now, is that USD/JPY is slightly down for the day, as are most other dollar cross rates. EUR/USD rises from just south of 1.07 to 1.0738. The trade-weighted index eases towards 105.47. EUR/GBP continues to bottom out with the Bank of England having protected the pair’s downside better. The combination is currently changing hands around 0.8467, up from a daily low of 0.845.
News & Views
The June industrial trends survey released by the Confederation of British Industry (CBI) showed export orders deteriorating in June, falling from -27% to -39%, the weakest performance since February 2021 and significantly falling below the long-run average of -18%. Total orders on the other hand improved from -33% to -18% but also remain below average. Output volumes were broadly unchanged in the three months to June (+3%) following an increase in the quarter to May (+14%). Notably, only four out of 17 sub-sectors saw output growth. Growth was noted in the food, drink, and tobacco, motor vehicle and transport, and plastics and furniture and upholstery sub-sectors. Looking at the next three months, the outlook suggested a modest rise in output of +13%. Stocks of finished goods (+14%) are sufficient to meet expected demand. CBI lead economist Jones said that it’s encouraging to see that manufacturing remain confident the economy is heading in the right direction with the survey suggesting a broadening out over summer. Soft orders are a note of caution. Expectations for average selling prices accelerated from 15% to 20%.
Belgian business confidence stabilized in June (-11.1 from -11). This stability masks contrasting developments in the sectors surveyed, with a strong improvement observed in business-related services (1.4 from -2.1; mainly more favorable activity expectations) but a fall in confidence in trade (-21.5 from -17.4; more negative employment expectations and intentions of placing orders with suppliers), building (-11.4 from -10.3) and manufacturing (-13.1 from -12.7; worse demand expectations and a more negative assessment of total order books and stock levels). Last week, Belgian consumer confidence improved from -7 to -1, the second best level since February 2020.
Graphs
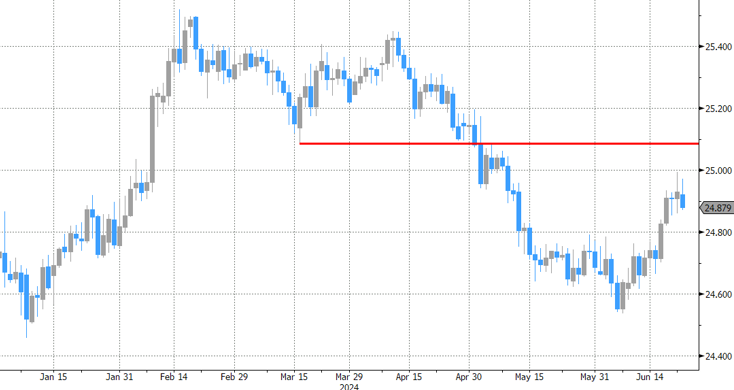
USD/JPY nears 160, triggering a new series of verbal (for now) interventions from Japanese finance officials

EuroStox50: carmakers among the best performers as China and EU agreed to start tariff talks

EUR/GBP extends its recent bottoming out process and has the BoE to thank for it
EUR/CZK eases after touching highest level in a month last Friday as it goes into the CNB’s (hawkish) cut on Thursday
Australian Dollar Calm Ahead of Consumer Confidence
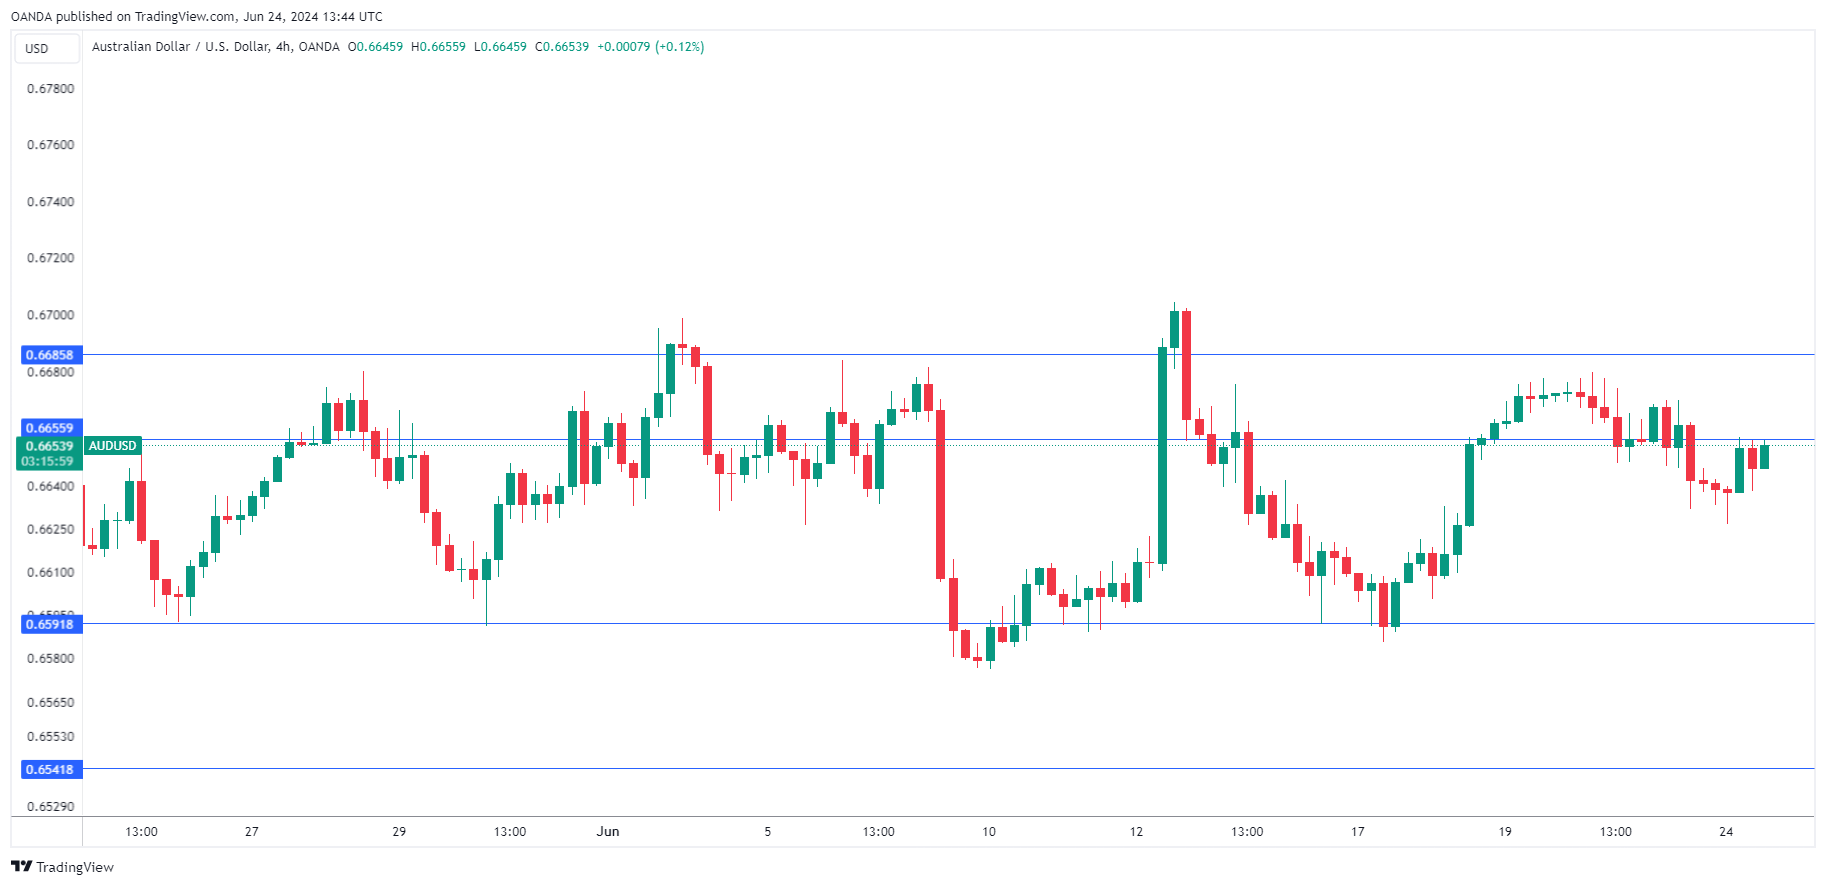
The Australian dollar has started the week quietly. AUD/USD is trading at 0.6648 early in the North American session, up 0.11% on the day.
Australia releases Westpac Consumer Sentiment early on Tuesday. Consumer confidence has been weak and fell 0.3% in May to 82.4, following a 2.4% decline in April. Consumers have been pessimistic about the weak economy and concerns that sticky inflation could prod the Reserve Bank of Australia to hike interest rates.
The RBA has maintained its stance of “higher for longer”, holding rates at 4.35% for the past five meetings. The central bank hasn’t shied away from warning that it could raise rates if inflationary pressures don’t ease. The April CPI report surprised on the upside, rising from 3.5% to 3.6%, above the market estimate of 3.5%. The May CPI report will be released on Wednesday, with a market estimate of 3.8%. If inflation does rise again, we will no doubt hear the RBA express its concern and reiterate that rate hikes remain on the table.
The economy is barely treading above water and posted a weak 0.1% gain in the first quarter, but the labor market, which is surprisingly tight, continues to confound the RBA and has dampened any hope of a rate cut in the near term.
There are no US releases on Monday but we’ll hear from two FOMC members, Christopher Waller and Mary Daly. Investors will be hoping for some insights about the Fed’s rate path. The Federal Reserve has been hawkish as inflation has been stickier than anticipated. The markets have priced in a rate cut in September at around 60%, according to CME’s FedWatch.
AUD/USD Technical
- AUD/USD is testing resistance at 0.6655. Above, there is resistance at 0.6685
- 0.6591 and 0.6541 are the next support levels
BTCUSD Elliott Wave : Forecasting the Decline Toward New Lows
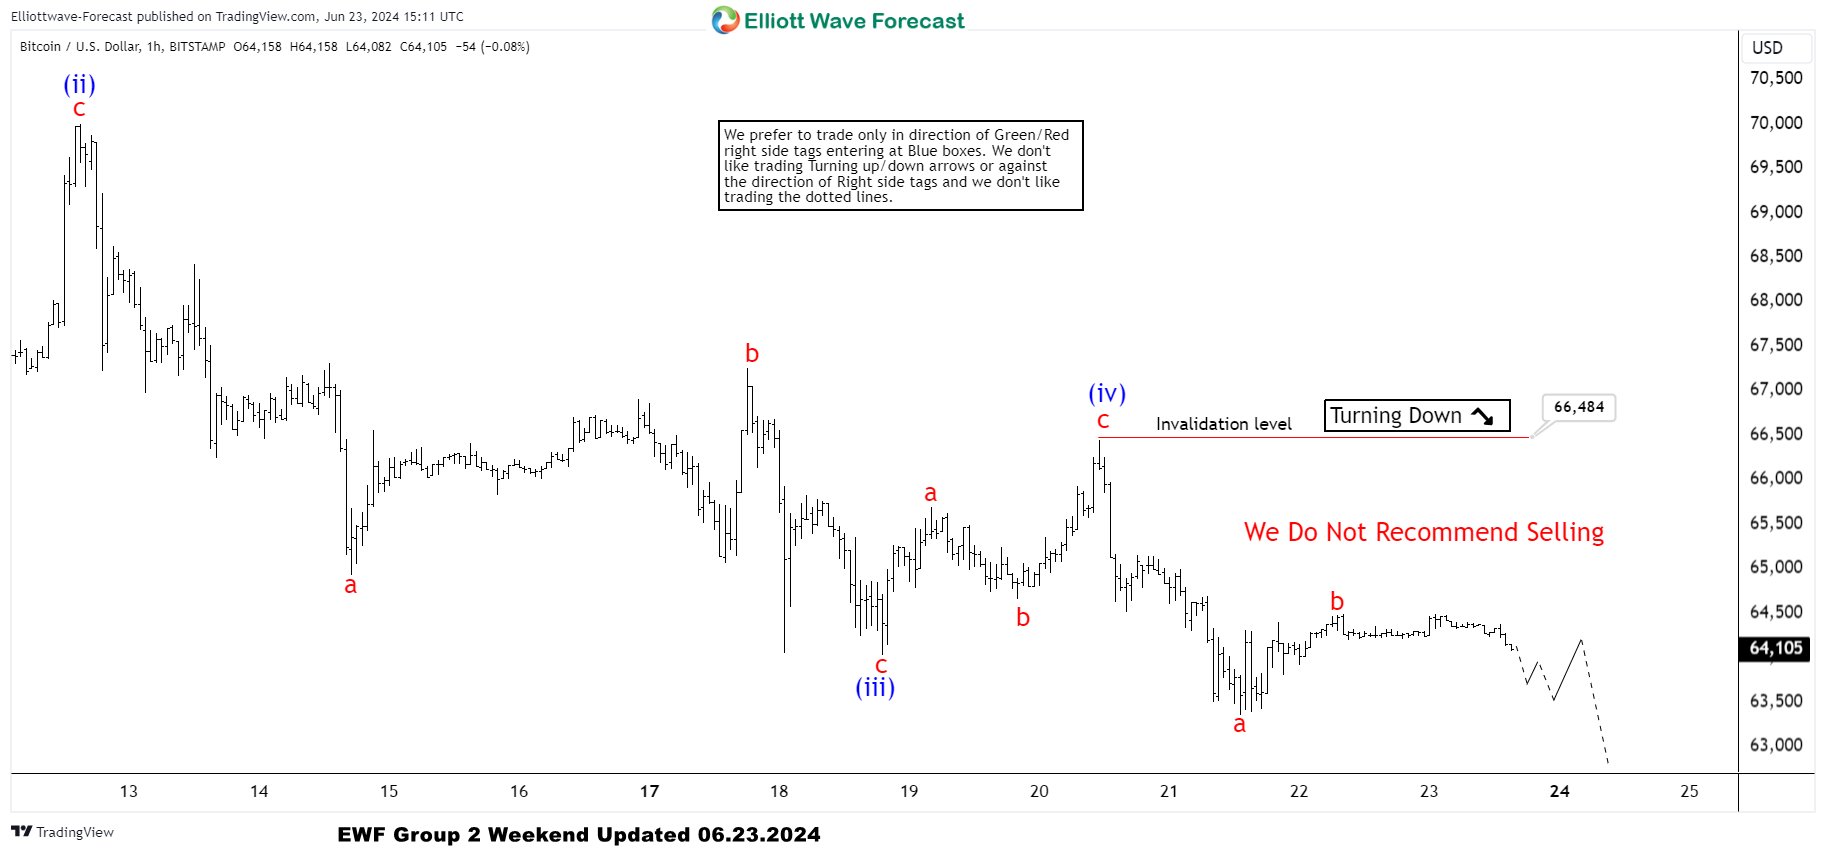
In this technical article we’re going to take a quick look at the Elliott Wave charts of Bitcoin BTCUSD , published in members area of the website. As our members know, Bitcoin is doing a correction against the 56510 low, which is unfolding as a Flat pattern. Now, the crypto is showing impulsive sequences in the cycle from the June 7th peak, which can be the last leg of the proposed Flat pattern. Consequently, we expect more short-term weakness in the near term. In the further text, we are going to explain the wave count.
BTCUSD H1 Weekend Update 06.23.2024
BTCUSD has broken the previous low, confirming more downside in the near term against the 66484 pivot. The current view suggests that the intraday recovery completed at the 64482 high as b red. While below that high, we believe the c red leg is in progress toward new lows, targeting the 61592-59793 area. We expect Bitcoin to keep finding intraday sellers in 3, 7, and 11 swings.
BTCUSD H1 London Update 06.24.2024
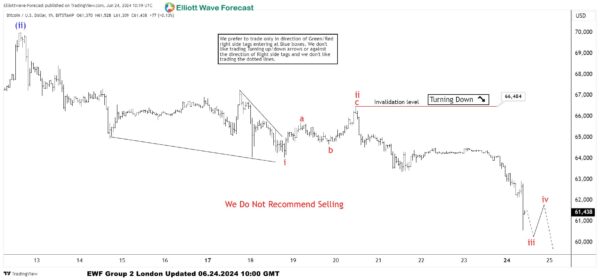
Bitcoin made a further decline as expected, reaching our first target zone at 61592-59793. From there, we can see an intraday bounce. The count has been adjusted, now suggesting we are potentially still within wave (iii), which is part of the last leg of the proposed Flat pullback. We don’t recommend forcing trades in BTCUSD at this stage.
EUR/USD Mid-Day Outlook
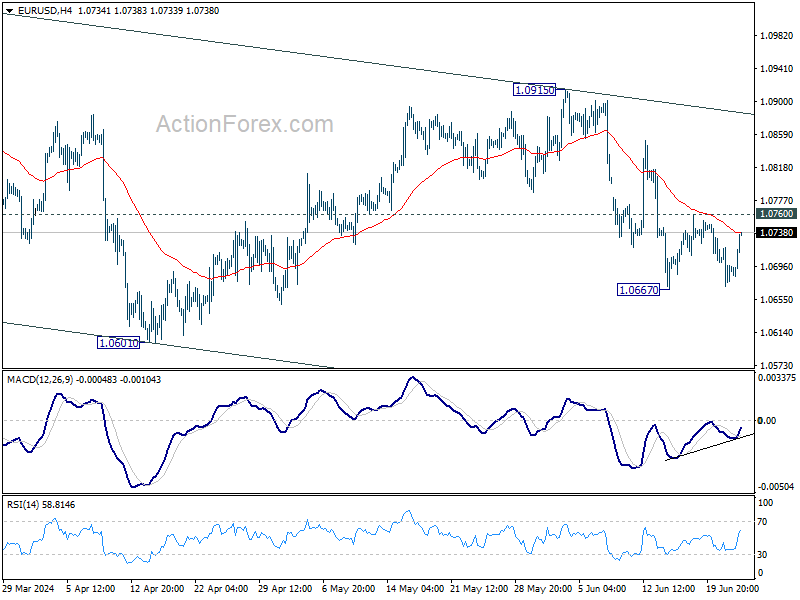
Daily Pivots: (S1) 1.0669; (P) 1.0695; (R1) 1.0719; More....
Intraday bias in EUR/USD remains neutral as range trading continues above 1.0667. Further fall is expected with 1.0760 resistance intact. Decline from 1.0915 is seen as another leg in the larger corrective pattern. Break of 1.0667 will target 1.0601 and below. However, firm break of 1.0760 will turn intraday bias back to the upside for stronger rebound.
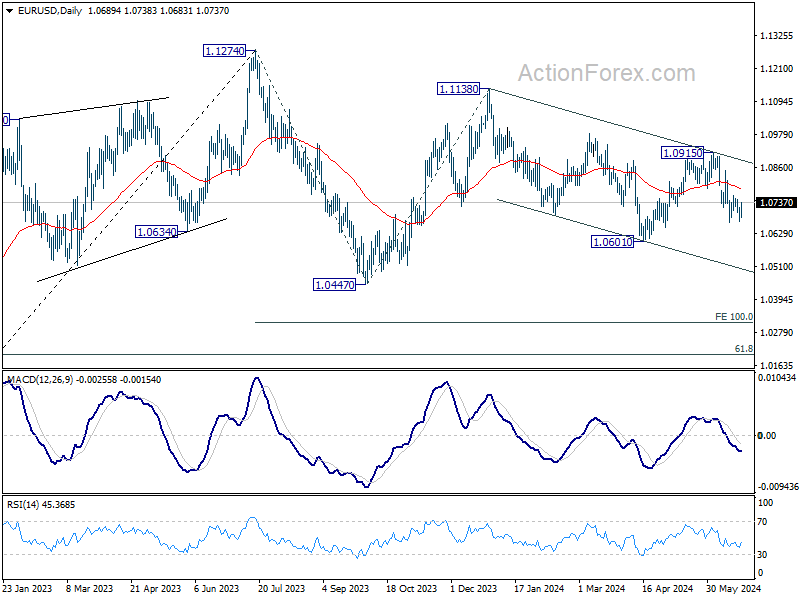
In the bigger picture, price actions from 1.1274 are viewed as a corrective pattern that's still in progress. Break of 1.0601 will target 1.0447 support and possibly further to 100% projection of 1.1274 to 1.0447 from 1.1138 at 1.0311. For now, this will remain the favored case as long as 1.0915 resistance holds, in case of rebound.
GBP/USD Mid-Day Outlook
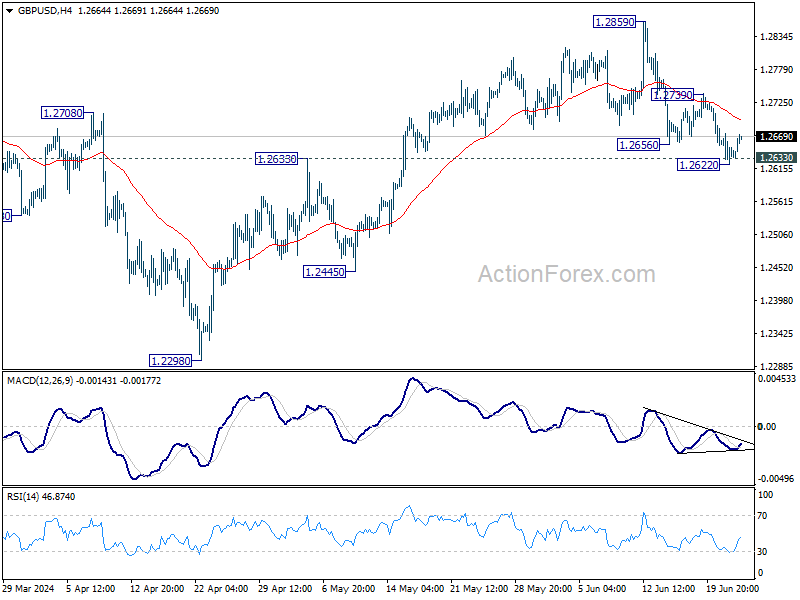
Daily Pivots: (S1) 1.2619; (P) 1.2646; (R1) 1.2671; More...
Intraday bias in GBP/USD is turned neutral first with current recovery. Further decline is expected as long as 1.2739 resistance holds. Break of 1.2622, and sustained trading below 1.2633 resistance turned support will argue that whole rise from 1.2298 has completed, and target 1.2445 and below. However, firm break of 1.2739 will argue that pull back from 1.2859 has completed, and bring retest of this high instead.
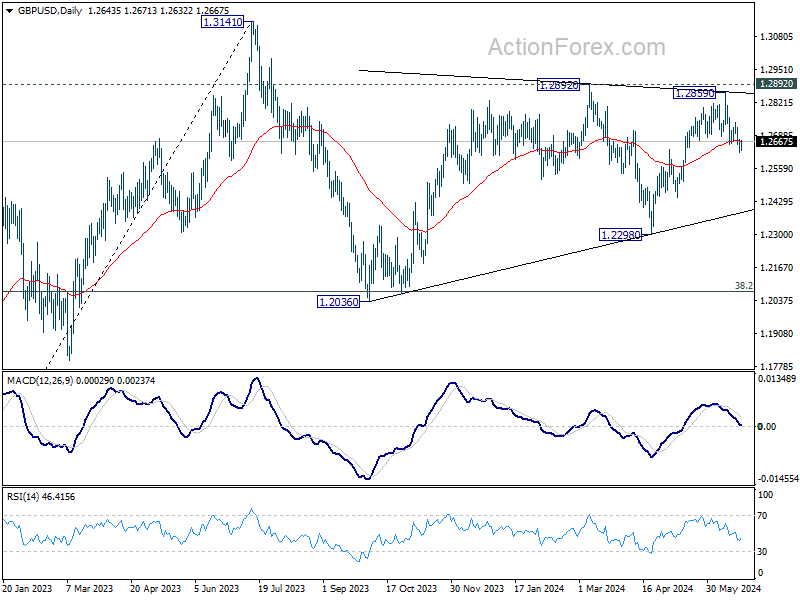
In the bigger picture, price actions from 1.3141 medium term top are seen as a corrective pattern that is still in progress. Break of 1.2445 support will confirm that another falling leg has started and target 1.2036 cluster support again (38.2% retracement of 1.0351 (2022 low) to 1.3141 at 1.2075. Nevertheless, break of 1.2892 resistance will argue that larger up trend from 1.0351is ready to resume through 1.3141.
USD/CHF Mid-Day Outlook
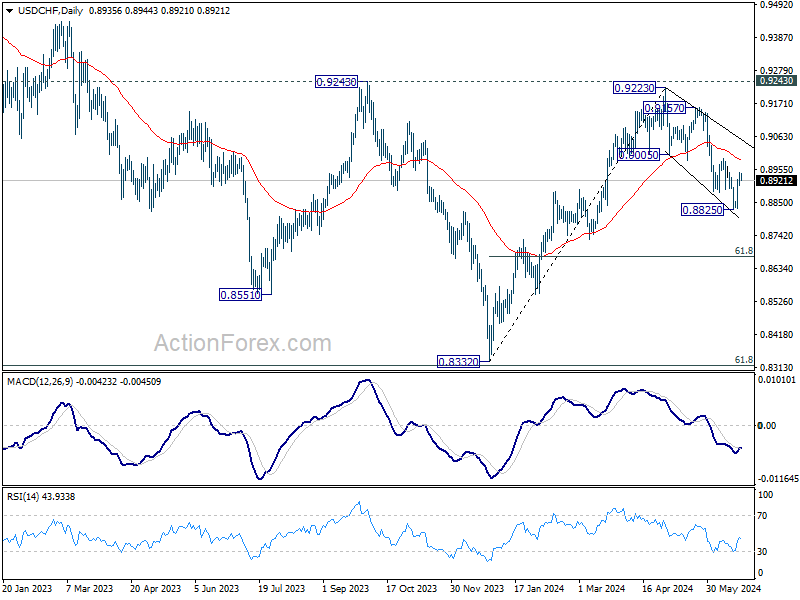
Daily Pivots: (S1) 0.8917; (P) 0.8931; (R1) 0.8958; More….
USD/CHF is extending the consolidation above 0.8825 and intraday bias remains neutral first. Still, near term outlook remains bearish with 0.8992 resistance intact. Break of 0.8825 will resume the fall from 0.9223 to 61.8% retracement of 0.8332 to 0.9223 at 0.8672.
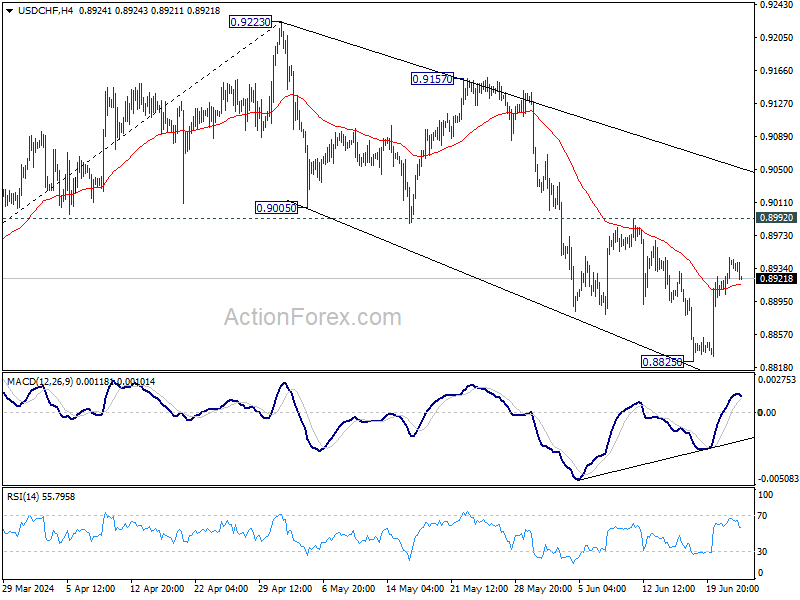
In the bigger picture, price actions from 0.8332 medium term bottom are seen as developing into a corrective pattern to the down trend from 1.0146 (2022 high). Rejection by 0.9243 resistance affirms this case, and maintains medium term bearishness. While more range trading could be seen between 0.8332/0.9243 first, downside break out is mildly in favor at a later stage.