

Sample Category Title
GBP/USD Mid-Day Outlook
Daily Pivots: (S1) 1.2619; (P) 1.2646; (R1) 1.2671; More...
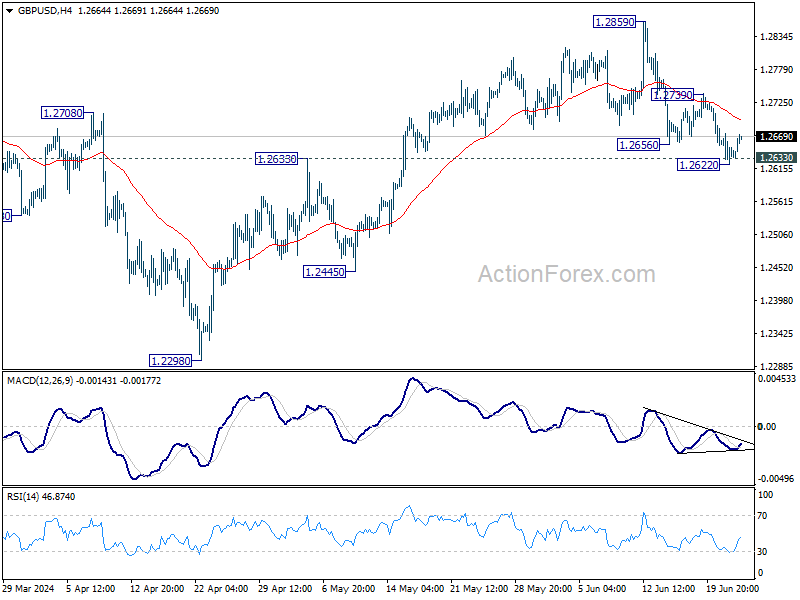
Intraday bias in GBP/USD is turned neutral first with current recovery. Further decline is expected as long as 1.2739 resistance holds. Break of 1.2622, and sustained trading below 1.2633 resistance turned support will argue that whole rise from 1.2298 has completed, and target 1.2445 and below. However, firm break of 1.2739 will argue that pull back from 1.2859 has completed, and bring retest of this high instead.
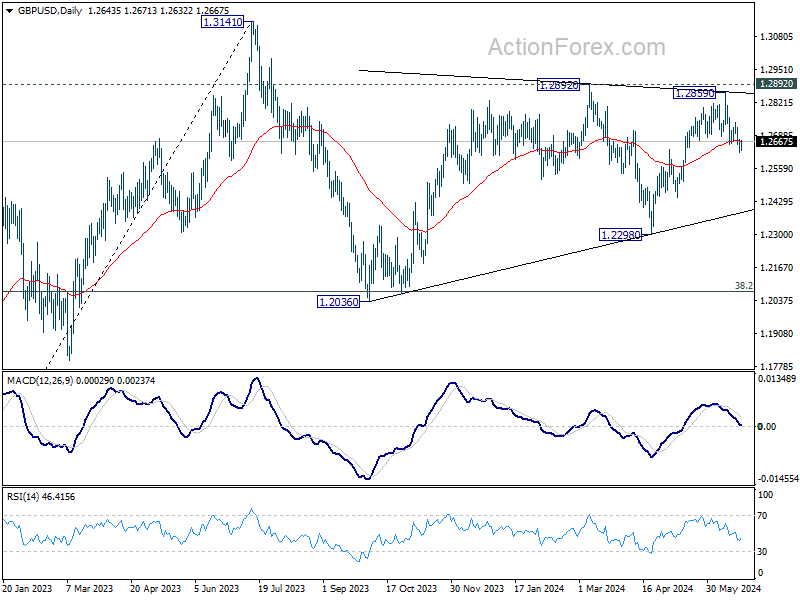
In the bigger picture, price actions from 1.3141 medium term top are seen as a corrective pattern that is still in progress. Break of 1.2445 support will confirm that another falling leg has started and target 1.2036 cluster support again (38.2% retracement of 1.0351 (2022 low) to 1.3141 at 1.2075. Nevertheless, break of 1.2892 resistance will argue that larger up trend from 1.0351is ready to resume through 1.3141.
USD/CHF Mid-Day Outlook
Daily Pivots: (S1) 0.8917; (P) 0.8931; (R1) 0.8958; More….
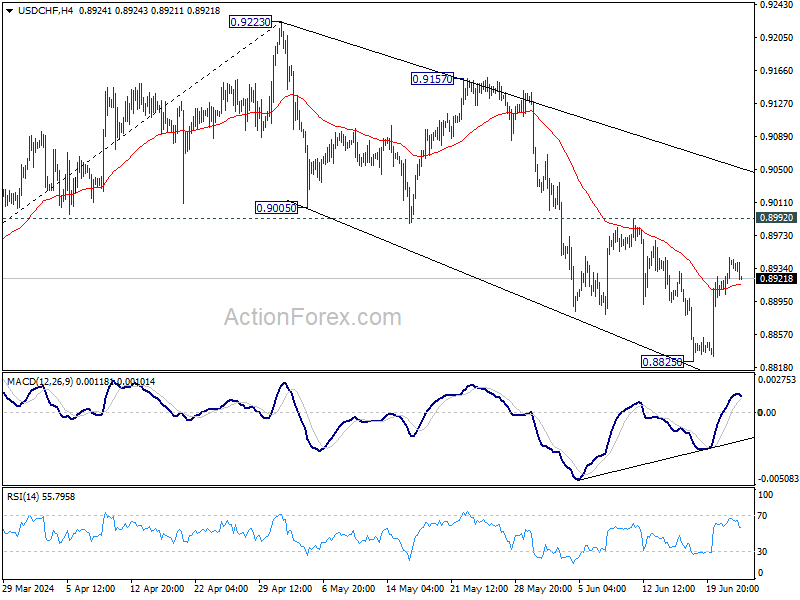
USD/CHF is extending the consolidation above 0.8825 and intraday bias remains neutral first. Still, near term outlook remains bearish with 0.8992 resistance intact. Break of 0.8825 will resume the fall from 0.9223 to 61.8% retracement of 0.8332 to 0.9223 at 0.8672.
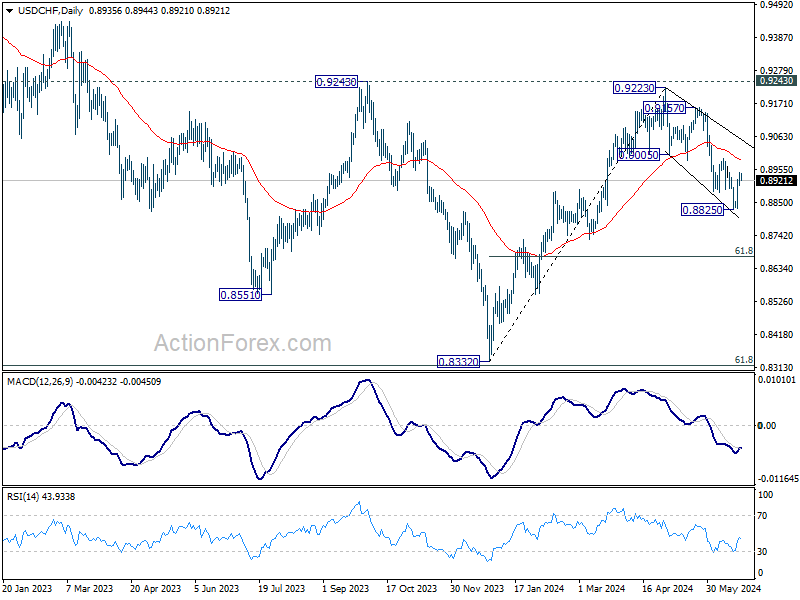
In the bigger picture, price actions from 0.8332 medium term bottom are seen as developing into a corrective pattern to the down trend from 1.0146 (2022 high). Rejection by 0.9243 resistance affirms this case, and maintains medium term bearishness. While more range trading could be seen between 0.8332/0.9243 first, downside break out is mildly in favor at a later stage.
USD/JPY Mid-Day Outlook
Daily Pivots: (S1) 159.02; (P) 159.44; (R1) 160.22; More...
Despite the deep but brief retreat, intraday bias in USD/JPY stays mildly on the upside with 158.65 minor support intact. Current rally should target 160.20 high, or possibly to 100% projection of 151.86 to 157.70 from 154.53 at 160.37. Upside could be limited there, at least on first attempt. On the downside, below 158.24 minor support will turn intraday bias neutral first. However, decisive break of 160.37 will pave the way to 161.8% projection at 163.97.
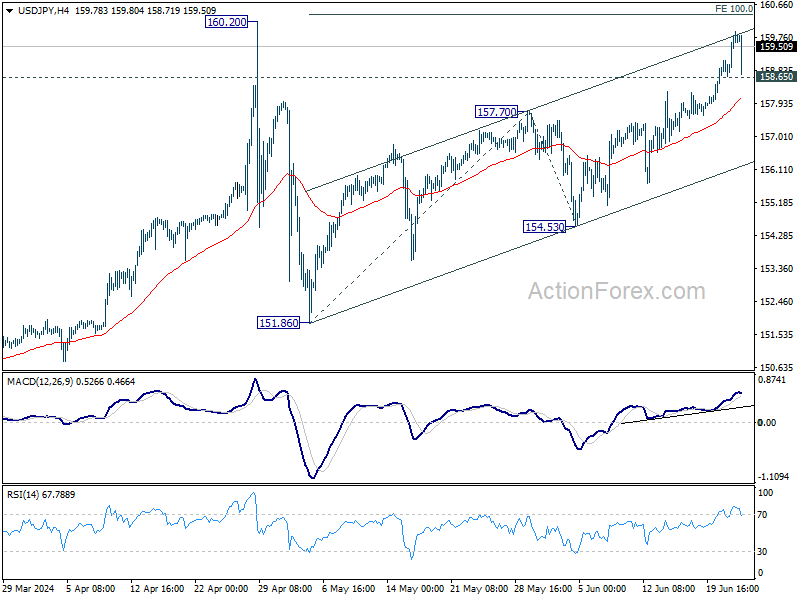
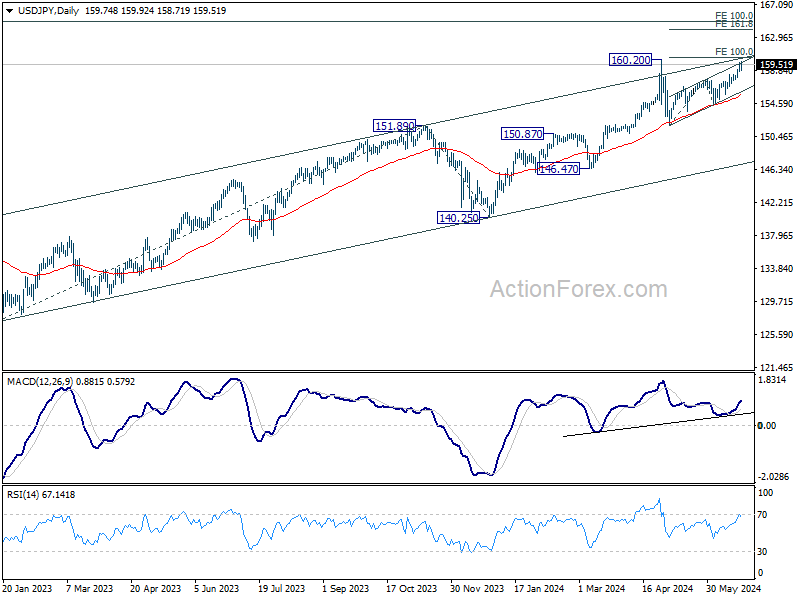
In the bigger picture, there is no sign of long term trend reversal yet. Further rally is expected as long as 150.87 resistance turned support holds. Decisive break of 160.02 will target 100% projection of 127.20 to 151.89 from 140.25 at 164.94.
Yen Rebounds from 160 Level, Euro Gains but Political Risks Remain
USD/JPY attempt to break through the critical 160 level was unsuccessful for, as Yen recovered during a relatively quiet European session today. Although Yen surged briefly, there was no sustained selloff below the 159 mark against the greenback. The scale of the movement makes it challenging to determine if Japan intervened in the market. This could be due to a cautious probe by the authorities, actions by institutional traders, or simply heightened market nerves. Yen will remain under close scrutiny, especially given the lack of significant economic data from the US until tomorrow's European session.
Euro is currently the best performer today, with notable bounce against Sterling. However, the rebound in the common currency isn't strong enough to signal a reversal of the recent downtrend yet. According to the latest Ipsos poll released over the weekend, the far-right National Rally continues to lead the first round of the parliamentary elections with 35.5% of the vote, followed by the left-wing New Popular Front with 29.5%. Should these poll results be reflected in the elections, Euro could face another wave of selling pressure.
Across the broader currency markets, Euro and Yen are the strongest performers today, followed by the Sterling. In contrast, New Zealand Dollar and Australian Dollar are the weakest, alongside Dollar, with Canadian Dollar also lagging. The Swiss Franc is positioned in the middle of the performance spectrum.
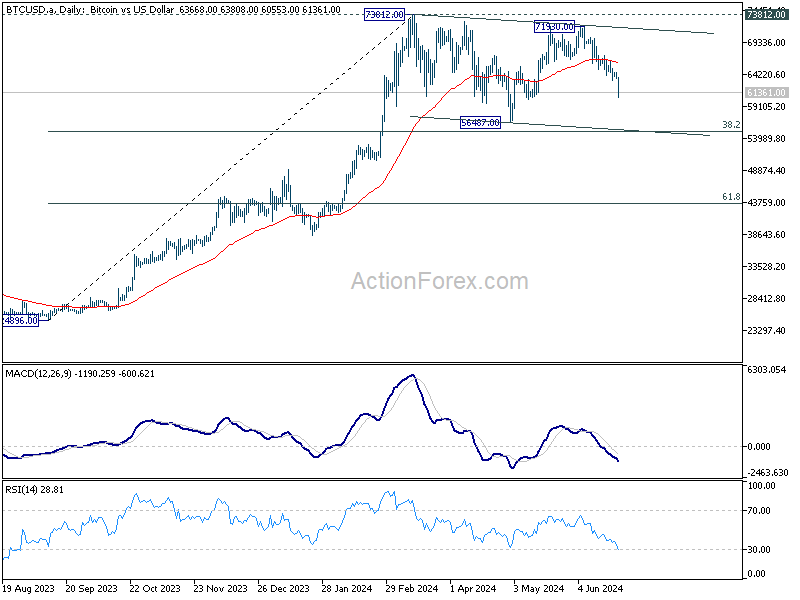
Technically, Bitcoin is now extending the corrective pattern from 73812, with fall from 71930 as the third leg. Deeper decline could be seen in the near term to 56487 support. Strong downside should be contained by 38.2% retracement of 24896 to 73812 at 55126 to bring rebound. Meanwhile, sustained break of 55 D EMA (now at 66019) will suggest that Bitcoin is ready for another test on 73812 again.
In Europe, at the time of writing, FTSE is up 0.43%. DAX is up 0.54%. CAC is up 0.83%. UK 10-year yield is up 0.001 at 4.089. Germany 10-year yield is up 0.015 at 2.427. Earlier in Asia, Nikkei rose 0.54%. Hong Kong HSI fell -0.00%. China Shanghai SSE fell -1.17%. Singapore Strait Times rose 0.25%. Japan 10-year JGB yield rose 0.0138 to 0.991.
German Ifo falls to 88.6, struggling to overcome stagnation
German Ifo Business Climate fell from 89.3 to 88.6 in June, below expectation of 89.7. Current Assessment index was unchanged at 88.3, below expectation of 88.4. Expectations Index fell from 90.3 to 89.0, below expectation of 91.0.
Ifo said that the German economy is "having difficulty overcoming stagnation".
By sector, manufacturing fell from -6.5 to -9.2. Services rose from 1.8 to 4.2. Trade fell from -17. to -23.5. Construction ticked up from -25.6 to -25.0.
BoJ deliberates on rate hikes, Yen depreciation, and JGB purchase adjustments
During Monetary Policy Meeting on June 13-14, BoJ board discussed the need for adjustments in response to rising inflation risks. One key opinion indicated that if April Outlook Report's economic and inflation forecasts are realized, BoJ will raise the policy interest rate and adjust monetary accommodation.
Another member warned that prices could "deviate upward" from the baseline scenario if recent cost increases are passed on to consumers, suggesting a need for further policy adjustments from a "risk management" perspective. It's also highlighted the growing "upside risks" to prices, with one member stating these risks have affected consumer sentiment and that the policy interest rate should be raised "not too late" if appropriate.
The impact of Yen's depreciation was also discussed, with an opinion suggesting an "upward revision" to the inflation outlook, warranting a higher risk-neutral policy interest rate. Some members emphasized the importance of basing monetary policy on the "overall picture of developments in economic activity and prices," rather than short-term foreign exchange fluctuations. They stressed that policy should be informed by trends in prices and wage developments.
Regarding asset purchases, one opinion recommended reducing the purchase amount of Japanese government bonds to allow long-term interest rates to form more freely in financial markets. This reduction should be "sizeable" and "predictable," while ensuring flexibility to maintain stability in JGB market.
New Zealand's goods exports reach record high in may, trade surplus exceeds expectations
New Zealand's goods exports rose by 2.9% yoy to NZD 7.2B in May, marking the first time that monthly exports have surpassed the NZD 7B mark. Goods imports also saw a slight increase, rising by 0.6% yoy to NZD 7.0B. This resulted in a trade surplus of NZD 204m, exceeding the expected NZD 155m.
Breaking down the top monthly export movements by country, New Zealand saw mixed results. Exports to China fell by -12% yoy, and exports to Australia dropped by -3.8% yoy. In contrast, exports to the US surged by 33% yoy, while exports to the EU and Japan rose by 2.8% yoy and 12% yoy, respectively.
On the import side, imports from China increased by 2.6% yoy, while imports from the EU decreased by -1.8% yoy. Imports from Australia -4.7% yoy, whereas imports from the US and South Korea rose by 1.6% yoy and 5.8% yoy, respectively.
USD/JPY Mid-Day Outlook
Daily Pivots: (S1) 159.02; (P) 159.44; (R1) 160.22; More...
Despite the deep but brief retreat, intraday bias in USD/JPY stays mildly on the upside with 158.65 minor support intact. Current rally should target 160.20 high, or possibly to 100% projection of 151.86 to 157.70 from 154.53 at 160.37. Upside could be limited there, at least on first attempt. On the downside, below 158.24 minor support will turn intraday bias neutral first. However, decisive break of 160.37 will pave the way to 161.8% projection at 163.97.
In the bigger picture, there is no sign of long term trend reversal yet. Further rally is expected as long as 150.87 resistance turned support holds. Decisive break of 160.02 will target 100% projection of 127.20 to 151.89 from 140.25 at 164.94.
Economic Indicators Update
| GMT | Ccy | Events | Actual | Forecast | Previous | Revised |
|---|---|---|---|---|---|---|
| 22:45 | NZD | Trade Balance (NZD) May | 204M | 155M | 91M | -3M |
| 23:50 | JPY | BoJ Summary of Opinions | ||||
| 08:00 | EUR | Germany IFO Business Climate Jun | 88.6 | 89.7 | 89.3 | |
| 08:00 | EUR | Germany IFO Current Assessment Jun | 88.3 | 88.4 | 88.3 | |
| 08:00 | EUR | Germany IFO Expectations Jun | 89 | 91 | 90.4 | 90.3 |
EUR/USD: Bounce Needs to Clear 1.0760 Barrier to Signal Stronger Correction
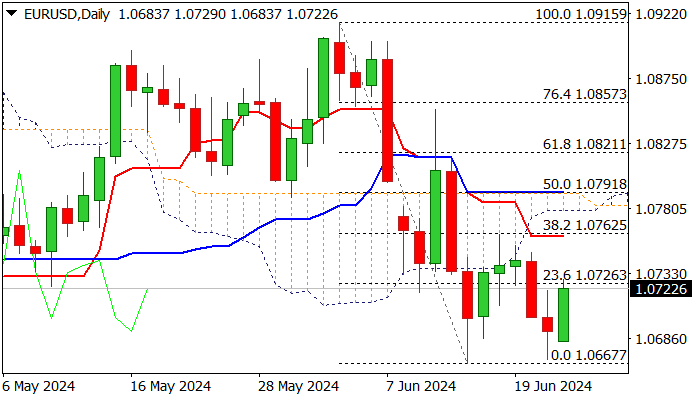
EURUSD bounces on Monday, as traders collect profits from Thu/Fri fall.
The single currency regained traction despite weaker than expected German Ifo data, as sentiment improves on growing expectations on ECB rate cut, following recent weak economic data.
Markets shift focus to US PCE data and French election, due this week and expected to generate fresh signals.
Formation of a double-bottom at 1.0670 zone on daily chart and likely bullish engulfing, generate initial signal, along with magnetic daily cloud twist on Wednesday.
However, the downside is expected to remain vulnerable as long as current bounce stays below upper pivots at 1.0760 zone (daily Tenkan-sen / Fibo 38.2% of 1.0915/1.0667), as 14-d momentum is deeply in negative territory and adds to warning of limited correction of larger downtrend.
Firm break through 1.0760/80 zone is needed to ease downside risk, though a number of strong barriers lays above and would make recovery attempts more difficult.
Res: 1.0731; 1.0760; 1.0785; 1.0800.
Sup: 1.0700; 1.0667; 1.0649; 1.0624.
EUR/JPY Outlook: Hits New Record High
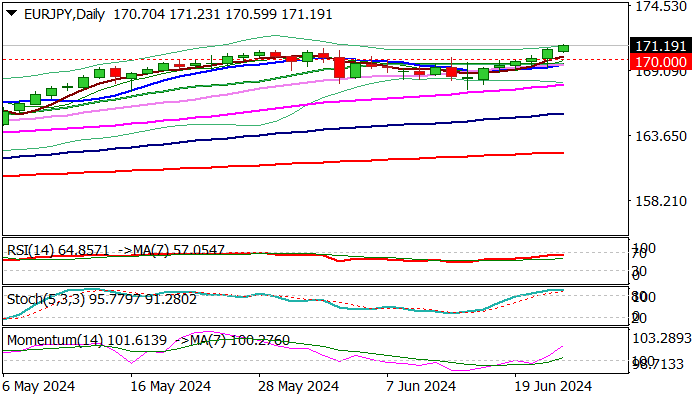
EURJPY continues to trend higher and extends steep upleg into sixth straight day, to hit new record high above 171 mark in early Monday trading.
Bulls firmly hold grip despite overbought conditions and signals from Japan’s authorities about the intervention to support falling yen, which came under increased pressure after dovish BoJ’s stance in the last meeting.
The pair is on track for the first monthly close above psychological 170 level, with last week’s significant gains and completion of bullish engulfing pattern on weekly chart, as well as long tail on last week’s candle, adding to positive signals.
However, initial warnings about rally’s stall cannot be ignored.
Technical studies are overbought on daily and monthly chart, where a loss of bullish momentum is evident, but any firmer signals are still to be seen.
Until then, we will hold in bullish mode, but with increased caution and tightened stops.
Broken 170 level and 2008 former record high (169.95) reverted to solid supports, reinforced by nearby converging 20/10 DMA’s (169.65/60), loss of which to generate stronger bearish signal and open way for deeper pullback.
Res: 171.50; 172.00; 172.20; 172.96.
Sup: 171.00; 170.60; 170.00; 169.60.
Instrument of the Week (June 24—28): GBPAUD Outlook
The GBPAUD pair represents the exchange rate between the British Pound and the Australian Dollar, serving as a crucial metric of economic interaction between the United Kingdom and Australia. Monetary policy changes, economic reports, and political developments heavily influence the GBP. In particular, it’s sensitive to European changes, given the UK’s significant economic ties to the region. On the other hand, the AUD is impacted by Australia’s commodity-based economy, with prices of natural resources like iron ore and coal playing a critical role and shifts in economic stability within the Asia-Pacific region. This makes the GBPAUD pair extremely reactive to changes in economic indicators and policy adjustments from both countries.
Reserve Bank of Australia Assistant Governor Kent Speaks, June 26, 1:35 (GMT+2)
If Assistant Governor Kent delivers a more optimistic economic outlook than anticipated, suggesting robust growth and potential tightening monetary policy, the Australian Dollar will likely strengthen. This appreciation of the AUD would generally lead to a decrease in the GBPAUD exchange rate. Conversely, if Kent’s speech delivers a less favorable view of the economy, possibly hinting at prolonged monetary easing due to slower recovery or economic setbacks, it would likely weaken the AUD.
UK Gross Domestic Product (GDP) QoQ, June 28, 08:00 (GMT+2)
Should the upcoming UK GDP data reveal growth exceeding the forecast of 0.6%, it indicates a more robust economic recovery than analysts predicted. Such an outcome would bolster the GBP by demonstrating the resilience and strength of the UK economy, leading to a potential increase in the GBPAUD exchange rate as investor confidence in the GBP grows. Alternatively, if the GDP figures are disappointing and show weaker growth than forecasted, it would raise concerns about the pace of economic recovery in the UK.
In the Daily timeframe, GBPAUD has formed a symmetrical triangle pattern, and the price has reached the lower trend line. The moving averages indicate bearish sentiment, but the %R shows extremely oversold, which creates two possible scenarios.
- If the bears push the price below 1.9000, breaking the lower trend line, GBPAUD will fly down to 1.8650;
- A rebound from the support will send the price to the upper trend resistance at 1.9340.

USD/JPY: Verbal Intervention Intensified But Real Intervention May Have to Wait
- The USD/JPY has traded higher in the past 7 sessions and printed an intraday high of 159.85 last Friday, 21 June which coincided with its 34-year high of 160.23 printed on 26 April.
- Last week’s persistent JPY weakness prompted Japan’s Ministry of Finance Vice Minister-in-charge of the FX market to issue a “firmer” verbal intervention.
- The current upmove of USD/JPY is more orderly rather than excessive which may not trigger an actual FX intervention from MoF.
- Watch the key medium-term support of 156.50 on the USD/JPY.
- The key first medium-term resistance zone of USD/JPY is at 161.10/162.40 also coincides with the potential “excessive threshold” levels of 161.85/95.
The USD/JPY and other G-10 Japanese yen crosses have staged only a minor decline and managed to hold above their respective 50-day moving averages as support zones on in early June before being propelled higher.
G-10 yen crosses traded higher since mid-June

Fig 1: 1-month of rolling performances of G-10 JPY crosses as of 24 Jun 2024 (Source: TradingView, click to enlarge chart)
Since 13 June, the USD/JPY has had seven consecutive sessions of higher daily closes, and it continued its march northwards to print an intraday high of 159.85 last Friday, 21 June just a whisker away from its 34-year high of 160.23 hit on 29 April that triggered a record amount of US$62.2 billion in FX intervention by Bank of Japan (BoJ) to prop up the yen for the period between 26 April to 29 May.
Last week, the drop in the JPY was accompanied by a backdrop of lackluster key Japan economic data; a continuation of demand-driven core-core inflation (excluding fresh food and energy) deceleration to 2.1% y/y in May, its lowest pace of increase since September 2022 from 2.4% y/y in April. Also, services activities, one of the key sources of growth engine in Japan for the past two years have contracted for the first time since August 2022 where the preliminary Jibun Bank Japan Services PMI slipped to 49.8 in June from 53.8 in May.
These softer prints of Japanese economic data may prompt BoJ to delay its next interest rate hike to September coupled with the near-term uptick in geopolitical risk premium coming out from the Eurozone due to the looming first round of French legislative elections scheduled this Sunday, 30 June that support potential bids on the US dollar due to safe-haven demand.
“Firmer” verbal intervention from the Ministry of Finance
Last week’s persistent weakness inflicted on the JPY ahead of two related risk events this week; the first round of the French legislative elections outcome over the weekend as well as this Friday, 28 June release of US PCE inflation data for May has prompted, Japan top currency official, MoF Vice Finance Minister Kanda to issue a firmly worded verbal intervention in today’s early Asian session that stated Japan can intervene in the FX market, 24 hours a day if needed in the event of excessive moves based on speculations.
So far, there are no significant movements in the USD/JPY as it continued to trade in a tight intraday range of 30 pips, closer to last Friday, 21 June high of 159.85; quoted at 159.70 at this time of the writing.
The recent movements of the USD/JPY weakness seem more “orderly” than “excessive”
Earlier this year, a public speech made by MoF Vice Finance Minister Kanda implied an excessive movement in the USD/JPY was either a 10-yen big figure drop over a month or a 4% drop in about two weeks.
Hence, the potential “excessive” threshold levels to watch are likely at 161.85 (using the month of May’s USD/JPY intraday low of 151.85), and 161.95 (based on a 2-week rolling +4% measurement on the USD/JPY from its intra-week low of 155.72 for the week of 10 June).
Daily RSI momentum has not reached an extreme overbought level

Fig 2: USD/JPY medium-term & major trends as of 24 Jun 2024 (Source: TradingView, click to enlarge chart)
In the lens of technical analysis, the current upmove of the USD/JPYUY from its 4 June low of 154.55 has not led it to an extreme overbought level as highlighted by the daily RSI momentum indicator.
The daily RSI is now hovering at around the 68 level which is still below the key extreme overbought zone of 80.50/88.10 hit previously where it coincided with the prior FX Interventions to strengthen the yen on 21 October 2022 and most recently, the suspected one on 26 April.
Overall, the major and medium-term uptrend phases remain intact with key medium-term pivotal support at 156.50 (also the rising 50-day moving average). A clearance above 160.30 sees the next medium-term resistance zone to come in at 161.10/162.40 also coincides with the potential “excessive threshold” levels of 161.85/95.
On the other hand, a break below 156.50 damages the medium-term uptrend for a potentially steeper corrective decline move within its major uptrend phase to expose the next support at 154.30, and below it may see the major support zone of 151.95/150.70 (also the 200-day moving average).
Yen Steadies After Dreadful Week
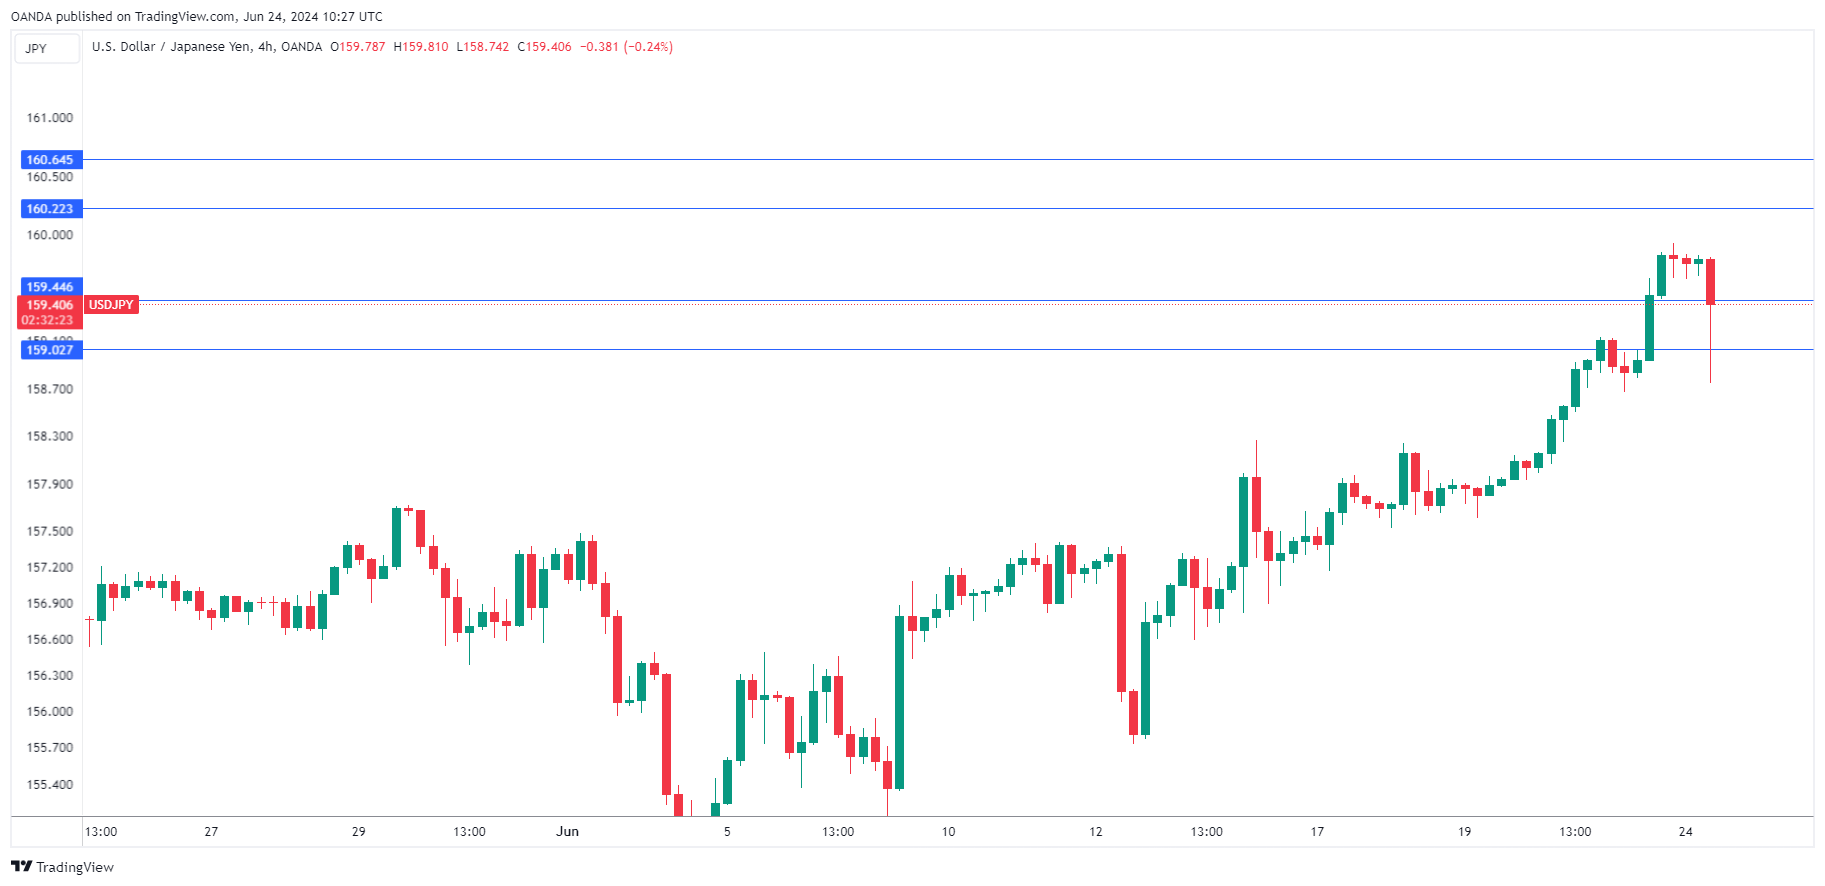
The Japanese yen has posted gains on Monday. In the European session, USD/JPY is trading at 159.26, down 0.10%. The yen hasn’t had a winning daily session since June 19th and declined 1.5% last week. On the data front, Japan releases the Services Producer Price Index. There are no economic releases in the US but FOMC members Waller and Daly will make public statements.
BoJ hesitant to raise rates
The Bank of Japan released its summary of opinion from the June meeting on Monday. The market responded with a shrug, as the yen showed little reaction. One member called for a rate hike “without too much delay” but other members were more cautious about raising rates. The BoJ stated at its meeting earlier this month that it would provide details of tapering its massive stimulus at the July meeting and is yet to commit to higher rates.
With the Federal Reserve grappling with sticky inflation and signaling only one rate cut this year, the US/Japan rate differential is unlikely to narrow. That will make it an uphill battle for the yen to gain some ground on the US dollar.
The yen is trading close to the psychological 160 level and is close to 34-year lows. On Monday, Japan’s top currency official, Masota Kanda, delivered some verbal intervention, stating that he would take “appropriate action” in the event of “excessive moves based on speculation”. The threat of intervention by Tokyo could be preventing that yen from breaking out above 160, a level which has held since late April.
If the BoJ fails to deliver some major changes in monetary policy, it appears that the yen will continue to weaken, which will raise the possibility of currency intervention.
USD/JPY Technical
- USD/JPY pushed below support levels at 159.44 and 159.02 earlier. Below, there is support at 158.24
- There is resistance at 160.22 and 160.64
American Apathy Supports Oil
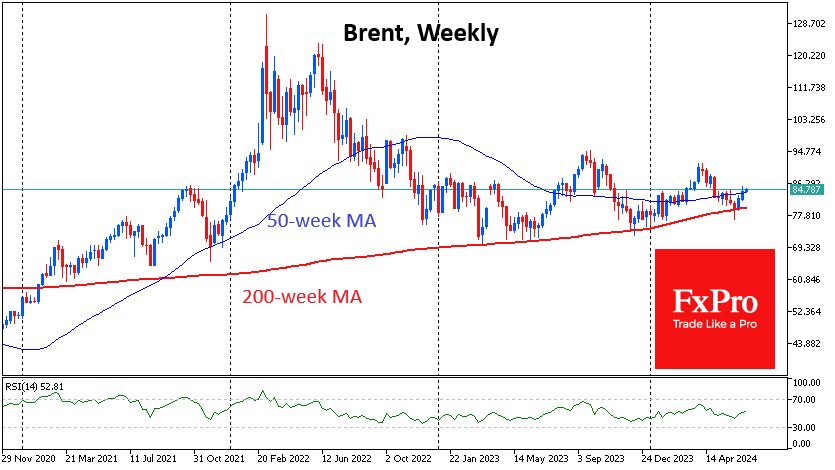
The price of crude Oil rose steadily in the previous fortnight and is starting the new week with a positive trend. This rise emphasises the importance of the 200-week moving average, below which the price has not fallen for a long time for more than three years.
The OPEC+ meeting in early June rattled the bulls’ nerves, briefly pushing the price below this line, but this once again attracted buyers. The 200-week average acts as a long-term trend indicator, marking the average price level over nearly four years—about half of the traditional business cycle. Regular touches of this line raise the question that the world economy is walking on the edge of recession but avoiding it for now.
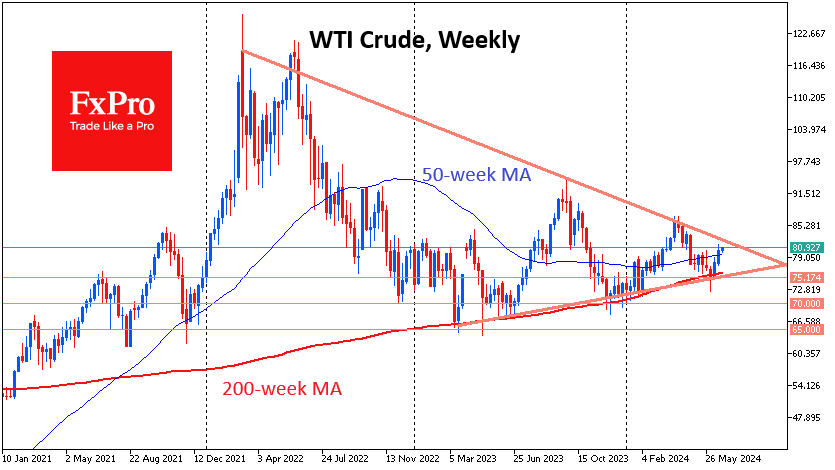
However, this curve is pointing upwards, having risen 17% since the start of 2023 to $76.2 in WTI and $80 in Brent. These are the highest values since 2016, but far from the $100s that were in Oil’s previous bull cycle, which ended in 2014.
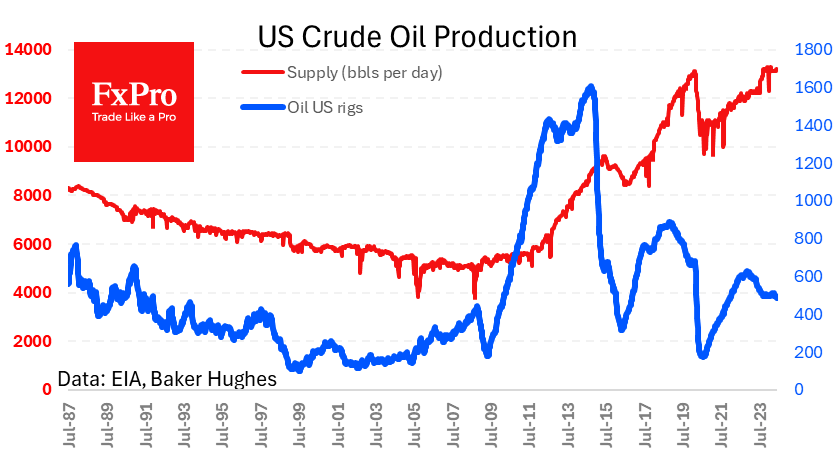
The apathy of US oil producers has characterised this bull cycle. We continue to get data on falling drilling activity from Baker Hughes and stagnant production. According to the latest data, 485 oil rigs were active last week and 588 total (minus 3 and 2 for the week, respectively). These are the lowest values in two and a half years.
A separate report from the Department of Energy shows continued smooth replenishment of the strategic fuel reserve (the highest in 14 months). Commercial stocks are almost in line with last year’s levels after rising since the start of the year.
Production levels have returned to 13.2 million BPD in the previous two weeks after 13 weeks of declines to 13.1 million.
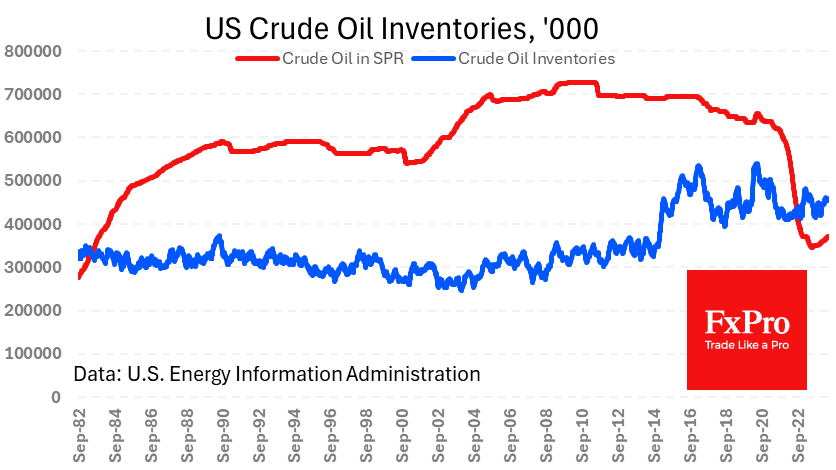
Simply put, US oil producers are satisfied with the status quo and seek to balance production at current prices. This neutral American stance is complemented by the actively bullish stance of OPEC+ countries, which are keen to keep a net deficit in the market, at least in words. At the same time, a downturn in demand in Europe and weakness in China are balancing the situation.
Perhaps only tech analysis will help to wade through the geopolitical twists and turns in Oil. For more than two years, the price has been forming a global triangle with local highs of $120, $94, and $86, and lows of $65, $70, and $75. Now, the price is closer to the previous high, but only its overcoming can signal the final choice of direction. Until then, Oil is within a declining volatility trend with a preferred mean reversion tactic.