Sample Category Title
Japanese Yen Slightly Rises Against USD
The Japanese yen slightly increased against the US dollar on Monday, with the USD/JPY pair holding near 156.73.
Investors have already priced in previous remarks from Bank of Japan (BoJ) officials. BoJ Governor Kazuo Ueda emphasized the need to anchor inflation expectations before revisiting interest rate decisions, highlighting the challenge of accurately determining the necessary interest rate level.
BoJ Deputy Governor Shinichi Uchida stated that the final battle against deflation is close, predicting continued wage growth.
Last week, the yen experienced pressure from statistics, which reflected a slowdown in Japan's core inflation to 2.2% in April from 2.6% in March, with food inflation contributing significantly to the decrease. Overall inflation fell to 2.5% in April from 2.7% in March, marking the second consecutive month of decline. Given the BoJ's efforts to reduce price pressure, these figures are concerning.
Externally, the yen experienced further pressure from robust US economic data and the hawkish tone of the Fed minutes.
Technical analysis of USD/JPY
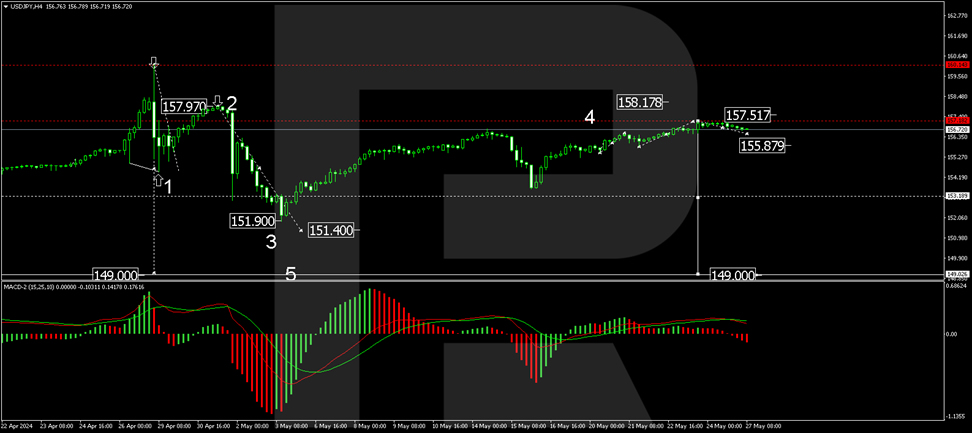
On the H4 chart, USD/JPY has completed a correction wave towards 157.18 and is now forming a consolidation range below this level. An upward breakout could extend the structure to 157.51. Conversely, a downward breakout could initiate a new decline wave towards 153.20, potentially extending to 149.00. This scenario is technically supported by the MACD indicator, with its signal line above zero and pointing strictly downwards.
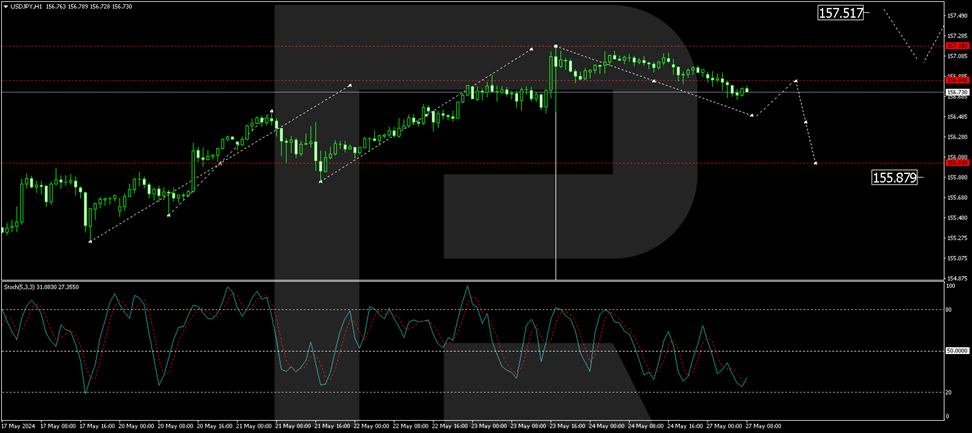
On the H1 chart, USD/JPY has completed a growth wave towards 157.18, followed by a downward impulse to 156.84. A narrow consolidation range has now formed around this level. A downward breakout from this range could lead to a continuation of the decline to 156.50, with a subsequent correction to 156.84 (testing from below). Further decline to 155.90 is possible. This scenario is technically confirmed by the Stochastic oscillator, with its signal line below 50 and ready to drop to 20.
Summary
The Japanese yen's slight rise against the US dollar is influenced by BoJ officials' comments and recent economic data. Technical indicators suggest the potential for both upward and downward movements, with significant support and resistance levels to watch. Investors should closely monitor these levels and market conditions.
Dollar Index outlook: Stands at the Back Foot Ahead of Key Economic Releases This Week
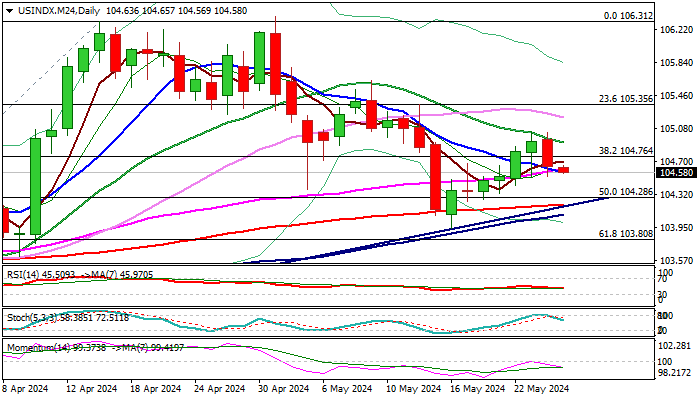
The dollar moved within a narrow range in Asian / early European session on Monday, but near-term picture remains bearishly aligned, weighed by Friday’s 0.3% drop and formation of bearish engulfing pattern on daily chart.
Rising negative momentum adds to downside risk, though close within daily cloud (top lays at 104.65) and firm break of 10DMA (104.57) which kept the downside protected in past four sessions, is required to generate fresh bearish signal and expose next pivotal supports at 104.35/20 (Fibo 61.8% of 103.67/105.03 / daily cloud base/ bull-trendline, reinforced by 200DMA).
Conversely, repeated close above daily cloud top would ease immediate downside pressure and keep in play prospects for fresh recovery as rising daily cloud continues to underpin the upleg from 103.93 (May 16 low).
The US will be shut today for holiday and lower volumes may keep the action limited, with focus shifting on releases of German and EU inflation, as well as US Personal Consumption Expenditure price index, Fed’s preferred inflation measure, which will provide fresh signals to the US and European central banks and influence dollar’s performance in coming days.
Res: 104.77; 105.03; 105.15; 105.43.
Sup: 104.35; 104.20; 103.93; 103.80.
DAX Elliott Wave: Buying the Dips at the Blue Box Area
Hello fellow traders. In this article we’re going to take a quick look at the Elliott Wave charts of DAX published in members area of the website. DAX is showing impulsive bullish sequences in the cycle from the October 2023 low. Recently we got a 3 waves pull back that has ended right at the Blue Box zone (buying area). In the further text we are going to explain the Elliott Wave Forecast and trading setup.
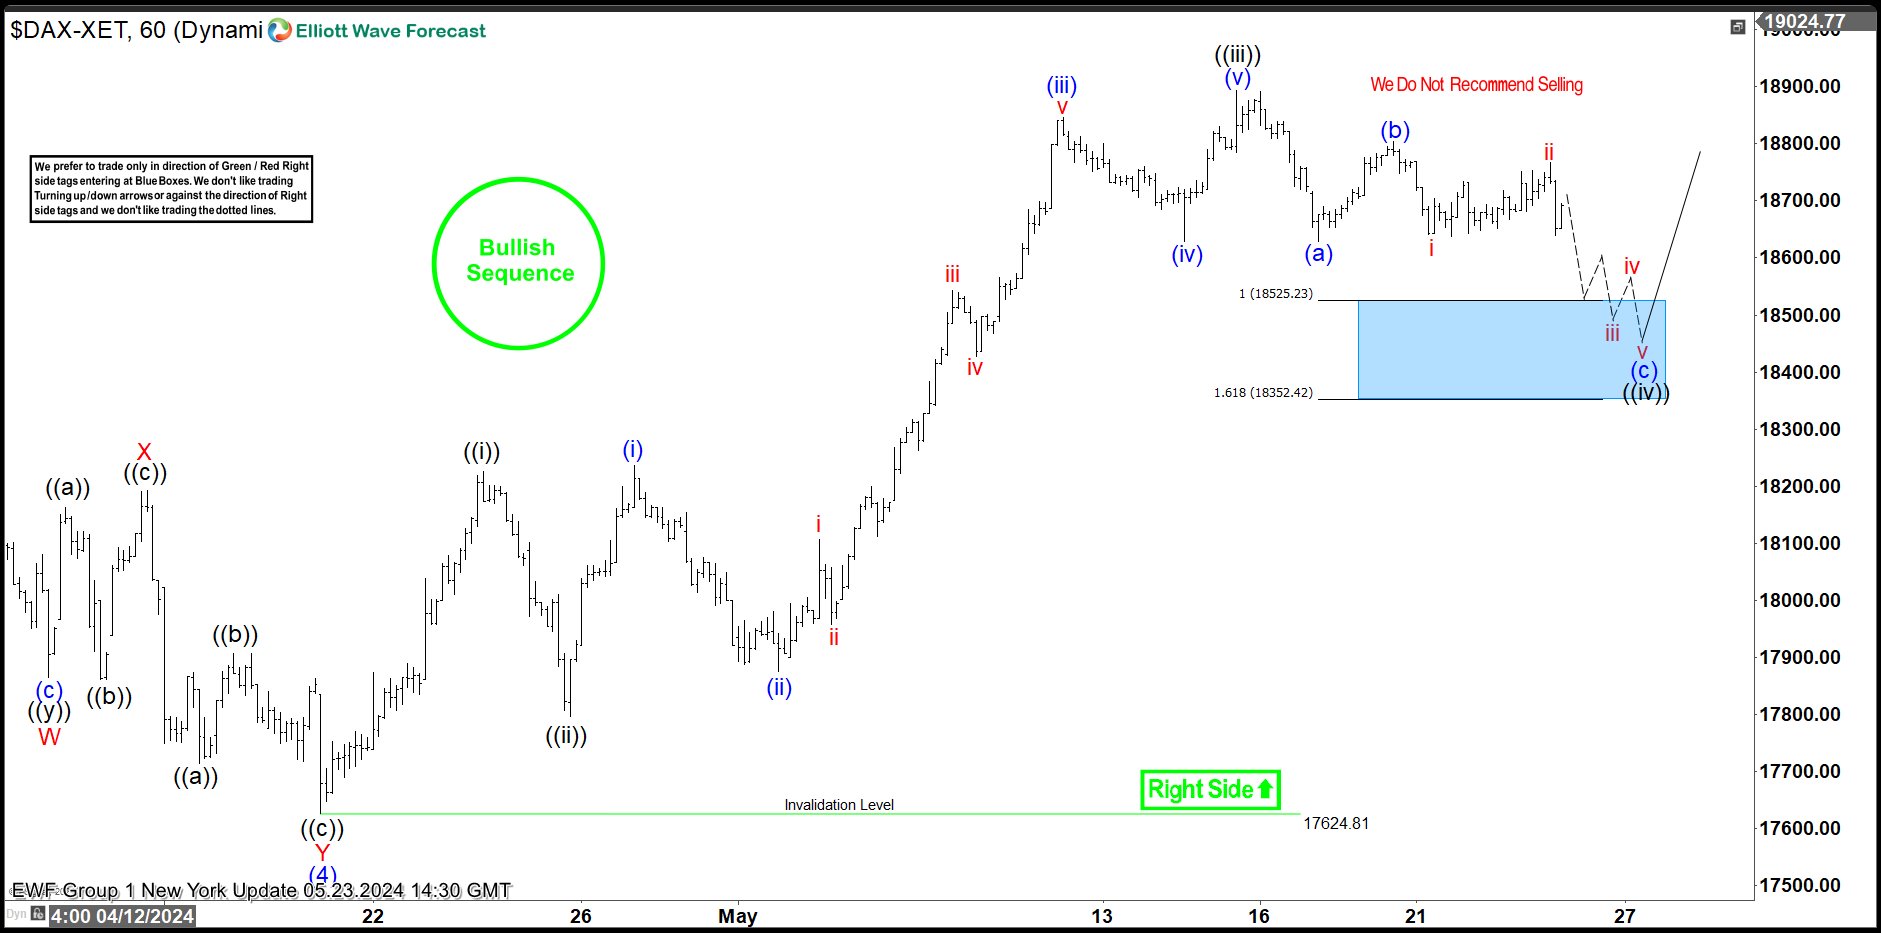
DAX Elliott Wave 1 Hour Chart 05.23.2024
DAX remains bullish against the 17624.8 pivot. The Index is currently giving us pull back in 3 waves , wave ((iv)) black. The price made 5 waves from the peak, suggesting DAX ended only first leg (a) of ((iv)) that is unfolding as Elliott Wave Zig Zag pattern. We expect DAX to make another leg down toward extreme area at 18525.23-15352.42 blue box ( buying zone). From there, DAX index should ideally make a rally toward new highs or 3 waves bounce alternatively .As our members know Blue boxes are based on 100% – 161.8% Fibonacci extension area , that we trade in 3, 7, or 11 swing corrective sequence.
Once the price touches the 50 fibs against the (b) blue connector, we’ll make positions risk-free and set the stop loss at breakeven and book partial profits. Breaking below the 1.618 Fibonacci extension level at 15352.42 would invalidate the trade.
Official trading strategy on How to trade 3, 7, or 11 swing and equal leg is explained in details in Educational Video, available for members viewing inside the membership area.
Quick reminder on how to trade our charts :
Red bearish stamp+ blue box = Selling Setup
Green bullish stamp+ blue box = Buying Setup
Charts with Black stamps are not tradable. 🚫
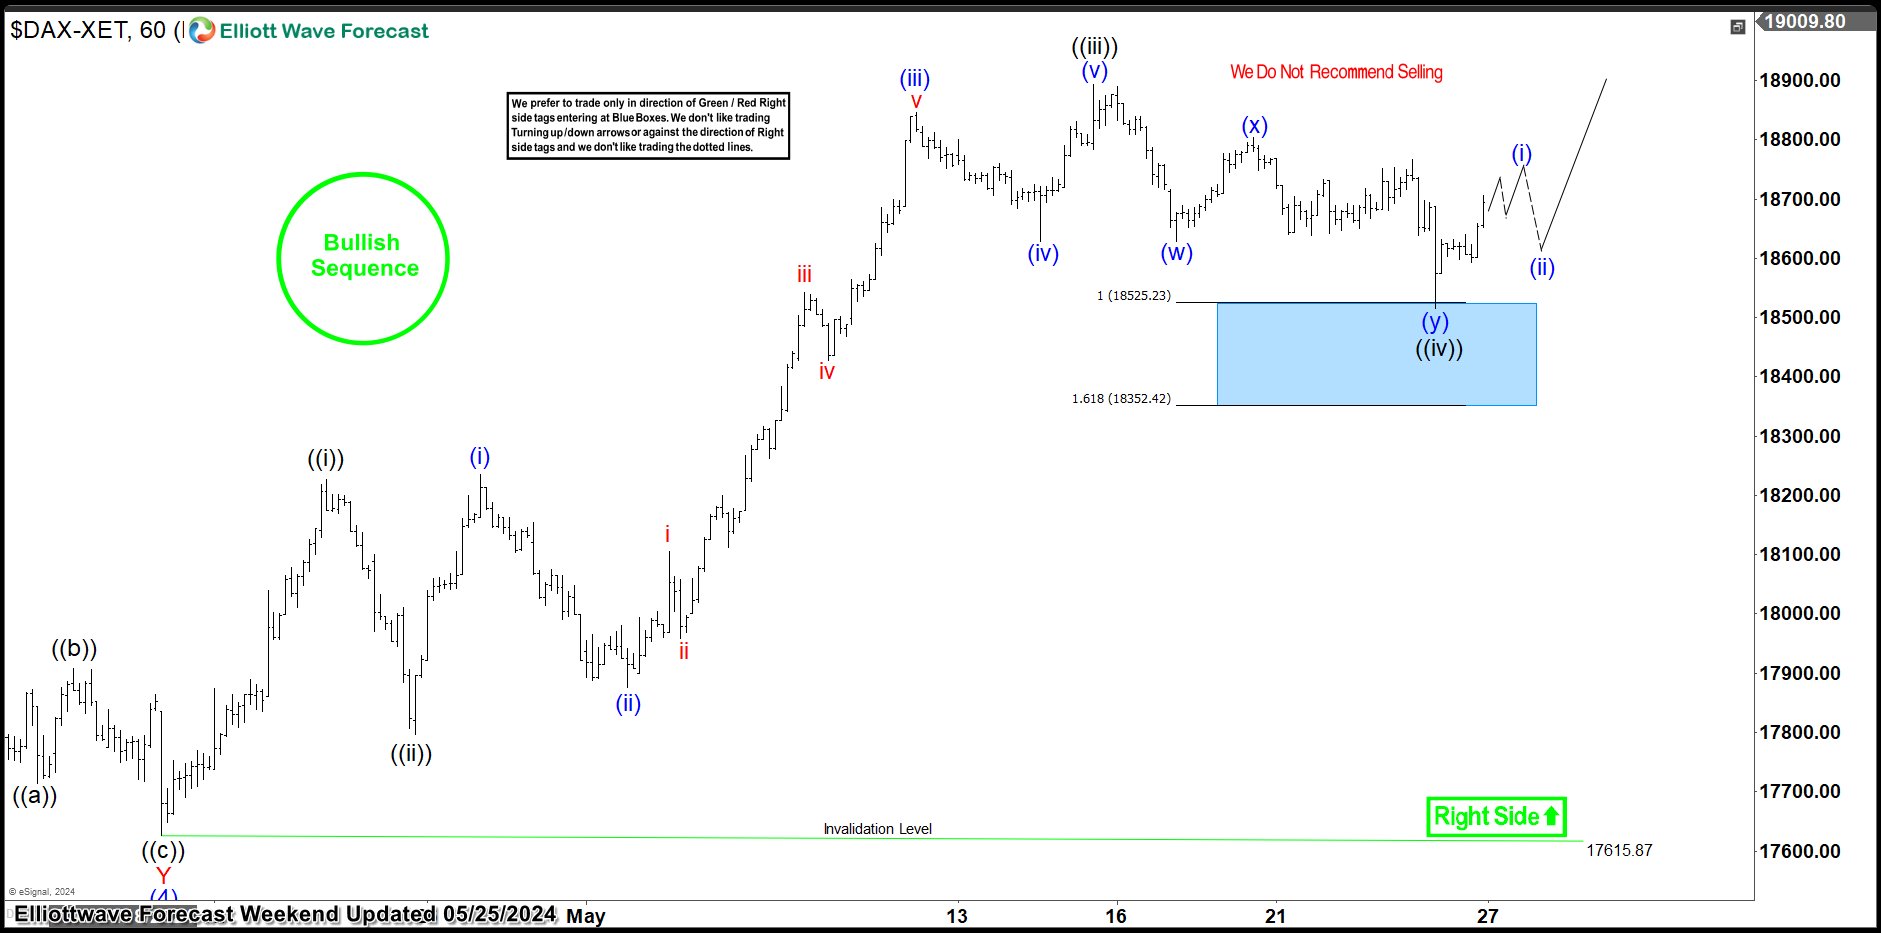
DAX Elliott Wave 1 Hour Chart 05.25.2024
DAX the drop toward our Blue Box area and found buyers as expected. We got nice reaction from our buying zone. The index has reached and exceeded 50 fibs against the (b) blue high. So members who took the long trade are enjoying profits now in a risk free positions. We would like to see break of (iii) black high, to confirm next leg up is in progress.
USD/JPY Analysis: The Market is Indecisive Near Its Peak Since May 1
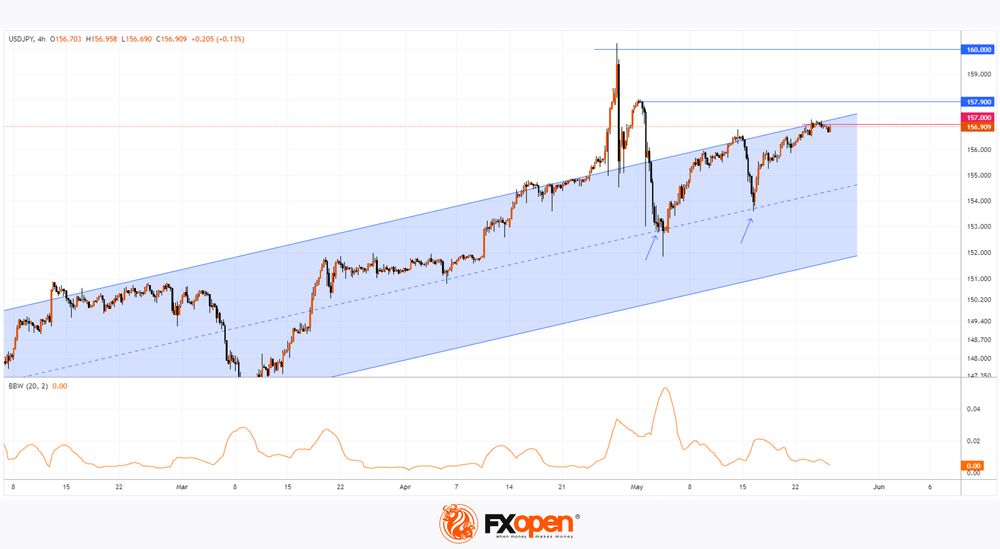
As the USD/JPY chart shows today:
→ The price is in an upward trend (indicated by the blue channel) that has been relevant since the beginning of 2024.
→ On Thursday, May 23, the exchange rate nearly reached 157.2 yen per US dollar, surpassing the peak of May 14.
→ Following this, the market began to stabilise – indicated by the Bollinger Bands' width showing low volatility, which can be interpreted as a sign of market equilibrium or indecision among participants.
What balances the market? The equilibrium of supply and demand forces and the anticipation of important news in the week ahead.
Bullish arguments:
→ The price has twice (shown by arrows) rebounded sharply from the median line of the upward channel. On both occasions, bulls managed to reverse aggressive declines in the USD/JPY price and return to the upper line.
→ The Bank of Japan's interest rates are much lower than those in the US. Judging by the latest US economic data, the Federal Reserve may maintain high rates for a longer period.
Bearish arguments:
→ We do not see continued upward momentum in the price after surpassing the May 14 peak. Moreover, the USD/JPY price cannot sustain above the "round" level of 157.00.
→ The price is near the upper boundary of the channel, which could act as resistance.
→ It is important to note the levels of 160 and 157.9 in the background, from which the price fell sharply, indicating possible intervention by the Bank of Japan to support the excessively weak yen.
Given that today is a holiday for financial institutions in the US and the UK, indecision may continue until tomorrow when Japan's inflation data is released at 8:00 GMT+3. Also noteworthy:
→ US GDP news will be published on Thursday at 15:30 GMT+3.
→ The US Personal Consumption Expenditures (PCE) index will be released on Friday at 15:30 GMT+3.
These and other fundamental drivers may disrupt the current balance of the USD/JPY price, which still appears stable for now.
Trade over 50 forex markets 24 hours a day with FXOpen. Take advantage of low commissions, deep liquidity, and spreads from 0.0 pips. Open your FXOpen account now or learn more about trading forex with FXOpen.
This article represents the opinion of the Companies operating under the FXOpen brand only. It is not to be construed as an offer, solicitation, or recommendation with respect to products and services provided by the Companies operating under the FXOpen brand, nor is it to be considered financial advice.
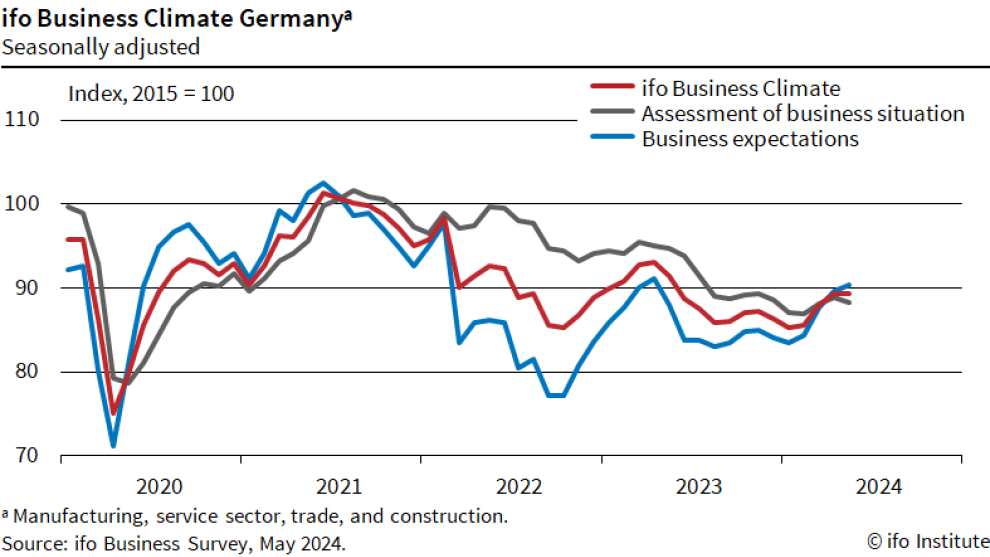
German Ifo steady at 89.3, working out of crisis step by step
German Ifo Business Climate was unchanged to 89.3 in May, below expectation of 90.3. Current Assessment Index fell from 88.9 to 88.3, below expectation of 89.9. Expectations Index rose from 89.7 to 90.4, slightly below expectation of 90.5.
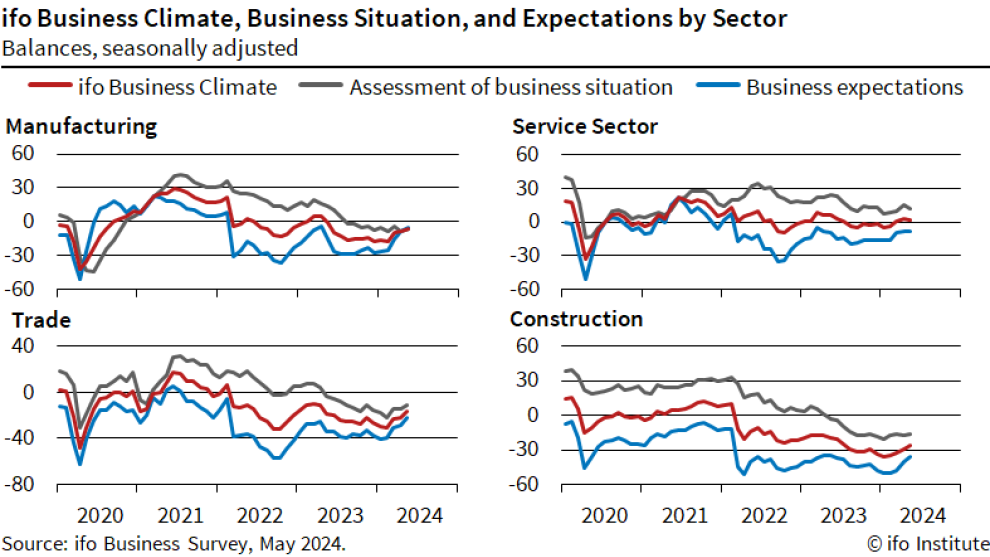
By sector, manufacturing rose from -8.6 to -6.2. Services fell from 3.2 to 1.8. Trade rose from -22.0 to -16.9. Construction rose from -28.9 to -26.0.
Ifo said, "The manufacturing, trade, and construction sectors are recovering, although the service sector took a slight hit. Germany's economy is working its way out of the crisis step by step."
EURUSD Ticks Up Before Testing Descending Trendline
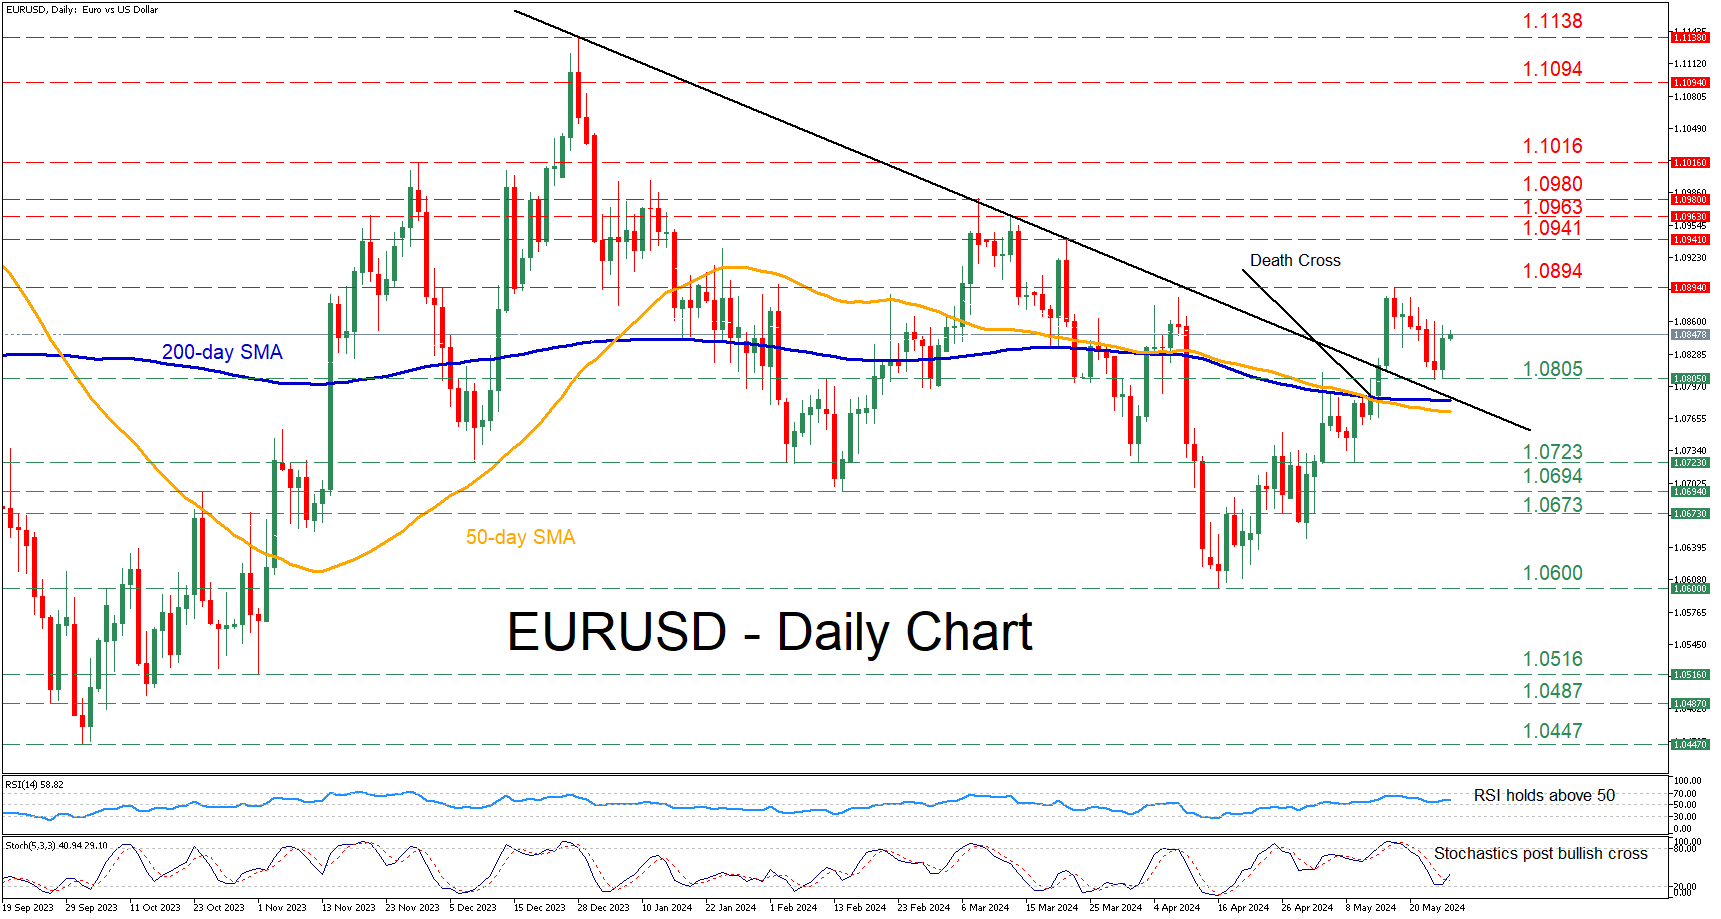
- EURUSD retreats from a fresh 2-month high of 1.0894
- But meets support a tad above its long-term restrictive trendline
- Oscillators suggest bulls remain in charge despite the latest drop
EURUSD had been in a steady advance following its 2024 bottom of 1.0600 on April 16. However, the pair reversed lower after its rejection at a fresh two-month high of 1.0894 in mid-May, with the price finding strong support just above its long-term downward sloping trendline.
Should the latest uptick gain momentum, the price might revisit the recent two-month peak of 1.0894. Conquering that hurdle, the bulls may attack a series of lower highs that have formed the pair’s descending trendline such as 1.0941, 1.0963 and 1.0980 all registered in March.
Alternatively, if the short-term weakness persists, the recent support of 1.0805 could act as the first line of defence. Violating that zone, the pair could challenge the descending trendline in place since December 2023 before it descends towards 1.0723, a region that provided support in February, April and May. A violation of that barrier could set the stage for the February bottom of 1.0694.
In brief, EURUSD came under some selling pressure after posting a fresh two-month high of 1.0894, but the bulls appear to retain the upper hand. That being said, a break below the crucial downward sloping trendline is needed for the technical picture to shift back to bearish.
Crypto Market Struggles With Downtrend, Ethereum Tests Resistance
Market picture
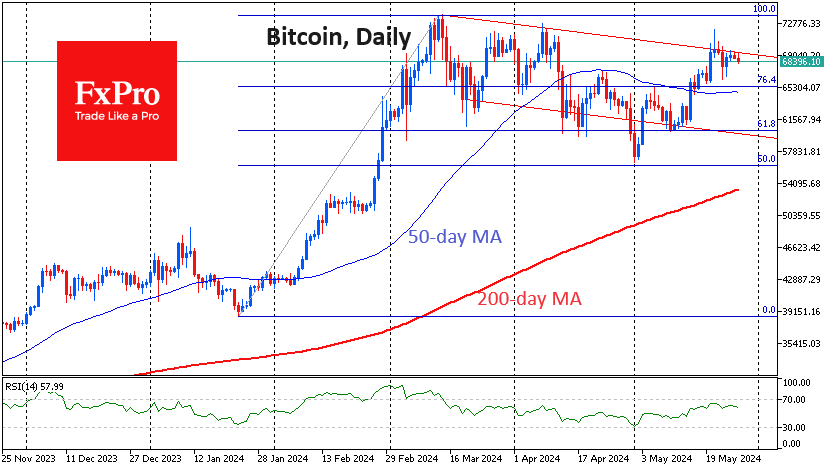
Crypto market capitalisation rose 6.2% in seven days to $2.57 trillion, approaching the area of this year’s highs above $2.7 trillion. Bitcoin’s price, like the overall market capitalisation chart, tests the upper boundary of the downward range that has been in force since March.
The break of this downtrend is the ability to consolidate above the last local high. For the crypto market, this is the $2.63 trillion area, and for Bitcoin, it is $71.6K. An alternative negative scenario suggests a return to the lower end of the range, just above $2.12 trillion and around $60K for Bitcoin.
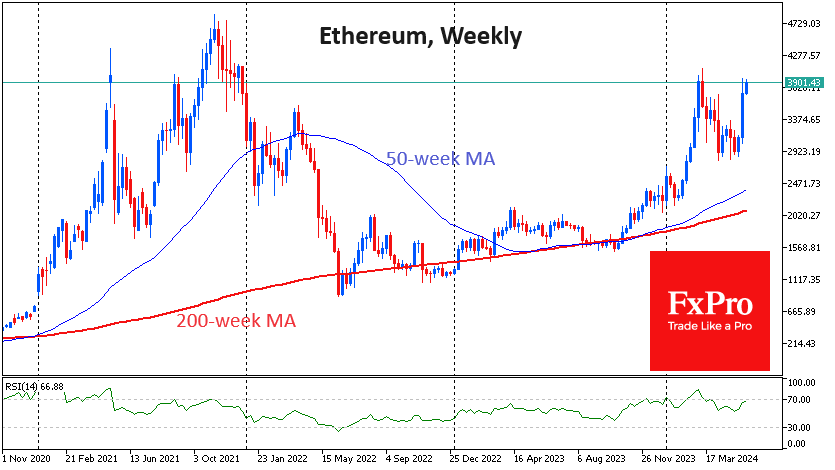
Ethereum has not abandoned its attempt to overcome $4000, hovering above $3900 early in the day on Monday. The ability to overcome this psychologically important round level could quickly take the price to the highs of November 2021, in the $4600-4800 area.
News background
According to JPMorgan, the SEC’s approval of the spot Ethereum-ETF is a political decision ahead of the US presidential election. The decision was made immediately after the US House of Representatives approved the FIT21 bill on cryptocurrencies.
The new stage for crypto-ETFs may start in 2025. Standard Chartered believes that Solana and XRP are the next cryptocurrencies in line to launch ETFs. The bank predicts increased dominance of Bitcoin and Ethereum. TD Cowen admits that ETFs for a “basket of cryptocurrencies” will appear within a year.
Analyst Captain Faibik draws attention to the breakdown of the lower boundary of the “rising wedge” figure on the weekly chart of Bitcoin dominance. In his opinion, it means the beginning of the altcoin season. At the same time, the BTC dominance rate may fall from the current 54% to 45%.
Cinneamhain Ventures admits that the regulator’s similar “way of thinking” may spread to tokens of other projects. However, some experts note that the SEC may still classify the staked-locked Ethereum as a security.
According to Bloomberg, the bankrupt FTX exchange has completed a series of auctions to sell $2.6bn worth of Solana (SOL) tokens at significant discounts to the market price. The coins are locked in vesting for four years, but the gradual unlocking will begin in a few months.
XAU/USD: Thick Daily Cloud Contained Sharp Pullback But Fresh Recovery So Far Lacks Strength
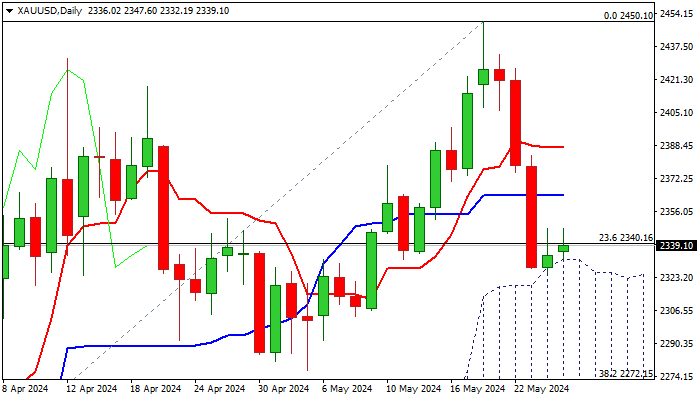
Gold price edges higher in early trading on Monday after last week’s 5% pullback from new record high found solid ground at $2327/25, provided by the top of thick rising daily Ichimoku cloud.
Partial profit taking lifted the price, although recovery was mild so far and facing headwinds from initial barrier provided by 20DMA ($2348).
Technical studies on daily chart show positive momentum and oversold stochastic, which is supportive for recovery, but MA’s are in mixed setup and partially cloud bullish outlook.
Recovery needs to register close above upper pivots at $2373/76 (Fibo 38.2% of $2450/$2325 / 10DMA) to firm the structure and open way for attack at next key barriers at $2387 (50% retracement) and $2400/02 (psychological / Fibo 61.8%) above which to signal an end of a healthy correction and shift near-term focus. fully to the upside.
On the other hand, the downside remains vulnerable in the current configuration, but daily cloud provides good support and near-term action is expected to remain biased higher while the price stays above the cloud.
Lower volumes due to US holiday likely to keep the metal’s action in a quieter mode on Monday, while traders await release of US PCE Index, Fed’s preferred inflation gauge (due on Friday, May 31) which will provide more details about Fed’s action in coming months and generate stronger direction signals.
Caution on penetration of rising daily cloud which would increase downside risk and expose key support at 2300 (psychological / 55DMA) and $2277/72 (recent range floor / Fibo 38.2% of $1984/$2450).
Res: 2348; 2363; 2376; 2387.
Sup: 2332; 2320; 2300; 2277.
EUR/USD Daily Outlook
Daily Pivots: (S1) 1.0815; (P) 1.0836; (R1) 1.0868; More...
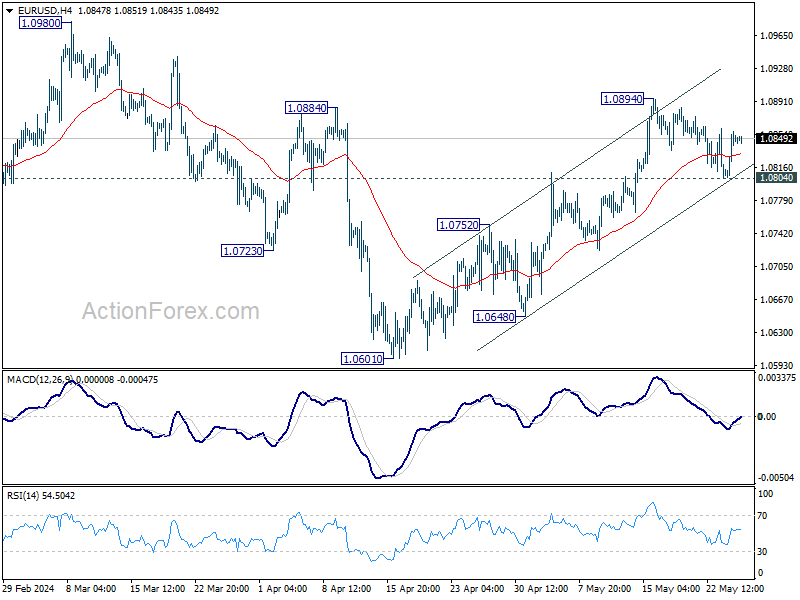
Intraday bias in EUR/USD stays neutral and further rise is mildly in favor. Break of 1.0894 will resume the rally from 1.0601 to 1.0980 resistance next. However, break of 1.0804 will turn bias back to the downside for 1.0752 resistance turned support.
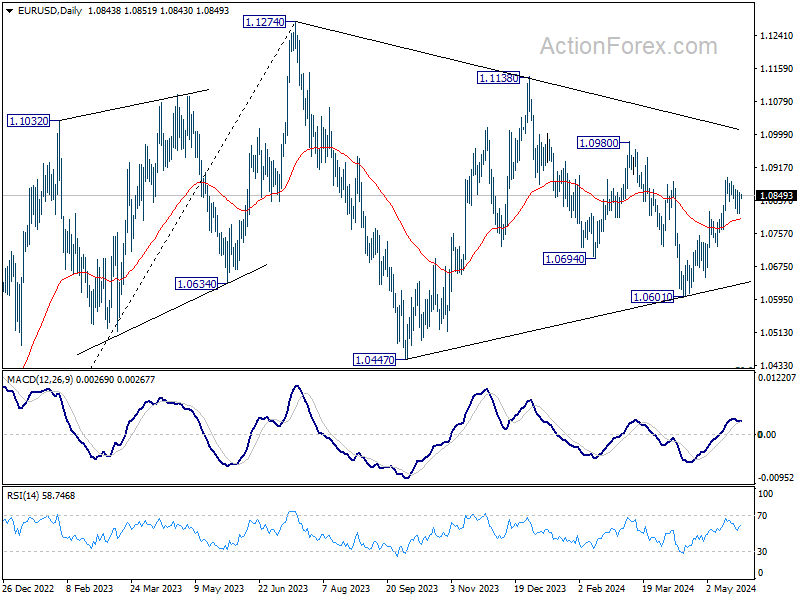
In the bigger picture, price actions from 1.1274 are viewed as a corrective pattern. Fall from 1.1138 is seen as the third leg and could have completed. Firm break of 1.1138 will argue that larger up trend from 0.9534 (2022 low) is ready to resume through 1.1274 high. On the downside, break of 1.0601 will extend the corrective pattern instead.
USD/JPY Daily Outlook
Daily Pivots: (S1) 156.83; (P) 156.99; (R1) 157.16; More...
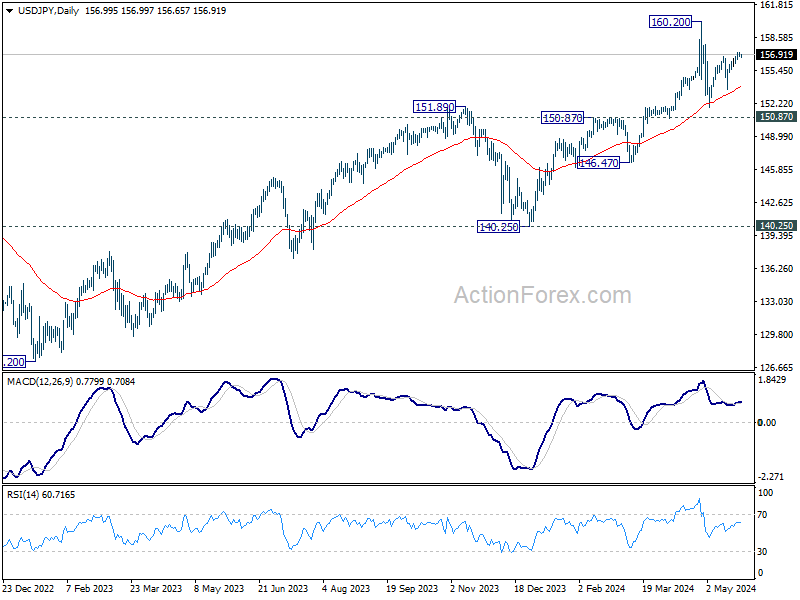
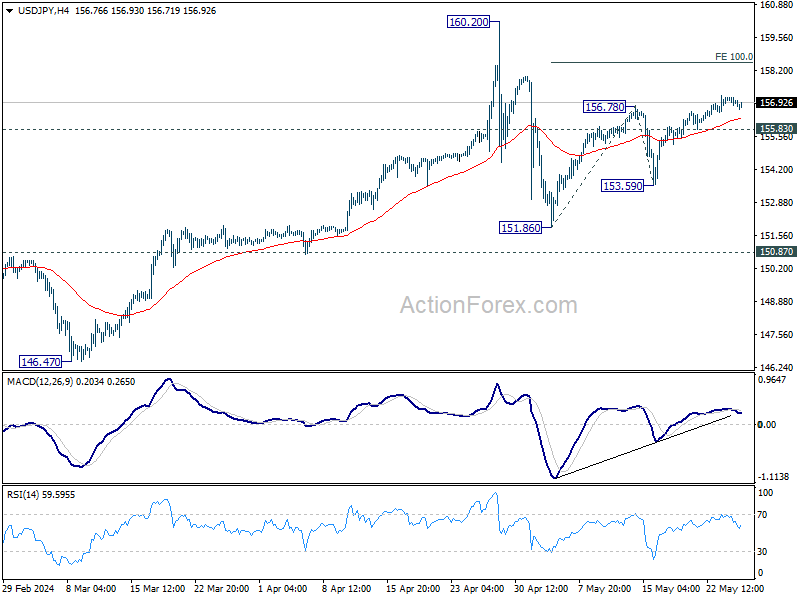
Intraday bias in USD/JPY remains mildly on the upside for 100% projection of 151.86 to 156.78 from 153.59 at 158.51. On the downside, below 155.83 minor support will turn intraday bias neutral first. Further break of 153.69 will target 151.86 and below as the third leg of the corrective pattern from 160.20.
In the bigger picture, a medium term top might be formed at 160.20. But as long as 150.87 resistance turned support holds, fall from there is seen as correcting rise from 150.25 only. However, decisive break of 150.87 will argue that larger correction is possibly underway, and target 146.47 support next.