Sample Category Title
GBPUSD Renews Positive Momentum Within Channel
- GBPUSD strengthens to a two-month high within bullish channel
- Short-term bias looks positive, but buying appetite might lose pace
- UK S&P Global PMIs and BoE member Pill on the agenda on Wednesday
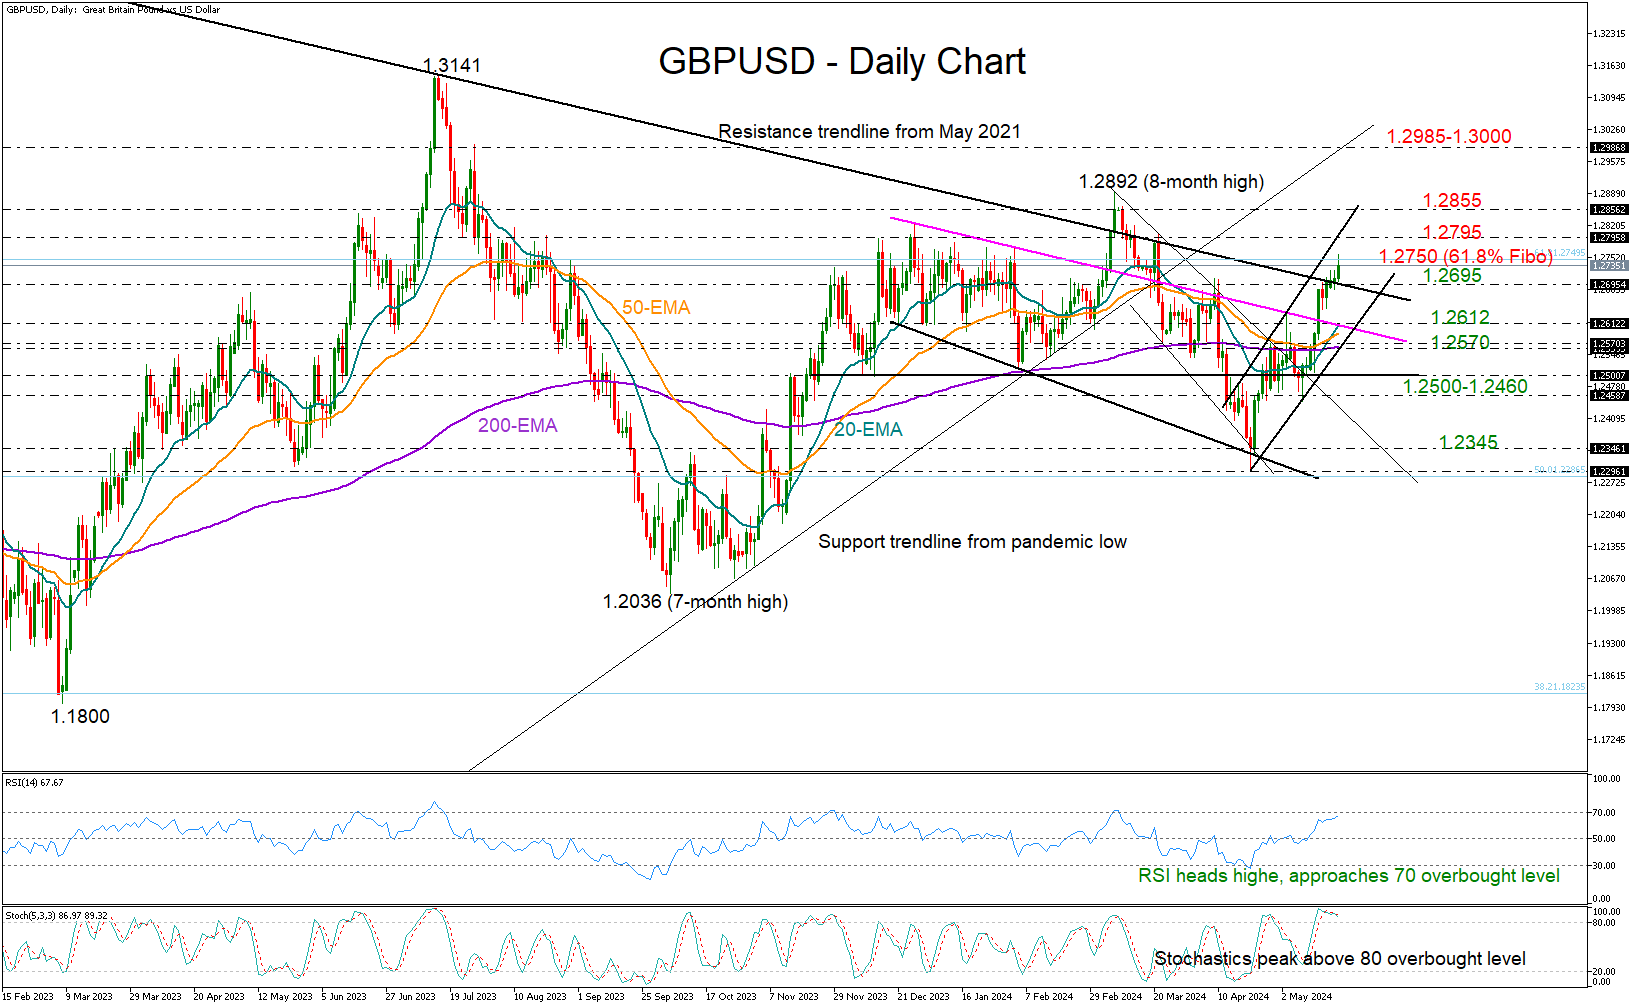
Following a short period of consolidation around the 1.2700 level, GBPUSD quickly climbed to a two-month peak of 1.2760, boosted by stronger-than-anticipated core UK CPI figures.
Technically, the pair pierced through the descending line drawn from May 2021, which rejected the bulls a month ago, increasing hopes that the bullish wave could gain additional legs in the coming sessions. The positive crossings in the exponential moving averages (EMAs) provide further endorsement for the market’s upward trajectory. Nevertheless, it may be wise to exercise caution given that the RSI is just below its overbought mark of 70 and the stochastic oscillator seems to have hit its peak above 80.
The 61.8% Fibonacci retracement of the dramatic 2021-2022 sell-off is currently limiting upside pressures near 1.2750 ahead of the upper boundary of the short-term bullish channel at 1.2795. Thus, the bulls must penetrate that obstacle to reach the significant resistance zone at 1.2855, which triggered the reversal in March. Should they succeed, the focus might shift to the broken support trendline from the pandemic lows at 1.2985.
Nonetheless, sellers could remain patient unless the price dips below the 1.2695 area. If that scenario plays out, they might target the 20-day EMA and the former resistance trendline at 1.2612. The channel’s lower boundary and the 200-day EMA could also provide a safety slightly lower at 1.2570. If this floor cracks too, the pair could slump towards the 1.2500 mark or lower to 1.2445.
In brief, the short-term forecast for GBPUSD is positive, especially if it manages to close above the 1.2750-1.2795 border.
Market Analysis: GBP/USD Climbs Steadily While EUR/GBP Struggles
GBP/USD is gaining pace above the 1.2640 resistance. EUR/GBP declined steadily below the 0.8565 and 0.8550 support levels.
Important Takeaways for GBP/USD and EUR/GBP Analysis Today
- The British Pound is attempting a fresh increase above 1.2700.
- There is a key bullish trend line forming with support near 1.2690 on the hourly chart of GBP/USD at FXOpen.
- EUR/GBP is trading in a bearish zone below the 0.8565 pivot level.
- There is a connecting bearish trend line forming with resistance near 0.8540 on the hourly chart at FXOpen.
GBP/USD Technical Analysis
On the hourly chart of GBP/USD at FXOpen, the pair remained well-bid above the 1.2520 level. The British Pound started a decent increase above the 1.2600 zone against the US Dollar.
The bulls were able to push the pair above the 50-hour simple moving average and 1.2640. The pair even climbed above 1.2700 and traded as high as 1.2726. Recently, there was a minor decline below the 23.6% Fib retracement level of the upward move from the 1.2656 swing low to the 1.2726 high, but the bulls were active above 1.2700.
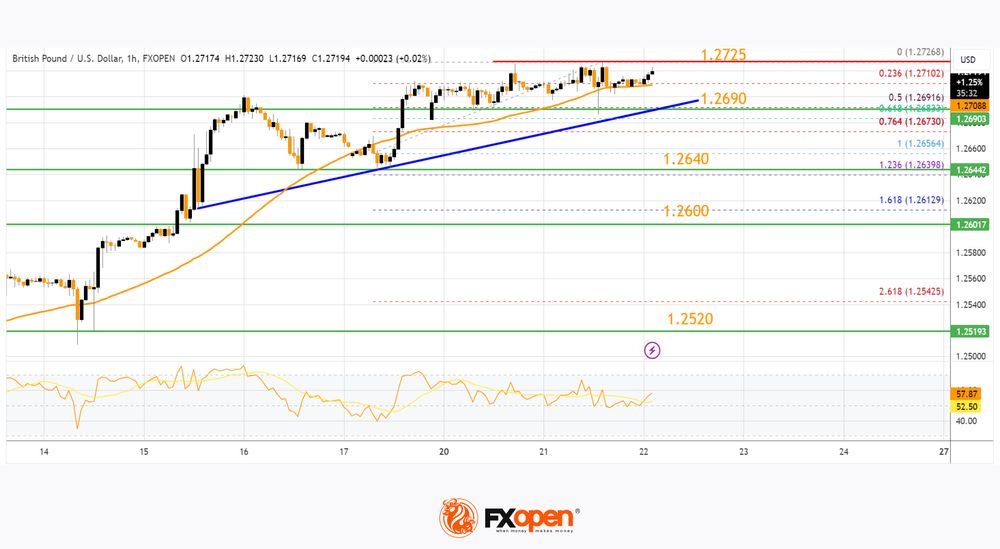
On the upside, the GBP/USD chart indicates that the pair is facing resistance near 1.2725. The next major resistance is near 1.2740.
A close above the 1.2740 resistance zone could open the doors for a move toward 1.2780. Any more gains might send GBP/USD toward 1.2850. On the downside, there is a key support forming near a bullish trend line at 1.2690. It is close to the 50% Fib retracement level of the upward move from the 1.2656 swing low to the 1.2726 high.
If there is a downside break below 1.2690, the pair could accelerate lower. The next major support is at 1.2640. The next key support is seen near 1.2600, below which the pair could test 1.2520. Any more losses could lead the pair toward the 1.2500 support.
EUR/GBP Technical Analysis
On the hourly chart of EUR/GBP at FXOpen, the pair started a steady decline from well above 0.8590. The Euro traded below the 0.8565 and 0.8550 support levels against the British Pound.
The EUR/GBP chart suggests that the pair even declined below the 0.8540 level and tested 0.8535. It is now consolidating losses and trading below the 50-hour simple moving average. The pair is now facing resistance near a connecting bearish trend line at 0.8540.
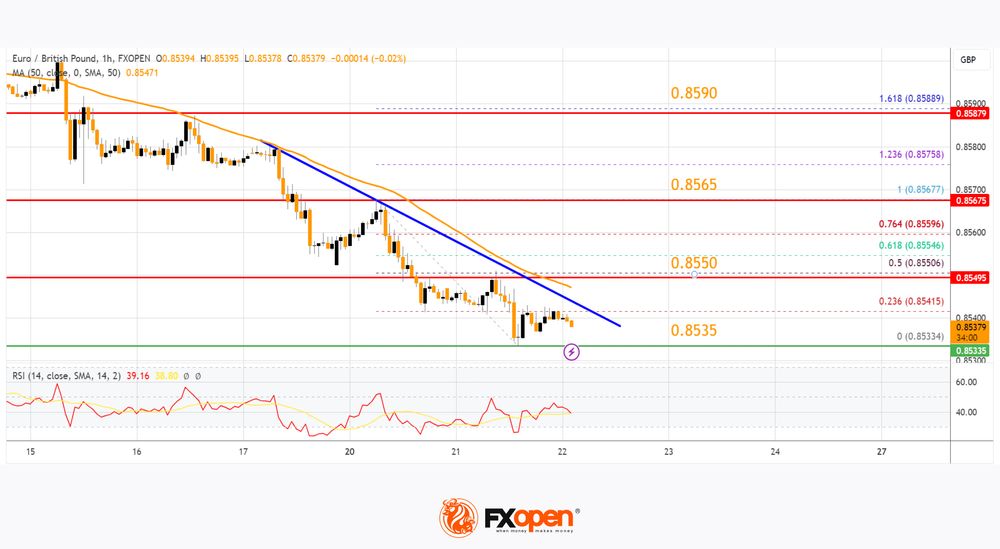
It is close to the 23.6% Fib retracement level of the downward move from the 0.8588 swing high to the 0.8533 low. The next major resistance could be 0.8550.
The 50% Fib retracement level of the downward move from the 0.8588 swing high to the 0.8533 low is also at 0.8550. A close above the 0.8550 level might accelerate gains. In the stated case, the bulls may perhaps aim for a test of 0.8565. Any more gains might send the pair toward the 0.8590 level.
Immediate support sits near 0.8535. The next major support is near 0.8510. A downside break below the 0.8510 support might call for more downsides. In the stated case, the pair could drop toward the 0.8480 support level.
Trade over 50 forex markets 24 hours a day with FXOpen. Take advantage of low commissions, deep liquidity, and spreads from 0.0 pips. Open your FXOpen account now or learn more about trading forex with FXOpen.
This article represents the opinion of the Companies operating under the FXOpen brand only. It is not to be construed as an offer, solicitation, or recommendation with respect to products and services provided by the Companies operating under the FXOpen brand, nor is it to be considered financial advice.
NZDUSD Posts New 2-Month High
- NZDUSD starts the day with strong upside momentum after RBNZ decision
- MACD and RSI tick higher
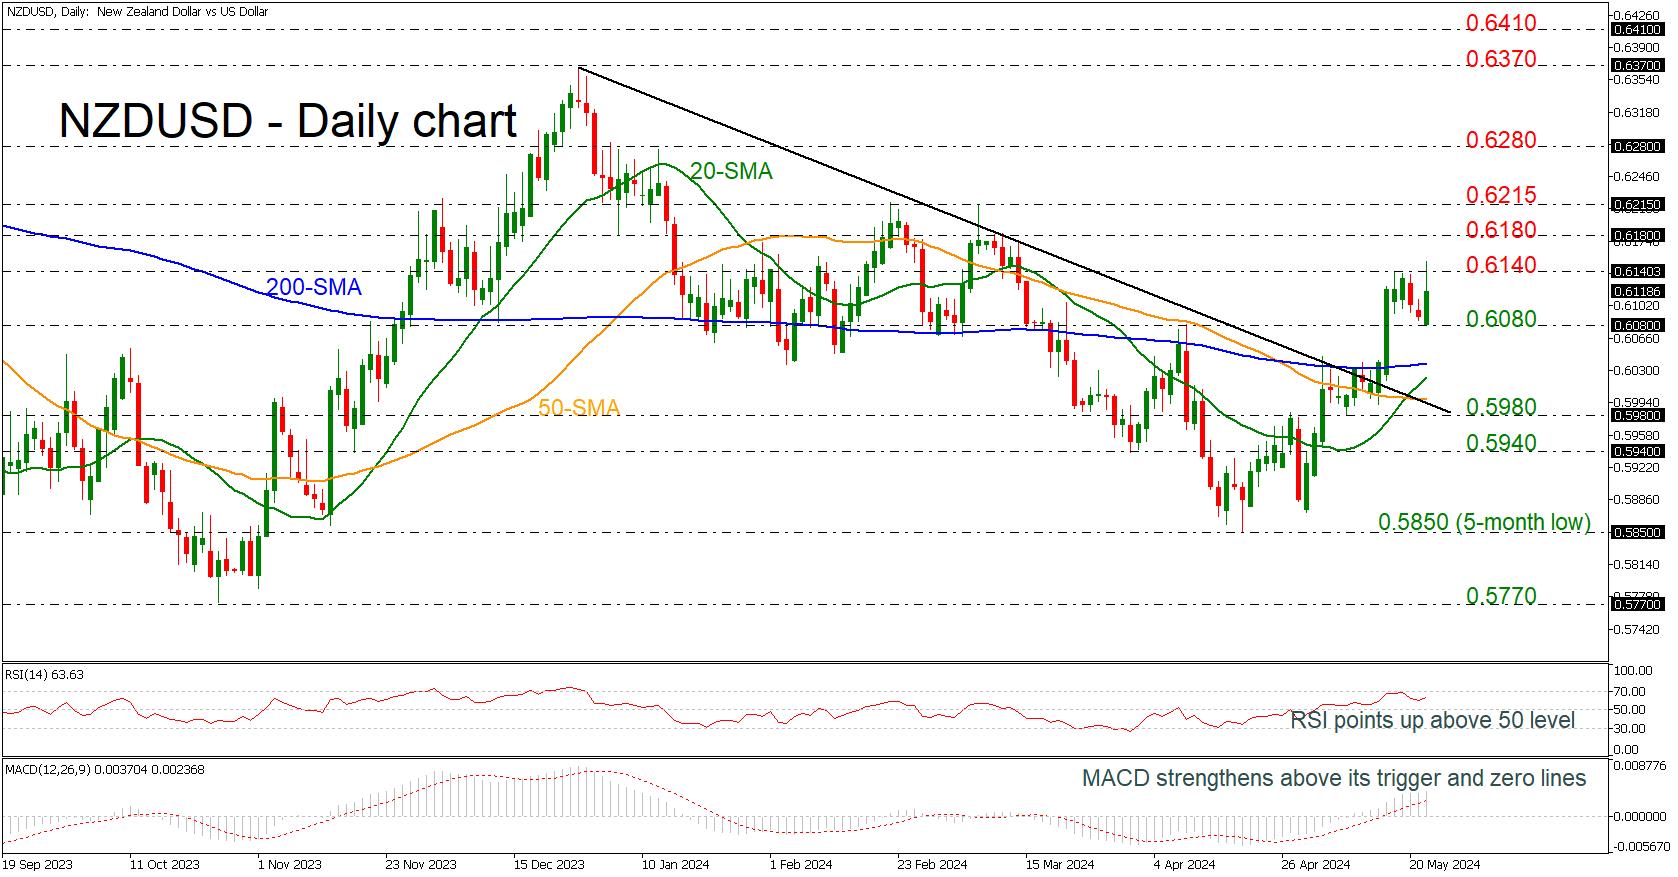
NZDUSD had an aggressive bullish start at the beginning of the day, following the bounce off the 0.6080 support level and creating a spike towards a fresh two-month high of 0.6151 after the RBNZ’s interest rate decision. The market has been developing well above the penetrated descending trend line since May 14 as well as above the strong obstacle of 200-day simple moving average (SMA).
The technical oscillators are indicating a strong bullish bias in the near term as the RSI is heading north and is moving towards the 70 level, while the MACD is standing above its trigger and zero lines.
In the event of an upward resumption above the 0.6140 resistance level, the bulls might take a breather near the 0.6180 barrier before stretching to the critical resistance near the March 7 high of 0.6215.
Nevertheless, the pair has key levels underneath for protection against selling forces. The 0.6080 support ahead of the 200-day SMA at 0.6040 may halt declines. If the bears take the lead, the pair could slip towards the 20- and the 50-day SMAs at 0.6020 and 0.6000 respectively before testing the 0.5980 support.
In brief, NZDUSD is boosting its bullish attitude but a rally above today’s high is needed to confirm an upside tendency.
Sterling Soars Once Again in the Wake of Consensus-Beating CPI
Markets
US Treasury and German yields both ended a fairly quiet trading day a few basis points lower. Fed’s Waller in a second speech yesterday said that he’d consider a rate cut at the end of the year (December) if the data warranted it. He added that policy was restrictive enough though, echoing comments made just a few hours earlier. ECB’s Lagarde in an interview aired yesterday sounded very confident of inflation returning to target. She stopped short of officially declaring price pressures under control. That’s raising some eyebrows since her outspoken optimism comes just two days ahead of critical data. The Q1 wage growth numbers won’t derail a June cut but it does offer a reason for cautiousness until the actual outcome is known. Currency markets saw the two majors keeping each other pretty much in balance. EUR/USD hovered within a tight sideways trading range, eventually closing marginally lower at 1.0854. DXY’s bottoming out process continued, advancing to 104.66. Sterling continues to trade (very) strong, both against USD (cable back > 1.27) and EUR. EUR/GBP lost for a fifth consecutive day to 0.854. Bank of England governor Bailey unveiled some of the central bank’s future modus operandi. It intends to replace the system of QE with repo operations to provide the financial system with liquidity. Doing so removes the interest rate risk which today is saddling up the central bank (and thus the UK government) with massive losses as it sheds low-coupon bonds in a higher interest rate environment. The switch may start in the second half of next year.
Sterling is soaring once again in the wake of consensus-beating CPI numbers that are nothing but a setback to the BoE eying a June cut amid hopes for a quick return to 2%. Headline (2.3% from 3.2%), core (3.9% from 4.2%) or services (5.9%, barely down from 6%) all topped estimates and push EUR/GBP to the lowest level since mid-March (0.8516). In the FOMC May meeting minutes markets will be looking for some more context to a hawkish statement change saying that “In recent months, there has been a lack of further progress toward the Committee’s 2 percent inflation objective” combined with Powell ruling out a rate hike and the decision to taper QT (US Treasuries from a $60bn monthly pace to $25bn). The (market) debate about the (increased or not) level of the neutral rate is a lively one and probably again filtered through in the Fed discussions as well. We stick to the idea of core bond yields having found a bottom end of last week. Sideways consolidation is possible for the time being. EUR/USD shows no clear directional signs.
News & Views
The Reserve Bank of New Zealand kept its policy rate (OCR) stable at 5.5%, but updated projections provided a hawkish twist. Forecasts continue to err to an additional (final) rate hike as a next move with rate cuts now only expected to start by end 2025 rather than by mid-2025. That’s a huge contrast with NZ money markets banking on a November rate cut. The RBNZ sees the OCR-rate at 3.75% instead of 3.5% by end 2026. In its policy statement, the RBNZ refers to slowly receding global services inflation and the delay in (Fed) rate cuts. Domestically, higher dwelling rents, insurance costs, council rates and other domestic service price inflation are interfering with the disinflationary impact of weaker capacity pressures and an easing labour market. Compared to February, the RBNZ upwardly revised its inflation forecast with annual inflation now expected to enter the 1%-3% target range in Q4 2024 instead of Q3 and reaching the mid-point by mid-2026 instead of end 2025. Therefore, monetary policy needs to remain restrictive to ensure inflation returns to target within a reasonable timeframe. NZD swap rate rise by 4.5 bps (30-yr) to 9 bps (2-yr) this morning. NZD/USD spiked from 0.6090 to 0.6150 before settling around 0.6120.
The Chinese Chamber of Commerce to the EU warned that the chief expert at the Chinese Automotive Technology & Research Center called for a temporary increase of the tariff rate on imported cars with engines larger than 2.5 liters to 25%. China imported 250k such cars last year, accounting for around 1/3rd of all vehicle imports. The comments come after the US announced 100% tariffs on electric cars with Europe contemplating similar action by June 5. China last week also hinted at retaliatory levies on European wine and dairy products.
Graphs
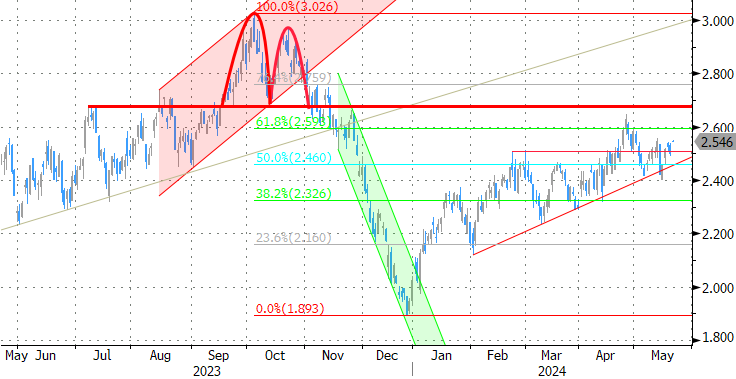
GE 10y yield
ECB President Lagarde clearly hinted at a summer (June) rate cut which has broad backing. EMU disinflation continued in April and brought headline CPI closer to the 2% target. Together with weak growth momentum, this gives backing to deliver a first 25 bps rate cut. A more bumpy inflation path in H2 2024 and the Fed’s higher for longer strategy make follow-up moves difficult. Markets have come to terms with that.
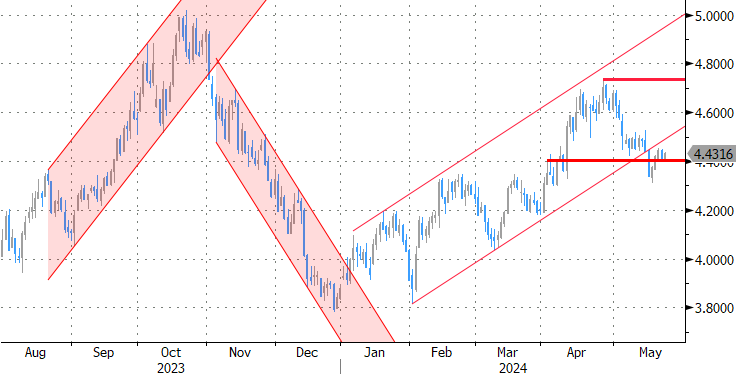
US 10y yield
The Fed in May acknowledged the lack of progress towards the 2% inflation objective, but Fed’s Powell left the door open for rate cuts later this year. Soft US ISM’s and weaker than expected payrolls supported markets’ hope on a first cut post summer, triggering a correction off YTD peak levels. Sticky inflation suggests any rate cut will be a tough balancing act. 4.37% (38% retracement Dec/April) already might prove strong support for the US 10-y yield.
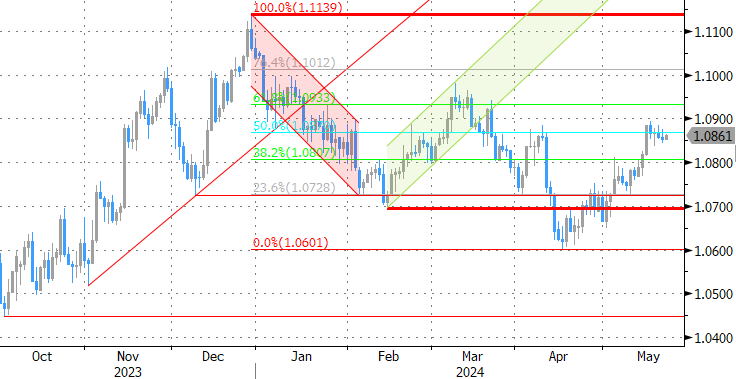
EUR/USD
Economic divergence, a likely desynchronized rate cut cycle with the ECB exceptionally taking the lead and higher than expected US CPI data pushed EUR/USD to the 1.06 area. From there, better EMU data gave the euro some breathing space. The dollar lost further momentum on softer than expected early May US data. Some further consolidation in the 1.07/1.09 are might be on the cards short-term.
EUR/GBP
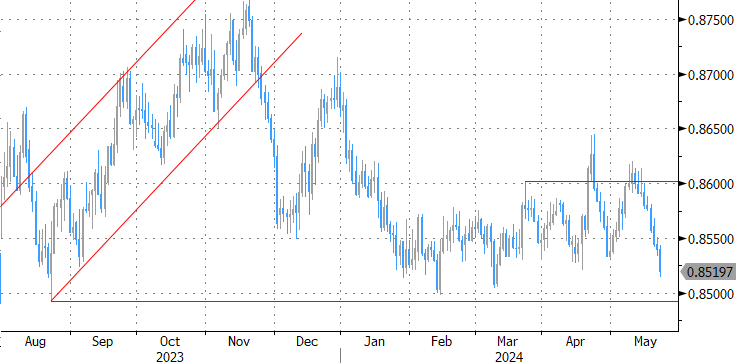
Debate at the Bank of England is focused at the timing of rate cuts. Most BoE members align with the ECB rather than with Fed view but slower than expected April disinflation complicated matters. A June cut looks in line with the ECB looks improbable. Sterling extends a recent bull rally. A test of EUR/GBP’s 2024 YtD low (0.8489) is possible. We expect this important support level to hold.
Nvidia’s Stock Price Has Doubled Since the Beginning of this Year
Federal Reserve’s (Fed) Christopher Waller gave a C+ to the latest US inflation data, saying that it’s ‘far from failing but it’s not stellar’. Equity investors, however, continue giving the US stock indices a big, fat A+ on robust earnings, yes, but also on hope that the Fed could cut rates one, or two times this year, although there is not much conviction regarding the feasibility of the latter policy easing given that the first three months of the year warned that inflation’s path toward the Fed’s 2% will be all but smooth. So the risks prevail, but the FOMO – the fear of missing out – keeps equity bulls running. The S&P500 and Nasdaq, they both closed yesterday at a record high.
But note that the same ‘good but not stellar’ came from the UK inflation report this morning. Inflation in Britain fell from 3.2% to 2.3% in April. This was the first time inflation in Britain begins with a 2 since summer 2021. But the number was higher than the 2.1% penciled in by analysts. Core inflation, on the other hand, eased to 3.9% from 4.2% printed a month earlier – significantly higher than 3.6% penciled in by analysts. Overall, data came as a disappointment. Cable rallied as a kneejerk reaction to the data, as the latest easing in prices washed out the hope of seeing the Bank of England (BoE) cut rates as early as June.
Inflation in Canada, on the other hand, fell more than expected in April and core inflation eased to 1.6% fueling the expectations that the Bank of Canada (BoC) could also overtake the Fed and cut the rates before the Fed.
On the flip side of the world, the Reserve Bank of New Zealand (RBNZ) maintained its policy rate unchanged at 5.5% for the seventh consecutive meeting and said that the restrictive monetary policy has improved capacity pressures and pulled inflation to a 3-year low of 4%. But at 4%, inflation in New Zealand is still above the RBNZ’s 1-3% target range, which justifies the need to keep the rates higher for a bit longer. The kiwi-dollar spiked to a three-month high after the decision. The pair has recovered more than half of ytd losses, but the upside potential depends on the US dollar’s trajectory. And the dollar index is consolidating a touch above its 200-DMA, with limited appetite from the bears to send the index below the major 38.2% Fibonacci support, into a medium-term bearish consolidation zone, at a time when the only certainty is uncertainty about what the Fed should do next. Because note that the dollar’s valuation is very much dependent on Fed expectations and the correlation between the Fed expectations and the dollar index has strengthened to the highest levels since mid-March.
Happy Nvidia day
Today is probably the most important and certainly the most-awaited day of the earnings season as Nvidia is due to reveal its Q1 earnings after the bell. Option markets were pricing in a post-earnings move of more than 8% up or down for Nvidia at last week’s close, a move that could shake the S&P500 0.4% up or down according to Citigroup.
The stakes are high, as are the expectations. The company predicted that its sales will reach $24bn in the Q1, analysts expect a quarterly revenue of $24.6bn according to S&P Global Market Intelligence. Whatever it is, that would be the triple of what the company sold a year ago. EPS is expected to have grown by a fat 400%. The company should beat the sky-high expectations to give a fresh boost to the rally in Nvidia’s stock price – which has doubled since the beginning of this year and multiplied by more than 6.5 times since the beginning of last year. This week’s earnings will either send the stock price above the $1000 per share psychological mark, or trigger profit-taking. Anything less than stellar will unlikely satisfy investors’ appetite.
Normally, when expectations are high, they are harder to beat. But Nvidia has a track record of pumping expectations and beating them with a comfortable margin since the arrival of OpenAI into our lives, at the start of last year. And since then, OpenAI didn’t take a breather. It recently launched a faster and a more intriguing model with improved audio and video features. It can now recognize your emotions and talk to you accordingly. It teams up with various companies, from Reddit to Sanofi, to make its mark everywhere. Spreading AI is not only good for Nvidia’s business, it’s also good for other chipmakers who sell AI chips as well. Microsoft for example announced a new AI-powered PC on Monday that will offer a very high speed, daylong battery life, cooler temperatures and ability to handle AI tasks offline. And they use chips produced by Qualcomm in partnership with Arm. So needless to say that Qualcomm is also having a blast on AI. The company rallied to a fresh ATH yesterday on the news, and has almost doubled its price since the end of 2022. As per Arm, Morgan Stanley guesses that 14% of all Windows PCs will feature Arm systems in 2026. Up from 0%. The latter should give a second-life to the Arm rally. So, overall, the AI rally is probably far from being over. We are still waiting for Apple to announce its own AI plans in a few weeks. Apple’s share price is also preparing to retest the $200 psychological resistance. So any positive news from Nvidia could give a stronger swing to the tech rally.
GBP/JPY Daily Outlook
Daily Pivots: (S1) 198.20; (P) 198.56; (R1) 198.84; More...
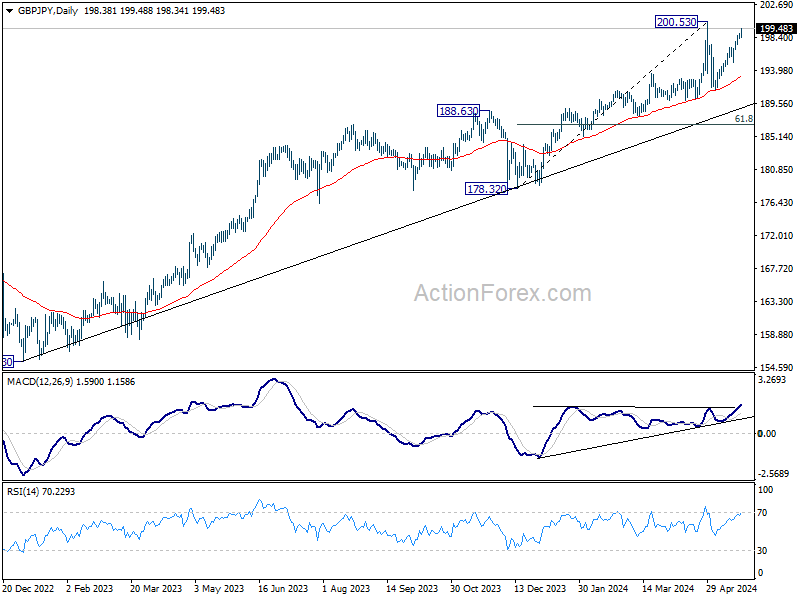
GBP/JPY's rally continues today and intraday bias stays on the upside. Current rise from 191.34, as the second leg of the corrective pattern from 200.53, should target 100% projection of 191.34 to 180.07 from 195.02 at 200.75. But upside should be limited there. On the downside, below 198.25 minor support will turn intraday bias neutral first. Further break of 195.02 will argue that the third leg has started, and target 191.34 support and possibly below.
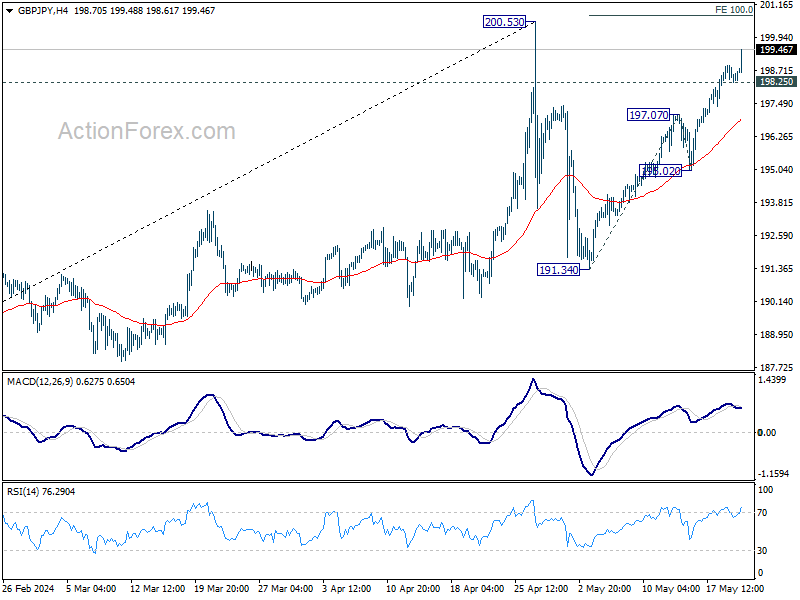
In the bigger picture, a medium term top could be in place at 200.53 after breaching 199.80 long term fibonacci level. As long as 55 W EMA (now at 183.41) holds, fall from there is seen as correcting the rise from 178.32 only. However, sustained break of 55 W EMA will argue that larger scale correction is underway and target 178.32 support.
EUR/JPY Daily Outlook
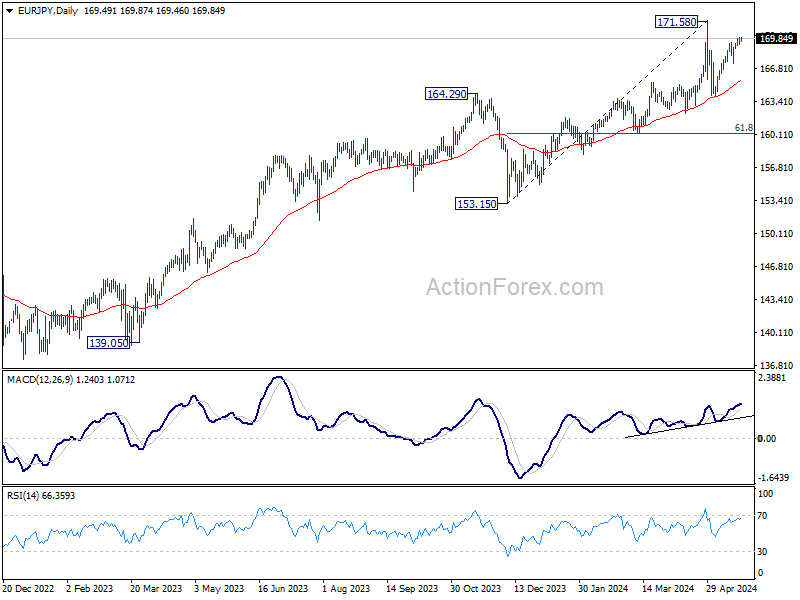
Daily Pivots: (S1) 169.18; (P) 169.56; (R1) 169.90; More...
Further rally remains in favor in EUR/JPY despite loss of upside momentum. Rise form 164.01, as the second leg of the corrective pattern from 171.58, would target 61.8% projection of 164.01 to 169.38 from 167.31 at 170.62. On the downside, break of 167.31 support should turn bias back to the downside to start the third leg towards 164.01.
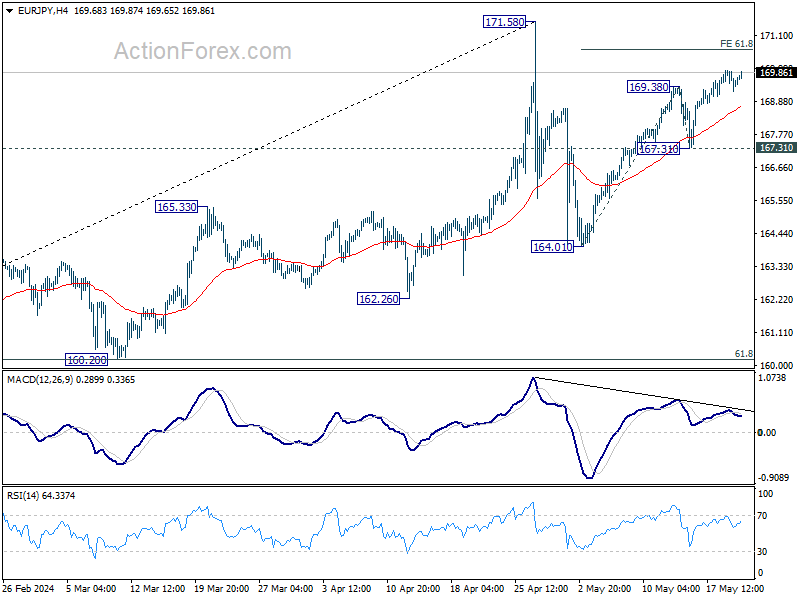
In the bigger picture, a medium top could be formed at 171.58 after brief breach of 169.96 (2008 high). As long as 55 W EMA (now at 158.30) holds, fall from there is seen as correcting the rise from 153.15 only. However, sustained break of 55 W EMA will argue that larger scale correction is underway and target 153.15 support.
EUR/GBP Daily Outlook
Daily Pivots: (S1) 0.8532; (P) 0.8542; (R1) 0.8549; More...
EUR/GBP accelerates lower today and the break of 0.8529 support argues that larger down trend is ready to resume. Intraday bias stays on the downside for 0.8491/7 support one. Firm break there will confirm this case and target 0.8376 projection level next. On the upside though, above 0.8550 minor resistance will delay the bearish case and turn intraday bias neutral first.

In the bigger picture, outlook remains bearish as EUR/GBP is capped below medium term falling trendline. That is, down trend from 0.9267 (2022 high) is still in progress. Firm break of 0.8491/7 will target 100% projection of 0.8764 to 0.8497 from 0.8643 at 0.8376.

EUR/AUD Daily Outlook
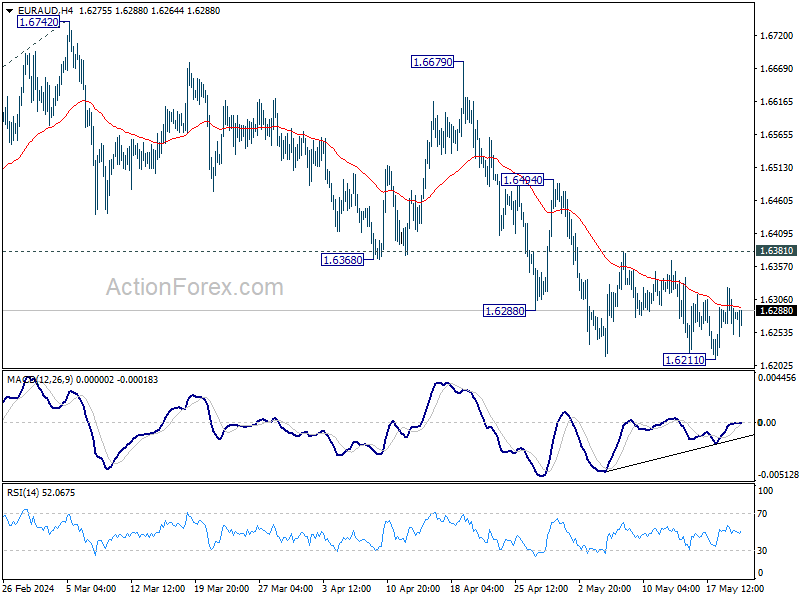
Daily Pivots: (S1) 1.6248; (P) 1.6288; (R1) 1.6323; More...
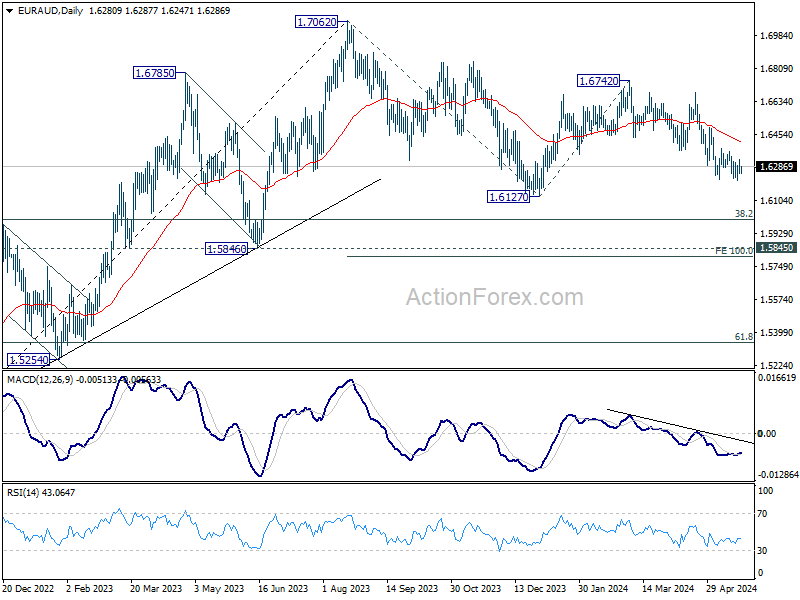
Intraday bias in EUR/AUD remains neutral, but further decline remains in favor as long as 1.6381 resistance holds. Break of 1.6211 will resume larger corrective decline from 1.7062 to 1.6127 support, or further to 100% projection of 1.7062 to 1.6127 from 1.6742 at 1.5807. However, break of 1.6381 will turn bias back to the upside for stronger rebound.
In the bigger picture, fall from 1.7062 medium term top is seen as a correction to the up trend from 1.4281 (2022 low). In case of deeper fall, strong support is expected around 1.5846 and 38.2% retracement of 1.4281 to 1.7062 at 1.6000 to bring rebound. Break of 1.7062 is in favor as a later stage.
EUR/CHF Daily Outlook
Daily Pivots: (S1) 0.9873; (P) 0.9884; (R1) 0.9897; More....
Intraday bias in EUR/CHF is turned neutral first as it continued to lose upside momentum ahead of 61.8% projection of 0.9304 to 0.9847 from 0.9563 at 0.9899. Further rally is expected as long as 0.9835 resistance turned support holds. Firm break of 0.9899 will pave the way to 100% projection at 1.0106, which is slightly above 1.0095 key structural resistance. However, break of 0.9835 will turn bias to the downside for deeper pullback.
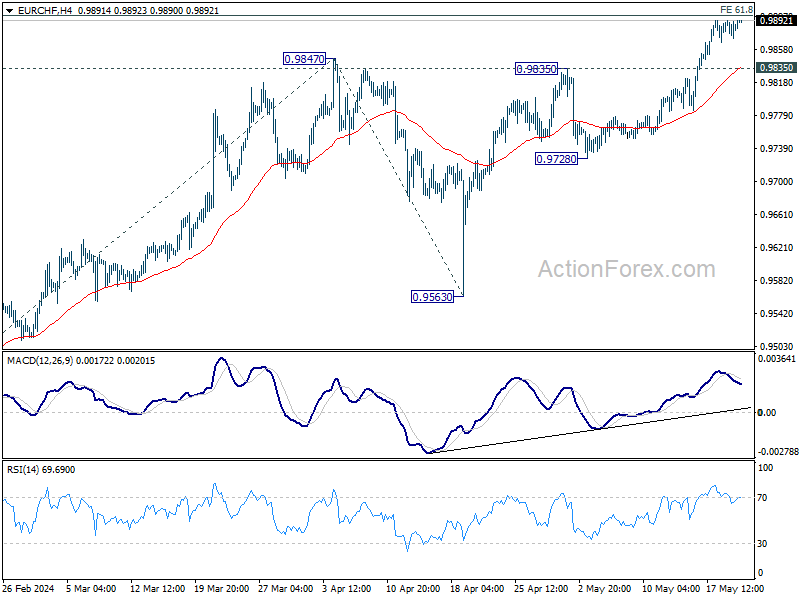
In the bigger picture, as long as 0.9563 support holds, rise from 0.9252 medium term bottom is still in favor to continue. Next target is 38.2% retracement of 1.2004 (2018 high) to 0.9252 (2023 low) at 1.0303, even as a correction to the down trend from 1.2004.